
Latest News
[January 27, 2025] Earthquake near Miyazaki, Japan
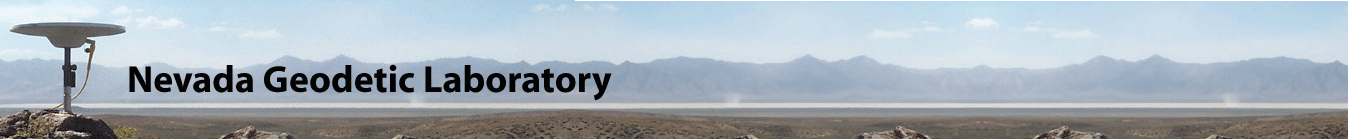
On January 13, 2025 an M6.8 earthquake struck off the southeast shore of Japan. The epicenter was very near another large earthquake (M 7.1) that occurred in April 2024 (see story below).The January event could be seen as an aftershock since it occurred after, and was substantially smaller than, the April event. However, since it was not much smaller in magnitude than the April event, it could be seen as the second of a doublet, which ruptured the same segment of the plate boundary between the Philippine Sea and Eurasian tectonic plates. The January and April events do have very similar coseismic displacement patterns onshore (though the vector scales are different in the two plots).
NGL used about 10 days of data before and after the event from Japan's GNSS Earth Observation Network System (GEONET) to create 5 minute position time series at each station with the GipsyX software and rapid satellite orbits from the Jet Proplusion Laboraotory. From these time series we estimated coseismic displacement. The results are depicted in the figure below and coseismic offsets are available as a text file at this link.
The largest displacement was a little over 5 cm at continuously recording station J095.
[December 16, 2024] M 5.8 Earthquake in the Central Walker Lane
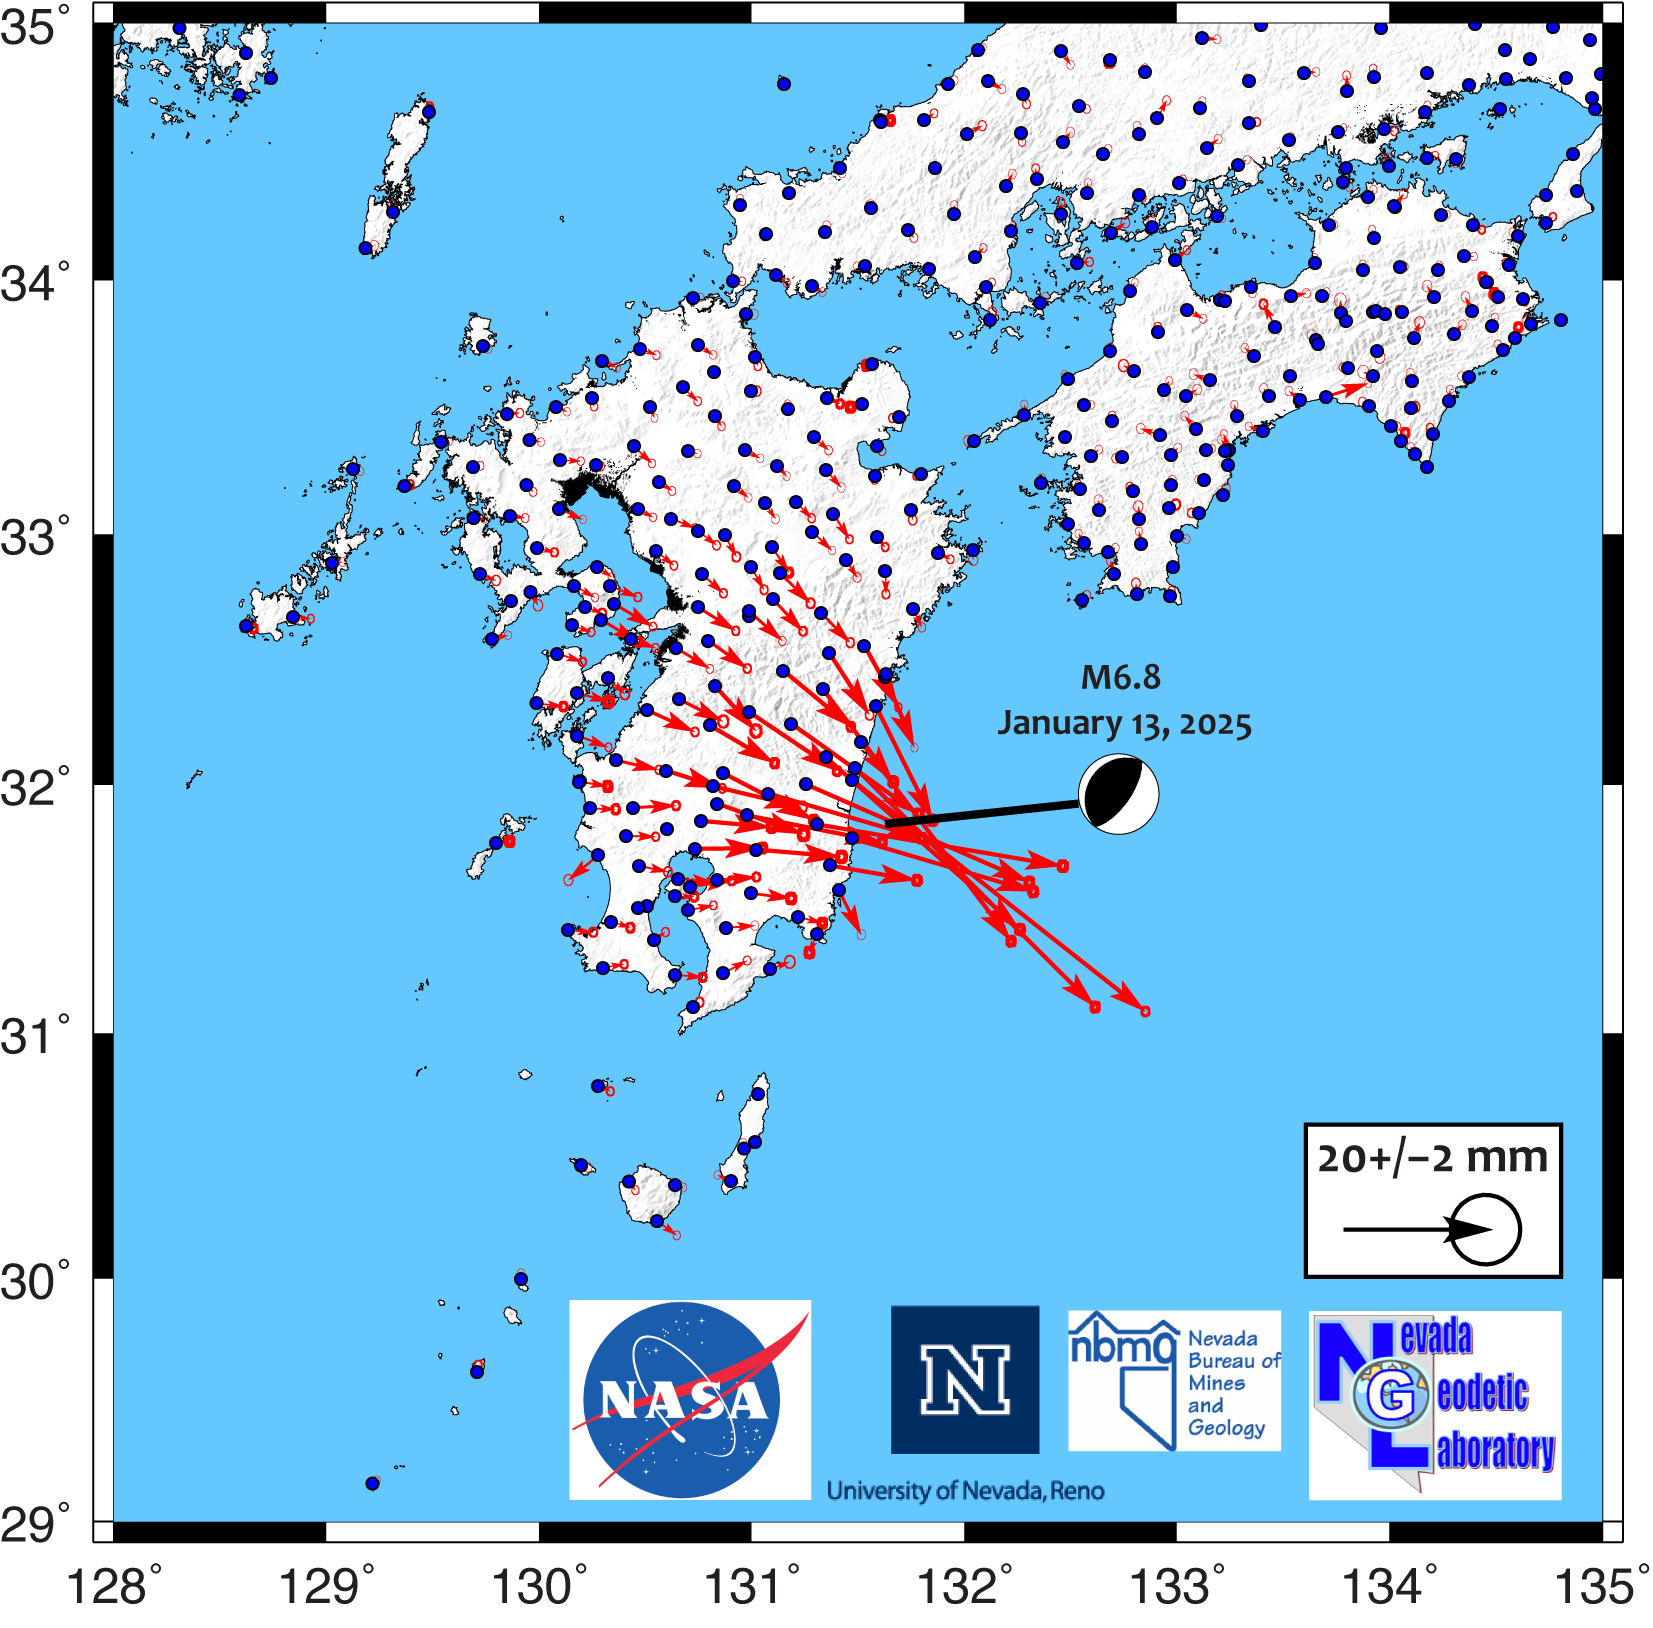
On December 9 at 3:08 pm local time an earthquake struck in the vicinity of the town of Yerington, Nevada, about 60 km east of the state capitol Carson City. The Nevada Bureau of Mines and Geology has posted a summary of the event on the Nevada Earthquake Clearing house site, which contains documentation of earthquake effects. Further techinical data are available at the USGS page for the event.At NGL we used 5 minute time series processed with the GipsyX software and rapid satellite orbits from the Jet Proplusion Laboraotory, taking about a week of data before the event and several days after to estimate coseismic displacement at GPS stations. The results are depicted below in the figure and are available as a text file at this link. These results are preliminary while we continue to collect data in our MAGNET GPS Network (red dots in the map figure below that have no vectors yet).
The displacements at continuously recording stations P130 and YER1 are ~8 mm and ~6 mm respectively. These movements are small but greater than the uncertaianties in the GPS measurements and are consistent with left-lateral slip on a east/northeast striking fault aligned with tectonic motion across the Wabuska Lineament. Station P130 is operated by the EarthScope Consortium, in the GAGE facility on behalf of the the National Science Foundation. Station YER1 is part of the Nevada GPS Network operated by State of Utah's Automated Geographic Reference Center in the Department of Technology Services.
[December 11, 2024] M 7.0 Earthquake Off Coast of California
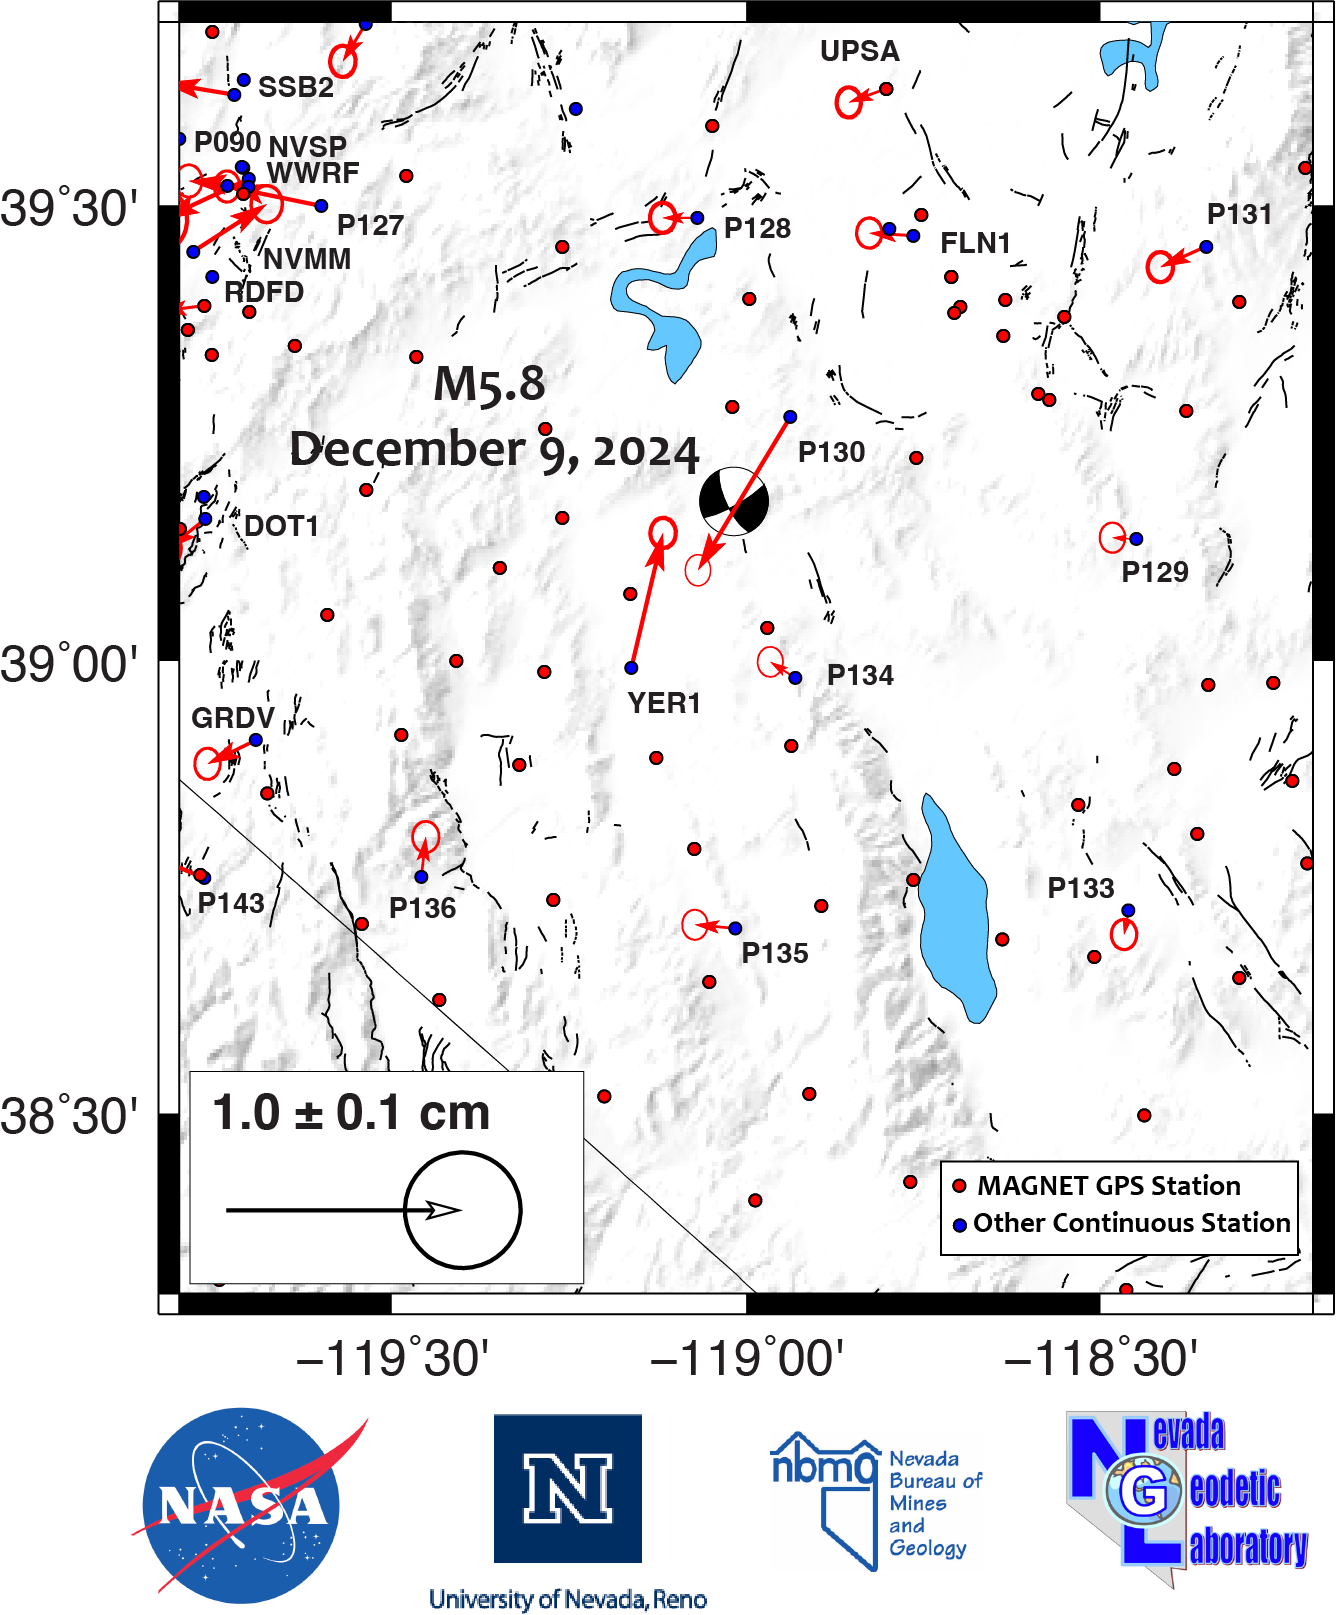
On December 5 a strike slip earthquake struck offshore approximately 100 km southwest of the town of Ferndale, CA, in the vicinity of the Mendocino Triple Junction where the northern end of the San Adreas Fault meets the southern end of the Cascadia subduction zone. The USGS summary of the event describes the tectonic context and history of past earthquakes here.At NGL we used 5 minute time series processed with the GipsyX software and rapid satellite orbits from the Jet Proplusion Laboraotory, taking a week of data before the event and several days after to estimate coseismic displacement at GPS stations. The results are depicted below in the figure and are available as a text file at this link.
The largest displacement occurred at station P159 and was over 6 cm to the northeast. A sharp turn in the displacement azimuths from north to south within the Cape Mendocino area is consistent with right lateral slip on a fault striking ~100˚ clockwise from north.
[November 11, 2024] New IGS 2020 Processed Data Products
A note to users of NGL data products: NGL is transitioning from our existing IGS14 framework (using GipsyX-1.0 software) to the newer IGS 2020 framework using the GipsyX-2.3 software, products and reference frame. The reprocessing of our entire data holdings has begun in earnest, but will take several months to complete. The result should be a substantial improvement in precision and utility of the processed GPS time series and related products.The new framework is implemented with NGL's updated data processing strategy which is posted HERE.
The main difference in parameter estimation strategy is the loosening of the random walk of tropospheric parameters by a factor of 2, which is consistent with JPL’s latest orbit strategy, and consistent with recommendations by: Young, Z.M., G. Blewitt, C. Kreemer (2024). Improved GPS tropospheric path delay estimation using variable random walk process noise. Journal of Geodesy, 98:89, https://doi.org/10.1007/s00190-024-01898-3.
For those who cite our products please continue to use: Blewitt, G., W.C. Hammond, and C. Kreemer (2018). Harnessing the GPS data explosion for interdisciplinary science. Eos, 99, https://doi.org/10.1029/2018EO104623.
Also note that the arrival of new products will require a reorganization of the directory structure that our system uses to present all data products, including time series, velocities, troposphere files, plots, station pages, etc. The layout of the coming directory structure is posted HERE.
All IGS20 time series will be placed in http://geodesy.unr.edu/gps_timeseries/IGS20/ as they become available. For now IGS14 files remain in their same current directories, but will be moved to the directory http://geodesy.unr.edu/gps_timeseries/IGS14/ in the future. This will keep the products obviously and stictly separated between IGS14 and IGS20.
While the reprocessing is underway NGL's GPS station pages will link to the IGS14 data products.
Users may wish to prepare for the transition when the files appear in new directories. We will post messages here with further updates when needed.
[October 8, 2024] New Paper! GPS Positioning in Storms
Accurate positioning using the Global Positioning System relies on accurate modeling of the troposphere. Estimated tropospheric delay must vary sufficiently to capture true variations and maintain accuracy while coping with noisy data.In a new study that has just been published by Young et al. in the Journal of Geodesy they investigate the optimal choice of tropospheric constraints applied in the GipsyX software that performs positioning with GPS data. They use 5-min vertical displacement estimates coincident with Winter Storm Ezekiel of November 27, 2019 that crossed the central/eastern USA to find optimal values needed to improve station coordinate estimation. These are especially important for the vertical component of land motion. Loosening the constraint suppresses the spurious waves associated with the storm and reduces 5-min vertical displacement variability while improving water vapor estimates.
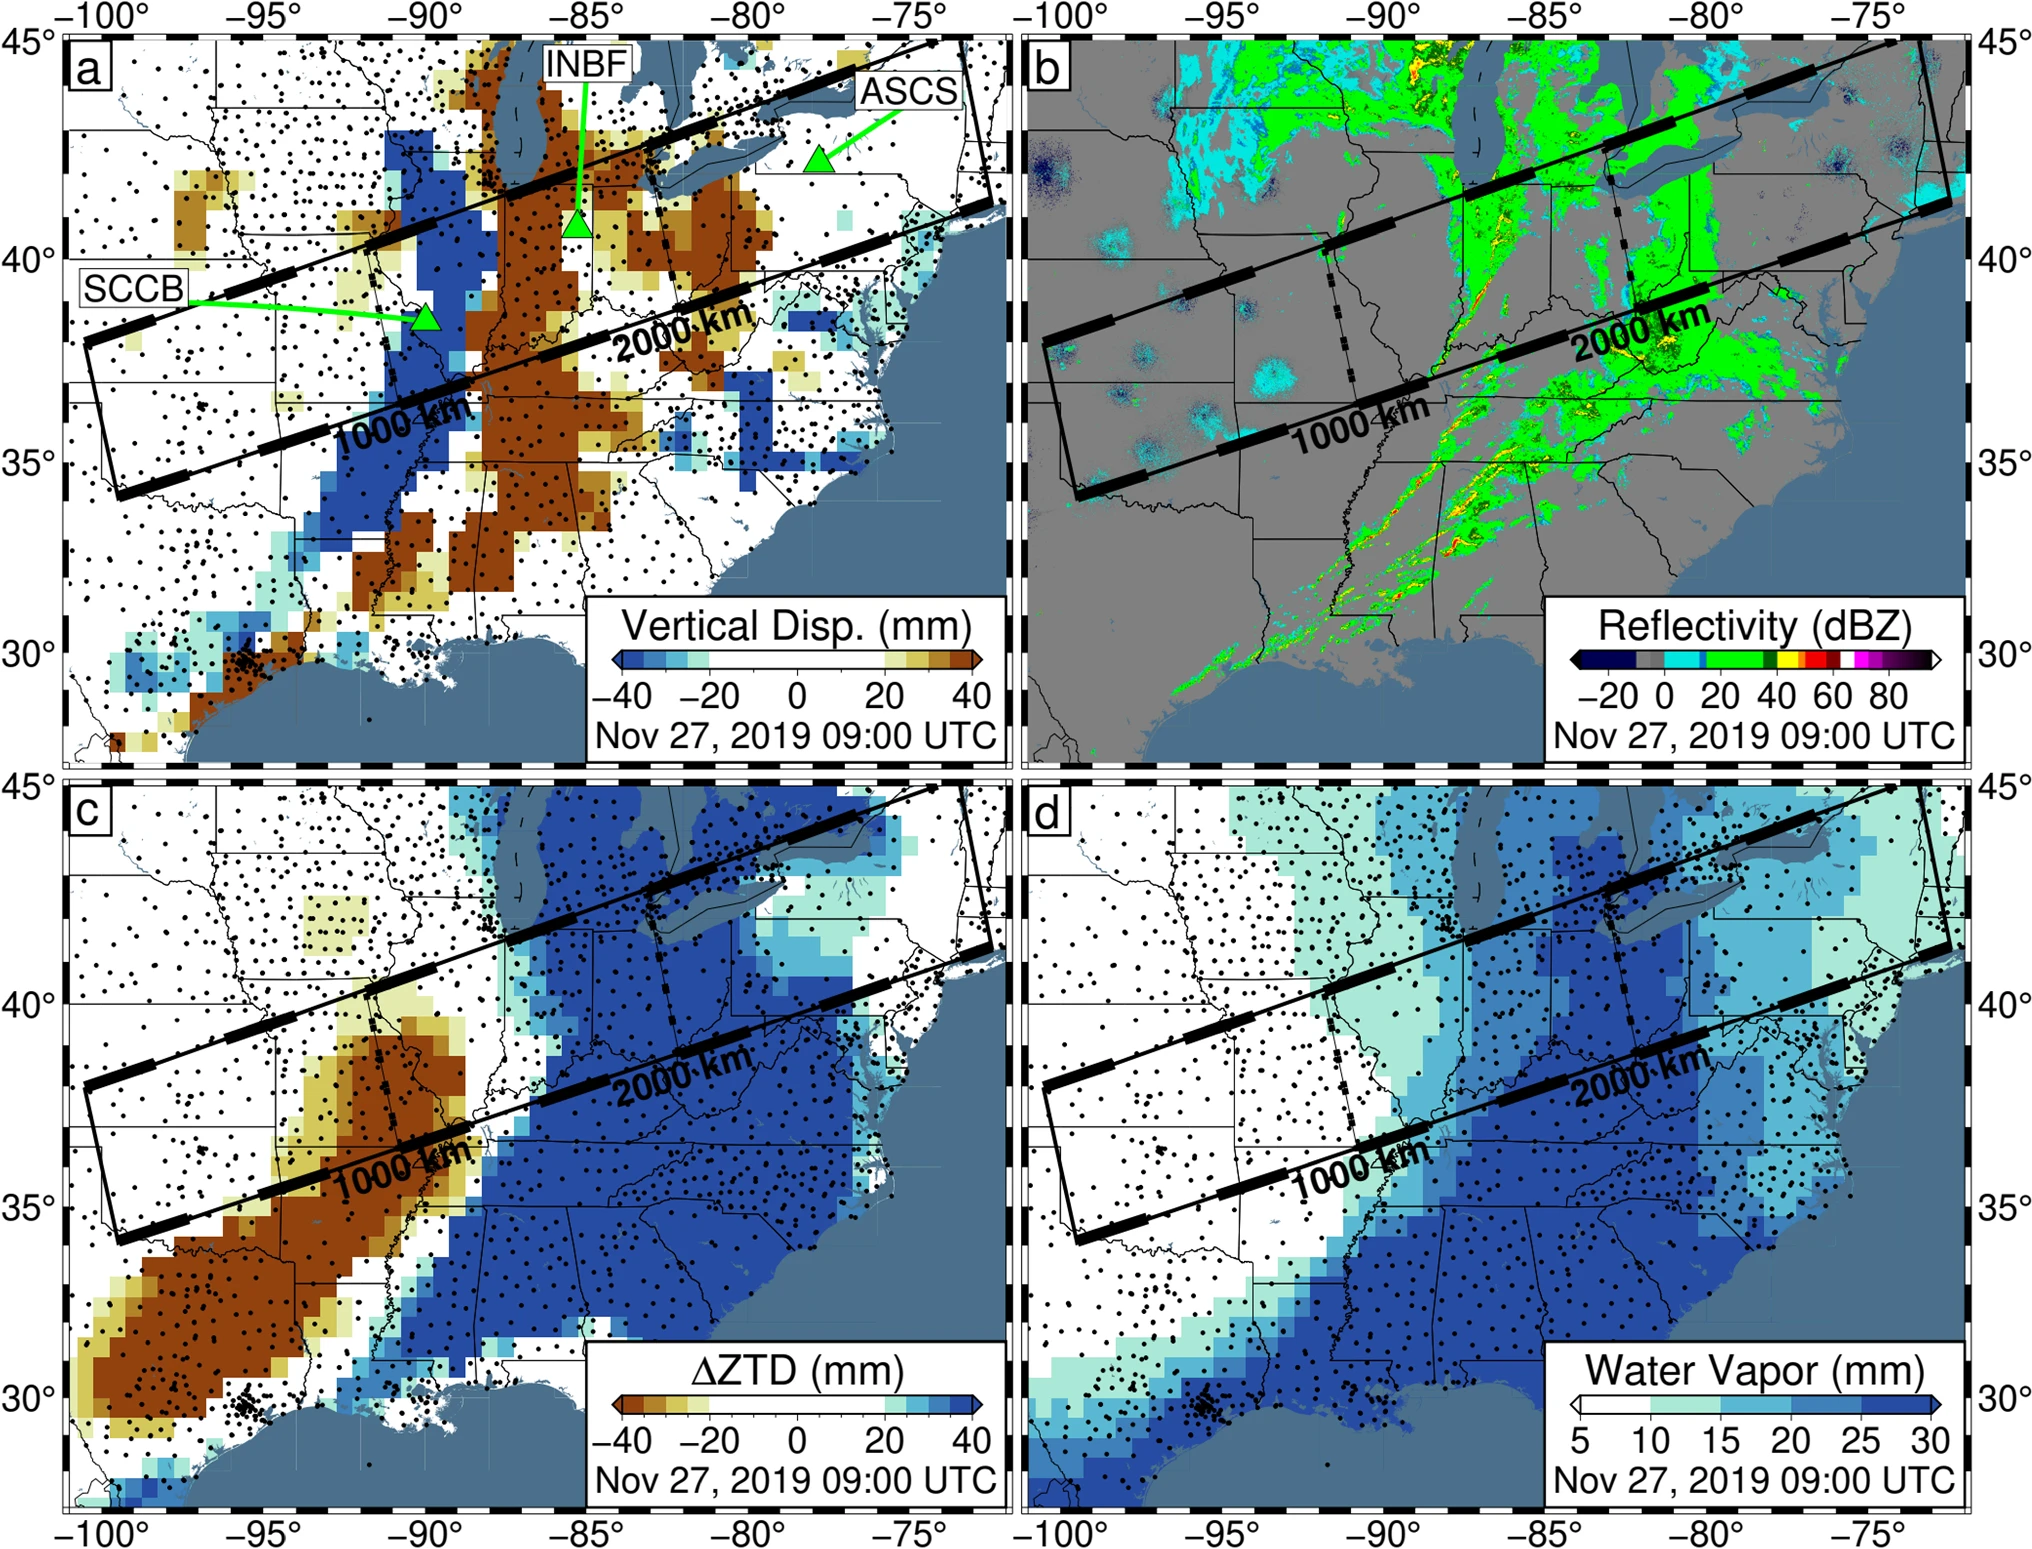
Figure Data snapshots on November 27, 2019, at 09:00 UTC for the central/eastern USA. a Observed GPS vertical displacements. Green triangles represent the locations of GPS stations SCCB, INBF, and ASCS whose time series are presented in Fig. 4. b Radar reflectivity (green values indicate precipitation; Herzmann 2022). c Zenith total delay (ZTD) deviation. For each station, the median ZTD across November 26–27 is removed. d Integrated water vapor inferred by GPS. Note the spatial correlation between vertical uplift and observed radar reflectivity. Data presented in panels a, c, and d are produced using the current NGL data analysis strategy and have been filtered with Robust Network Imaging. Small black dots represent GPS station locations
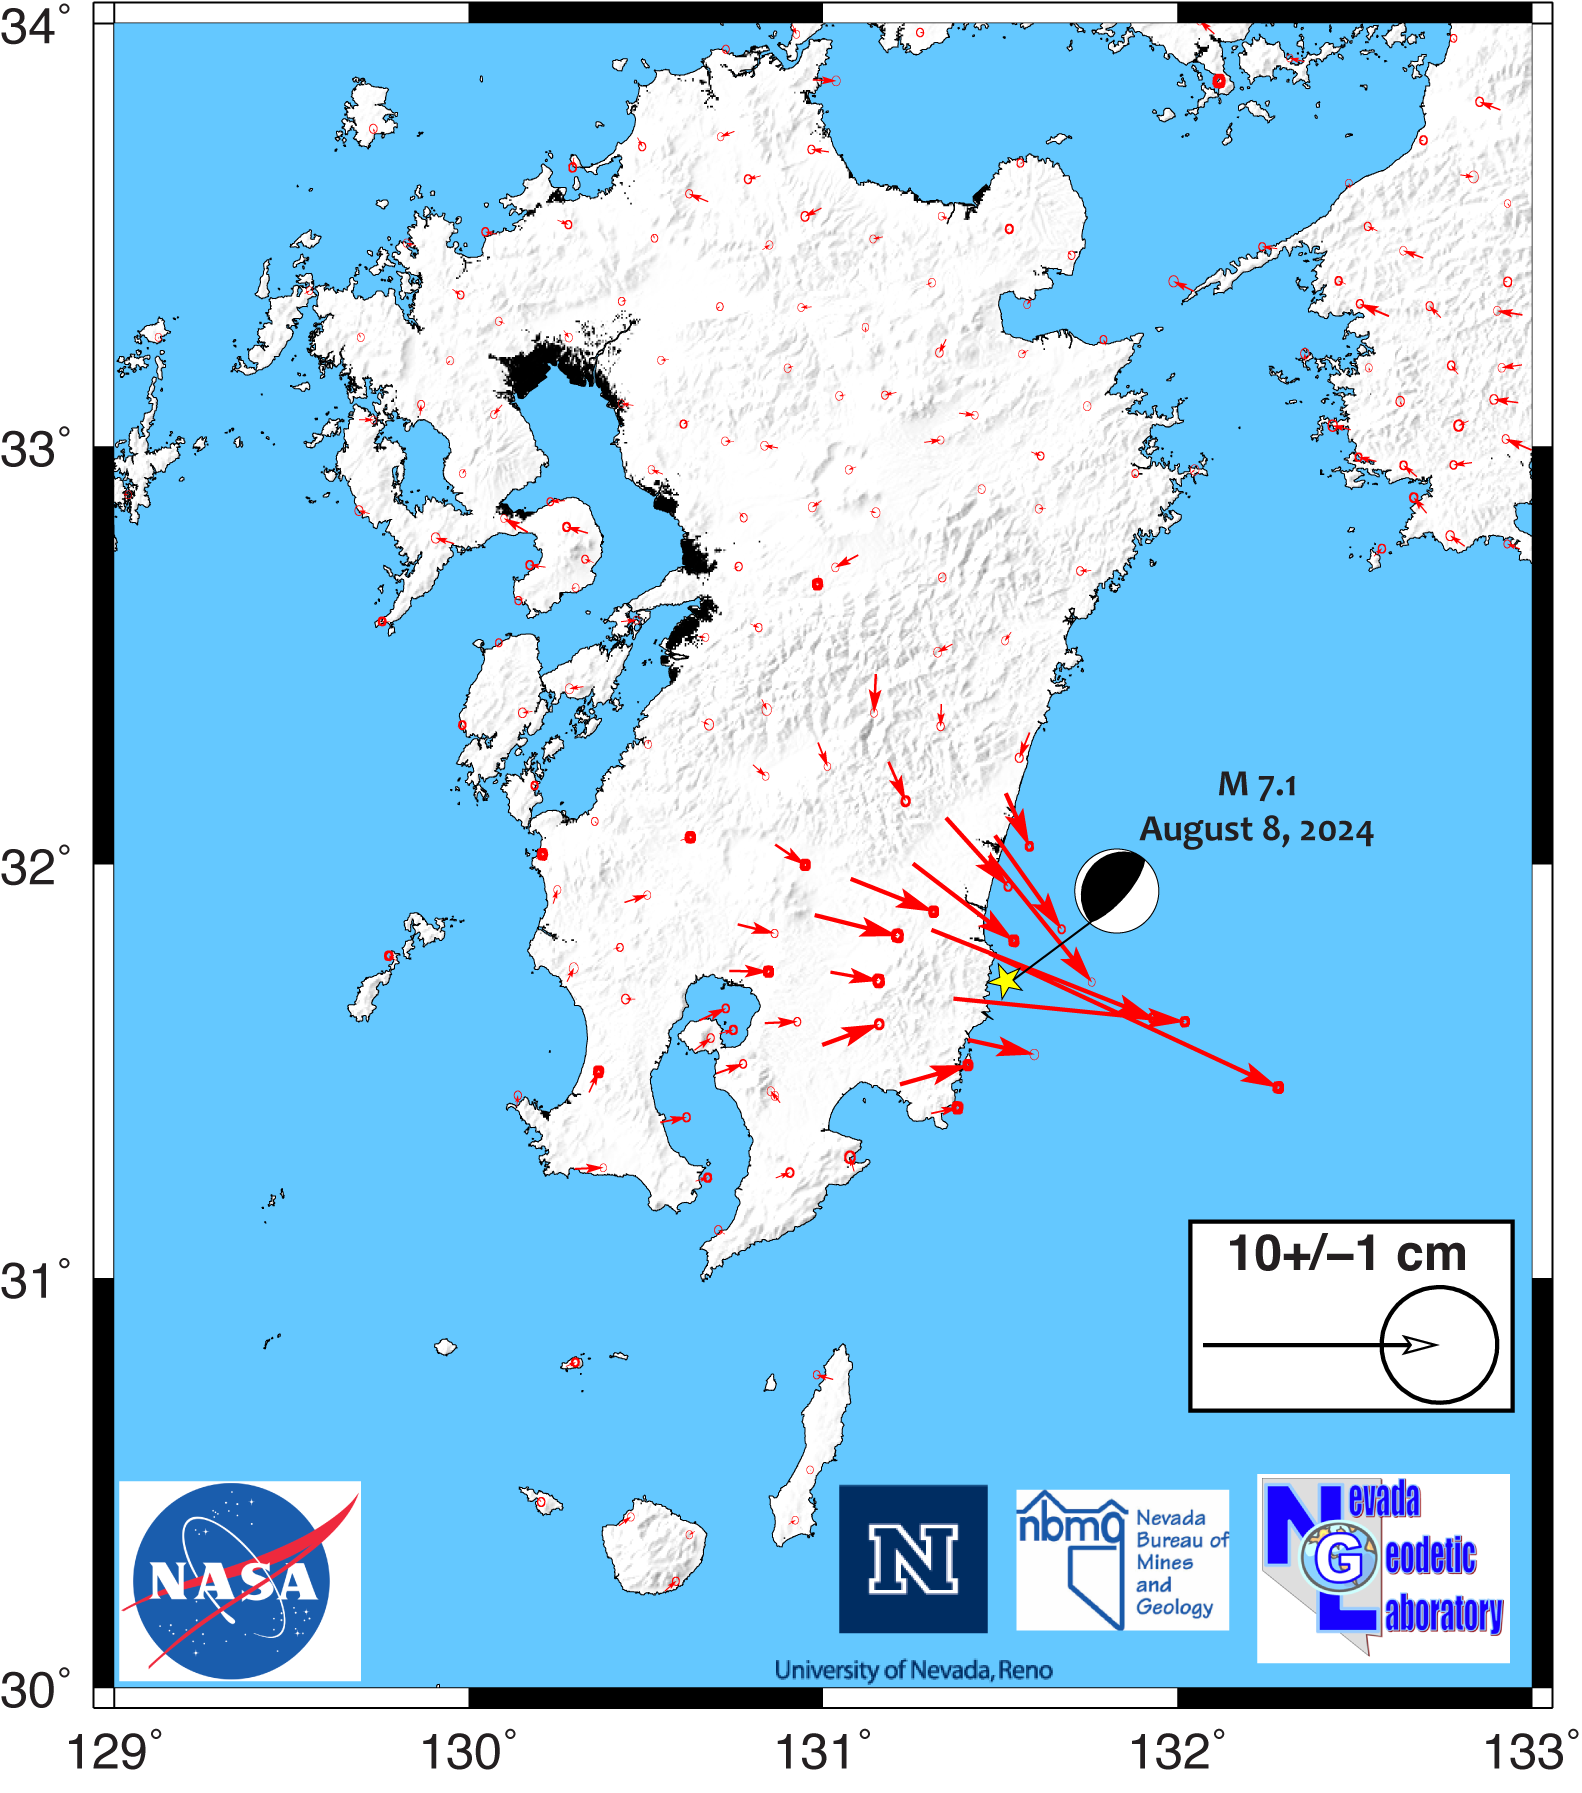
[April 12, 2024] M 7.1 Earthquake Hits Southern Japan
On April 8, 2024 an earthquake struck the east coast of southern Japan, near Miyazaki. The event created strong shaking, caused minor injuries, triggered a tsunami advisory and concerns about it raising the level of risk from larger earthquakes in the Nankai trough.While the event struck offshore with an epicenter east of the Pacific Coast, it was large enough to move stations in Japan's GNSS Earth Observation Network System (GEONET) significantly. The Nevada Geodetic Laboratory processed data with the Jet Propulsion Laboratory's GipsyX software and rapid orbit products to generate 5-minute position time series at all stations in their network. We computed the differences in positions with 7 days of data before and ~16 hours of data after the earthquake.
The coseismic displacement pattern (red vectors in figure below) shows coherent movement towards the coast and epicenter, consistent with the event's thrust mechanism. The USGS page for this event describes the parameters of the event, including the moment tensor that is shown in the figure. The largest displacement was at station G088, which moved over 13 cm to the southeast, towards the epicenter.
A preliminary coseismic displacement table is available HERE. A slip model developed by the USGS using these data can be seen HERE. Coseismic displacement estimates will become more accurate as more post-event data are collected.
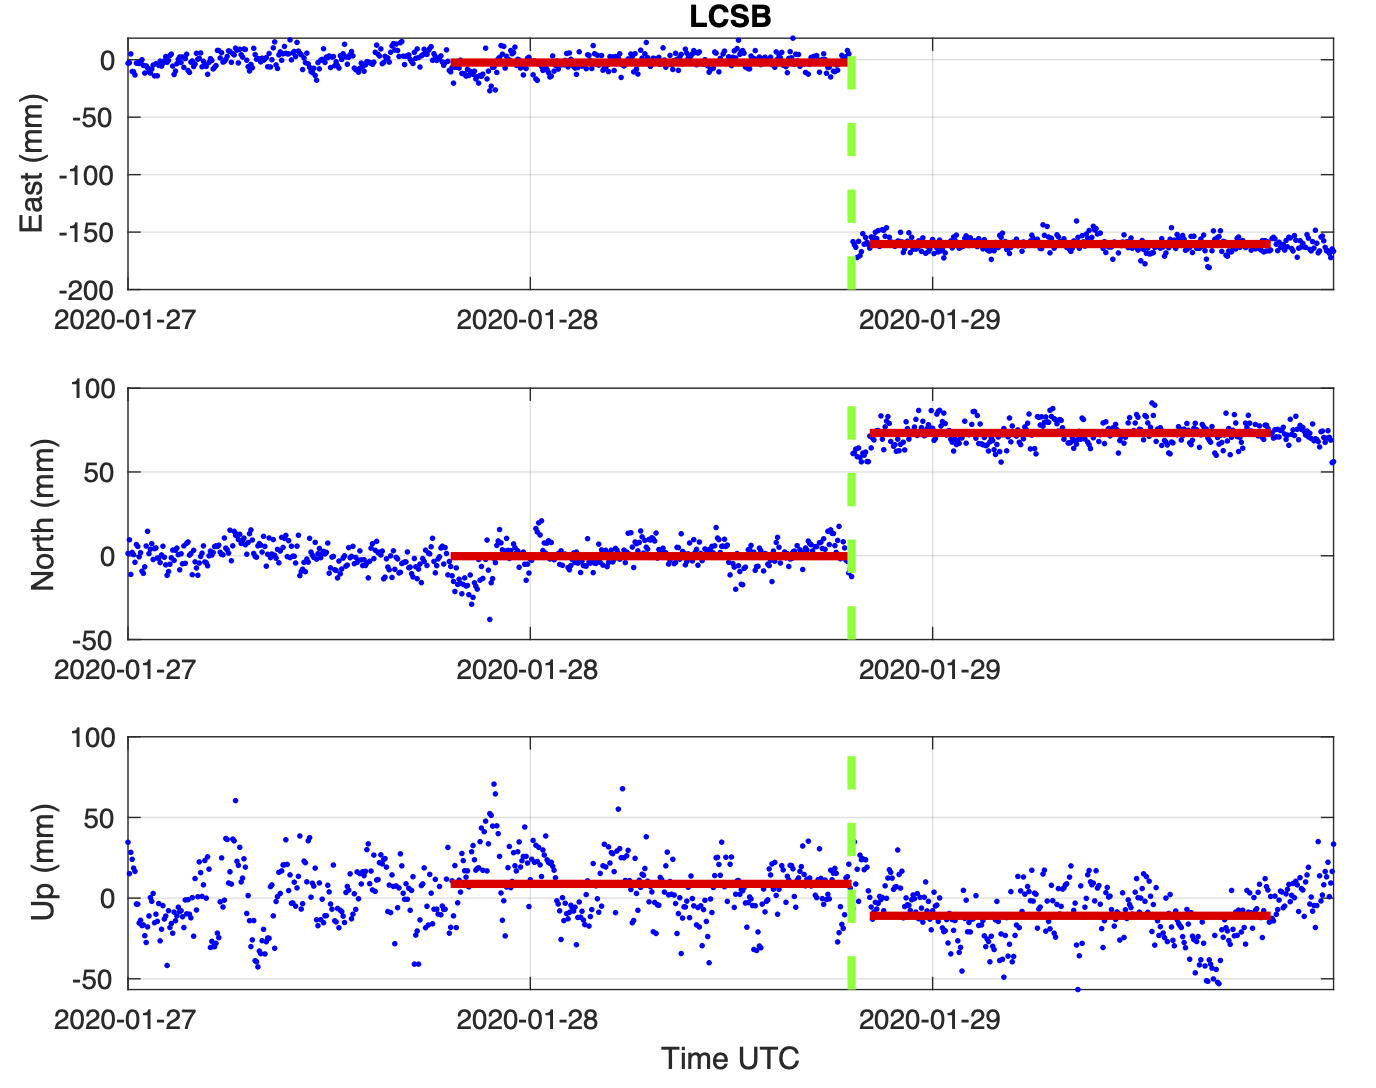
The figure below the map shows the 5 minute sample rate time series for station G088. The event time on 8 Aug 2024 is shown with the green dashed line.
[May 9, 2024] Professor Geoffrey Blewitt elected to the National Academy of Science
On April 30, 2024 Nevada Bureau of Mines and Geology faculty member, and Nevada Geodetic Laboratory founder Professor Geoffrey Blewitt was notified that he has been elected to membership in the National Academy of Science. Geoff is the fifth person in field of geodesy to have ever been elected. Just one other person from UNR has ever received this recognition. Election to one of the National Academies is considered one of the highest honors that can be accorded a scientist or engineer, and almost 200 of its members also have won Nobel Prizes.
See the Nevada Today artictle and the NAS News page for more details.
Many Congratulations on this great achievement, Geoff!
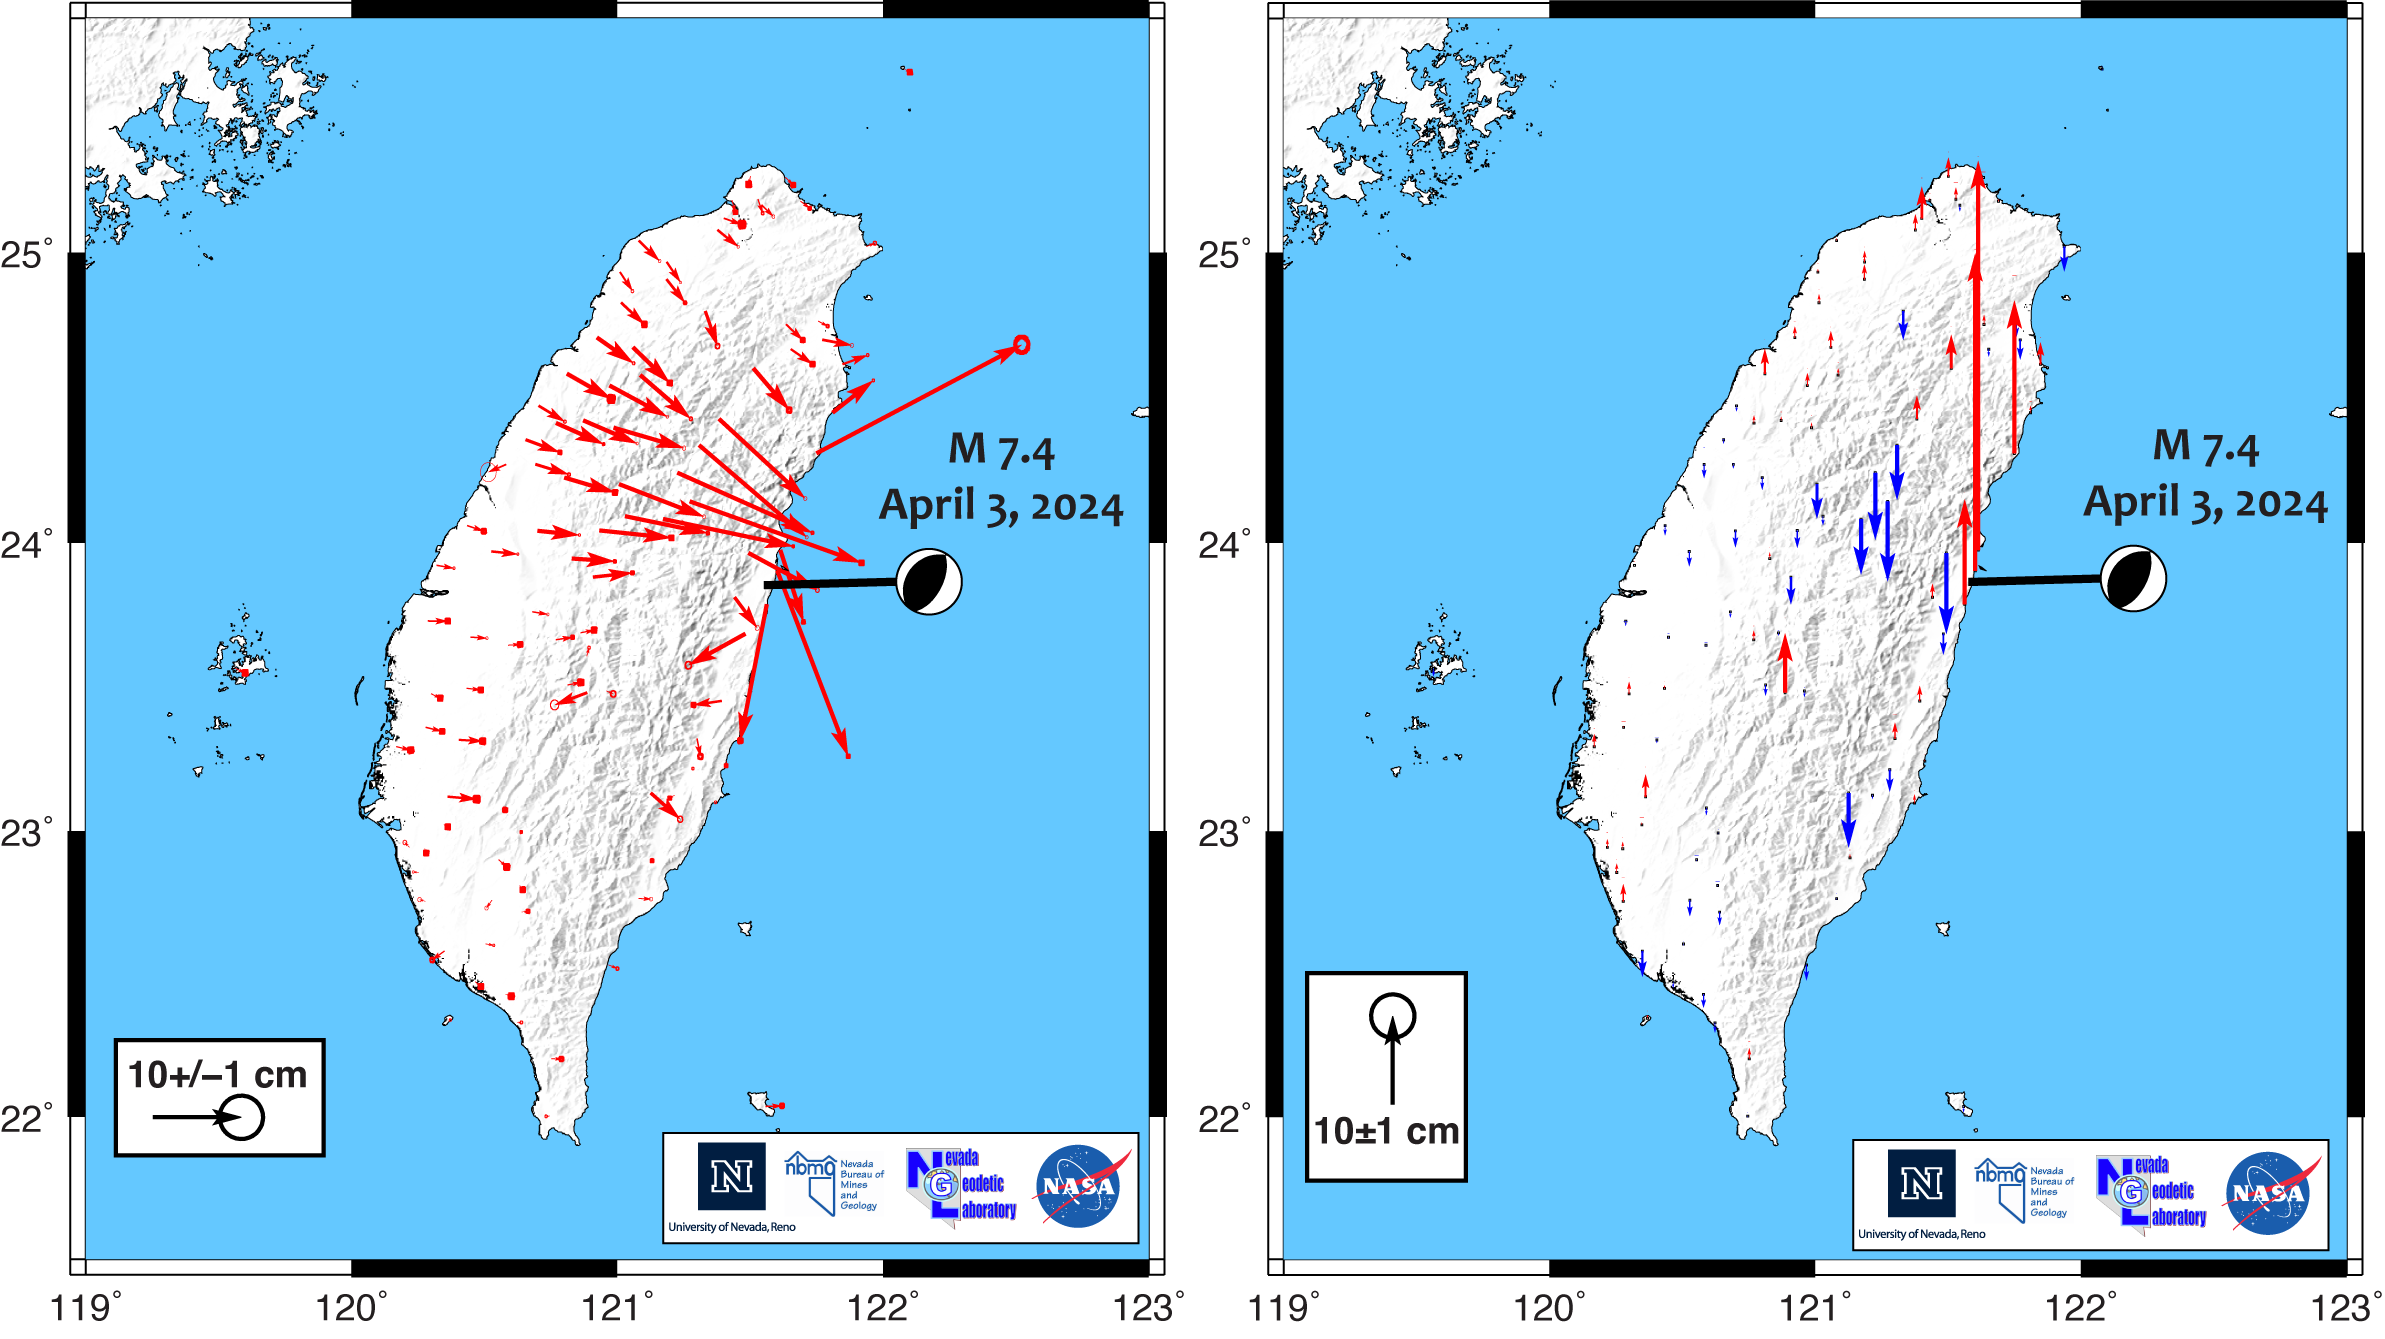
[April 5, 2024] M 7.4 Earthquake hits Taiwan
On April 3, 2024 local time the east coast of Taiwan experienced a thrust earthquake that created strong shaking, loss of life, landslides and collapsed buildings. This USGS page describes the parameters of the event.The Nevada Geodetic Laboratory used data from the Central Weather Administration of Taiwan, processing it with JPL's GipsyX software using rapid oprbits to obtain 5 minute sample rate station position time series.
We used the results to estimate three-component coseismic displacements for over 100 stations on the island of Taiwan. Significant displacement extended all the way across the island to the west coast.
The maximum vertical displacement was over 40 cm of uplift at station HUA3. The time series of 5 minute solutions is shown below.
A file with preliminary coseismic offsets is available HERE.
[February 28, 2024] New Paper on Walker Lane Fault Slip Rates!
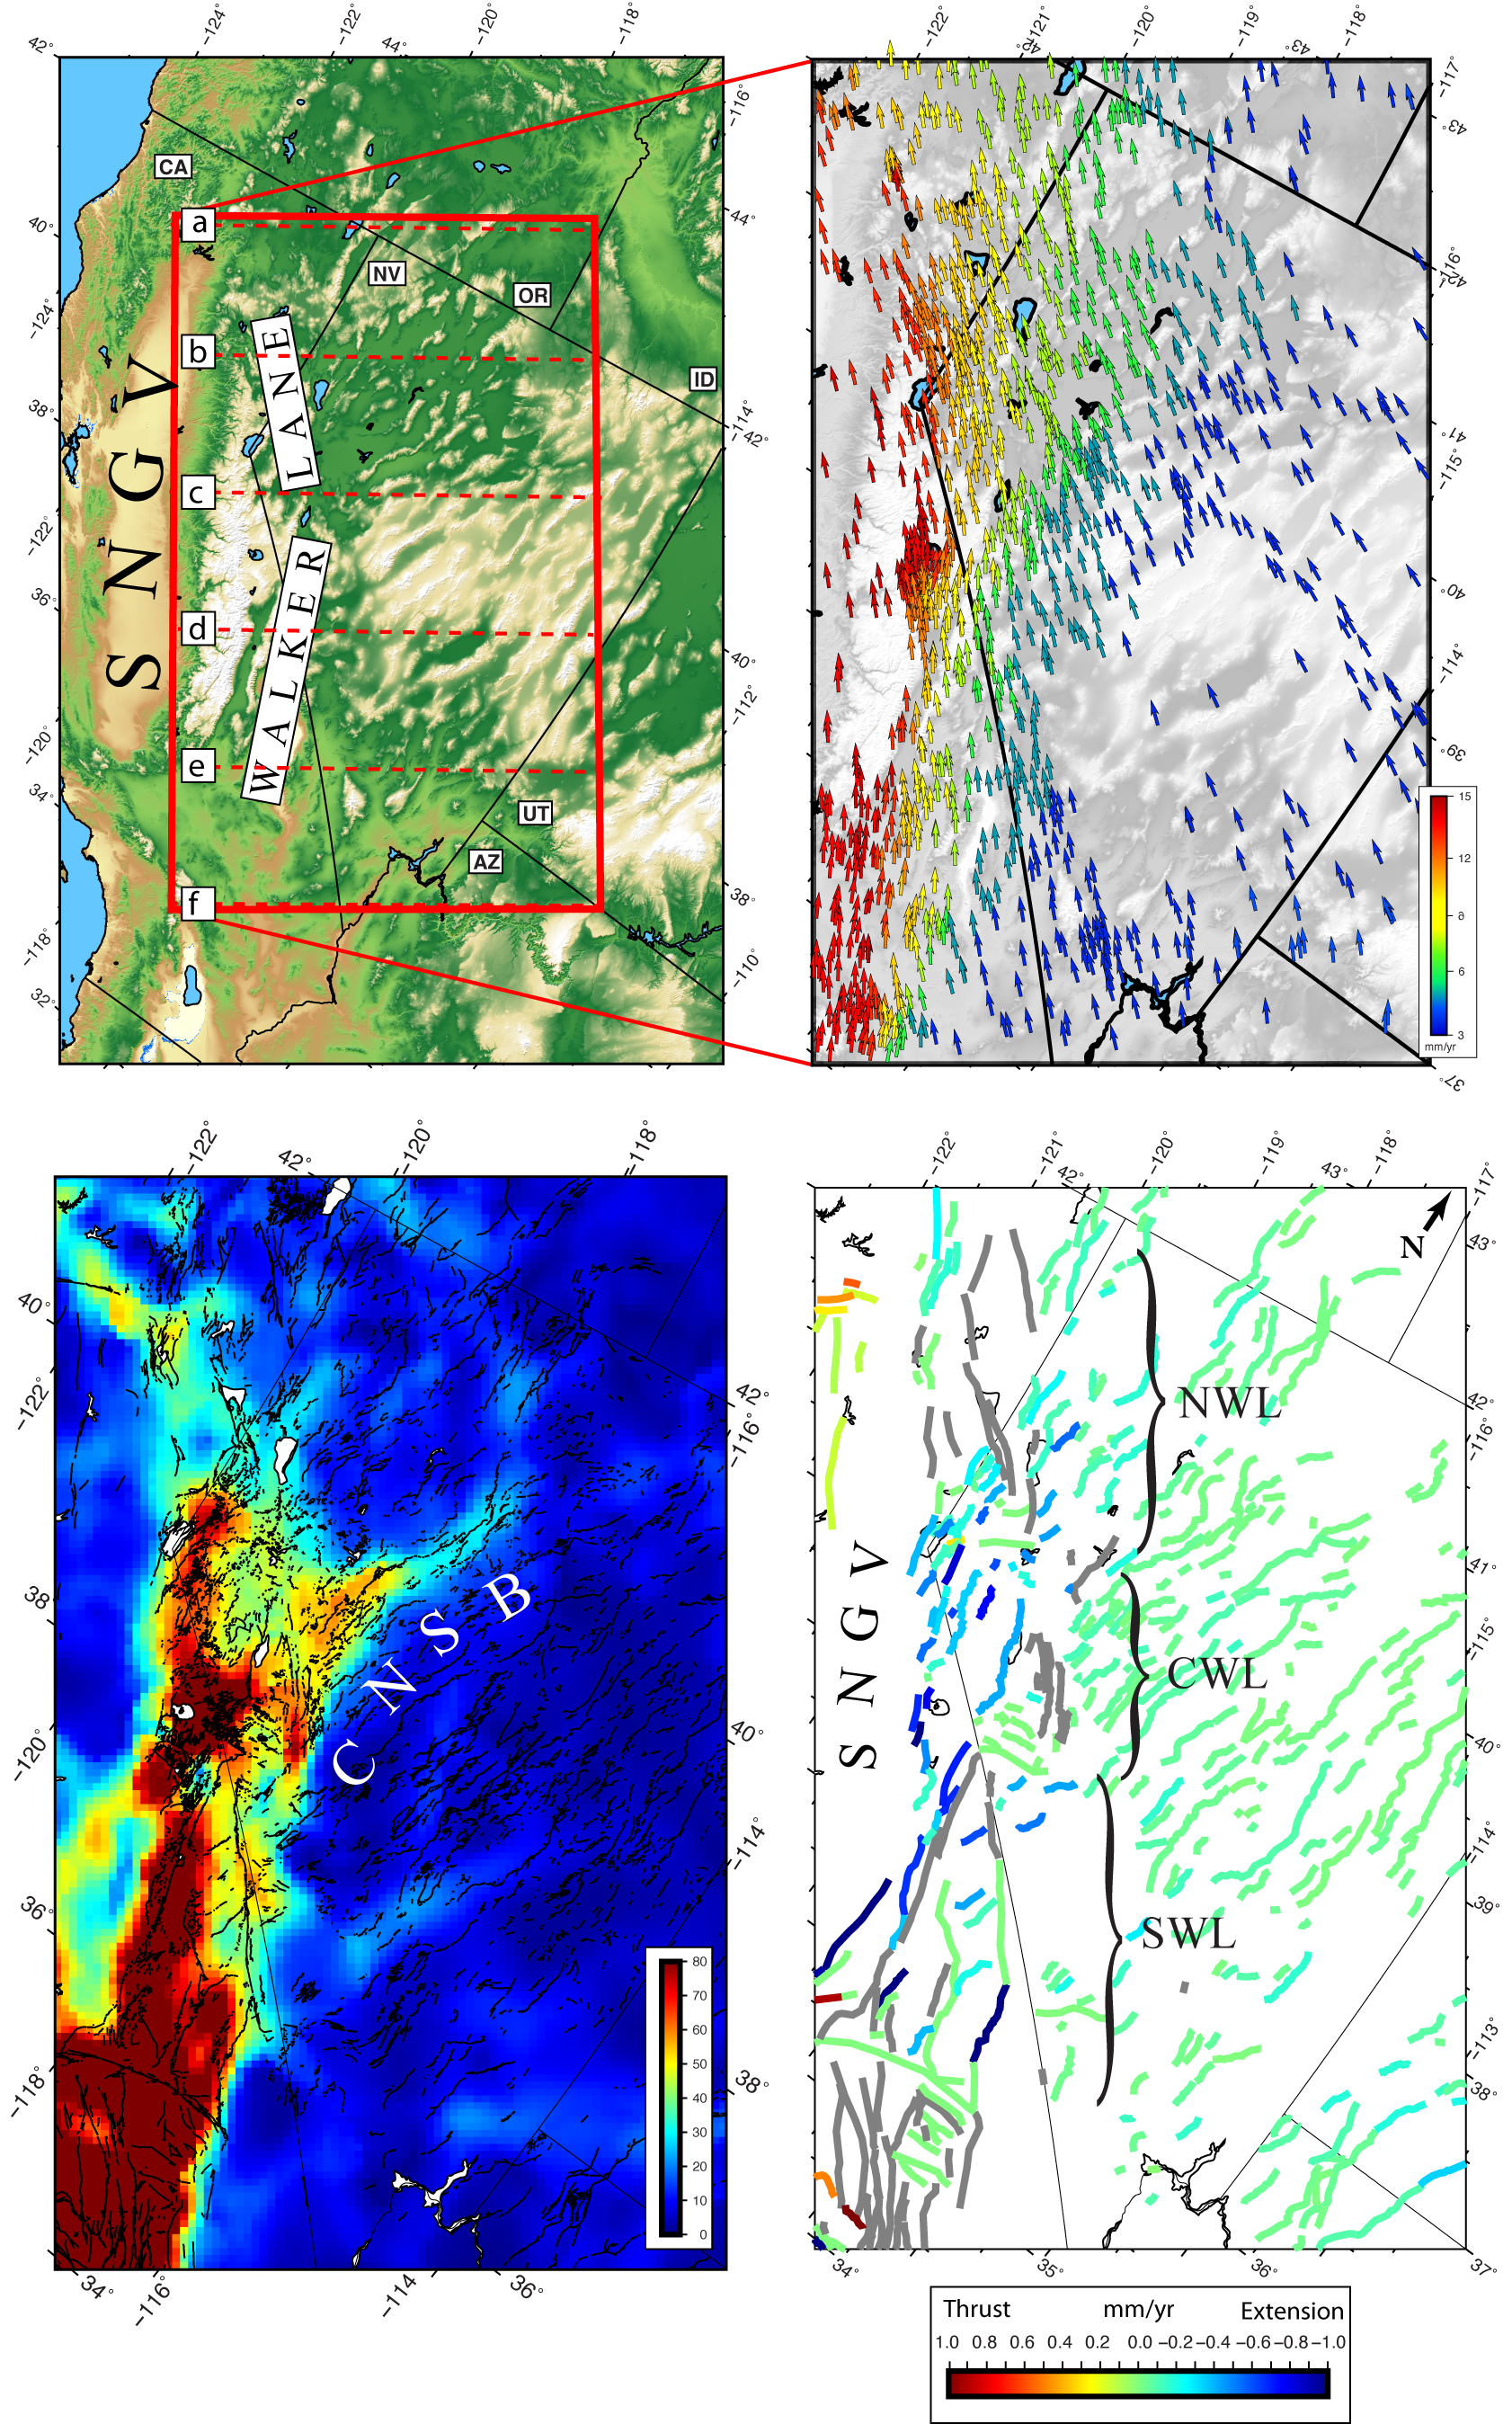
We have developed a new method for estimating fault slip rates from geodetic velocity fields in plate boundaries with complex fault systems. The technique relies on an ensemble approach to block modeling where the models are repeated generated from the fault geometry data. The method is demonstrated in the Walker Lane where hundreds of faults in the Western Great Basin accommodate the relative tectonic motion between the Pacific/North America plates.The estimated slip rates from geodesy are independent of geologic slip rates, yet still 80% agree with them to within uncertainties. The method images off-fault deformation and vertical axis rotations, providing more insight into how crustal motion drives earthquakes.
The paper is available at the Journal of Geophysical Research - Solid Earth (https://doi.org/10.1029/2023JB028044).
Also, software used to perform the analysis has been released via Zenodo. See news item below.
[February 26, 2024] GPS Imaging and Block Modeling codes published.
Two software packages that have been used in our published studies are now available on Zenodo.
The GPS Imaging codes perform the robust interpolations of vertical or horizontal land motion as discussed in Hammond et al., (2016), and can now be downloaded at https://doi.org/10.5281/zenodo.10672265.
The block modeling codes perform the estimates of crustal block motions and fault slip rates as constrained by GPS velocity fields. The theory is described in Hammond et al., (2011), Hammond and Thatcher, 2007 and a new paper that has been accepted at the Journal of Geophysical Research. The Matlab codes can be downloaded at https://doi.org/10.5281/zenodo.10672393.
[January 8, 2024] New Paper on Latitude!
Geoff Blewitt has published new paper on geodetic latitude, providing an improved mathematical solution on a century-old problem. The result gives a non-iterative computation of conventional geodetic coordinates (latitude, longitude, and height) from geocentric Cartesian (x, y, z) coordinates, with accuracy near 1 nm for heights. The manuscript "An improved equation of latitude and a global system of graticule distance coordinates" appears in the Journal of Geodesy.
[January 5, 2024] Geoff Blewitt's IUGG Union Lecture
On July 18, 2023 Geoff Blewitt was given the honor of delivering an invited Union Lecture to the 28th General Assembly of the International Union of Geodesy and Geophysics, in Berlin, Germany.A video recording of Geoff's lecture "Geodesy: It's About Time" is accessible on YouTube. His lecture occupies the first 31 minutes of the recording.
The annoucement and abstract for his presentation are available here.
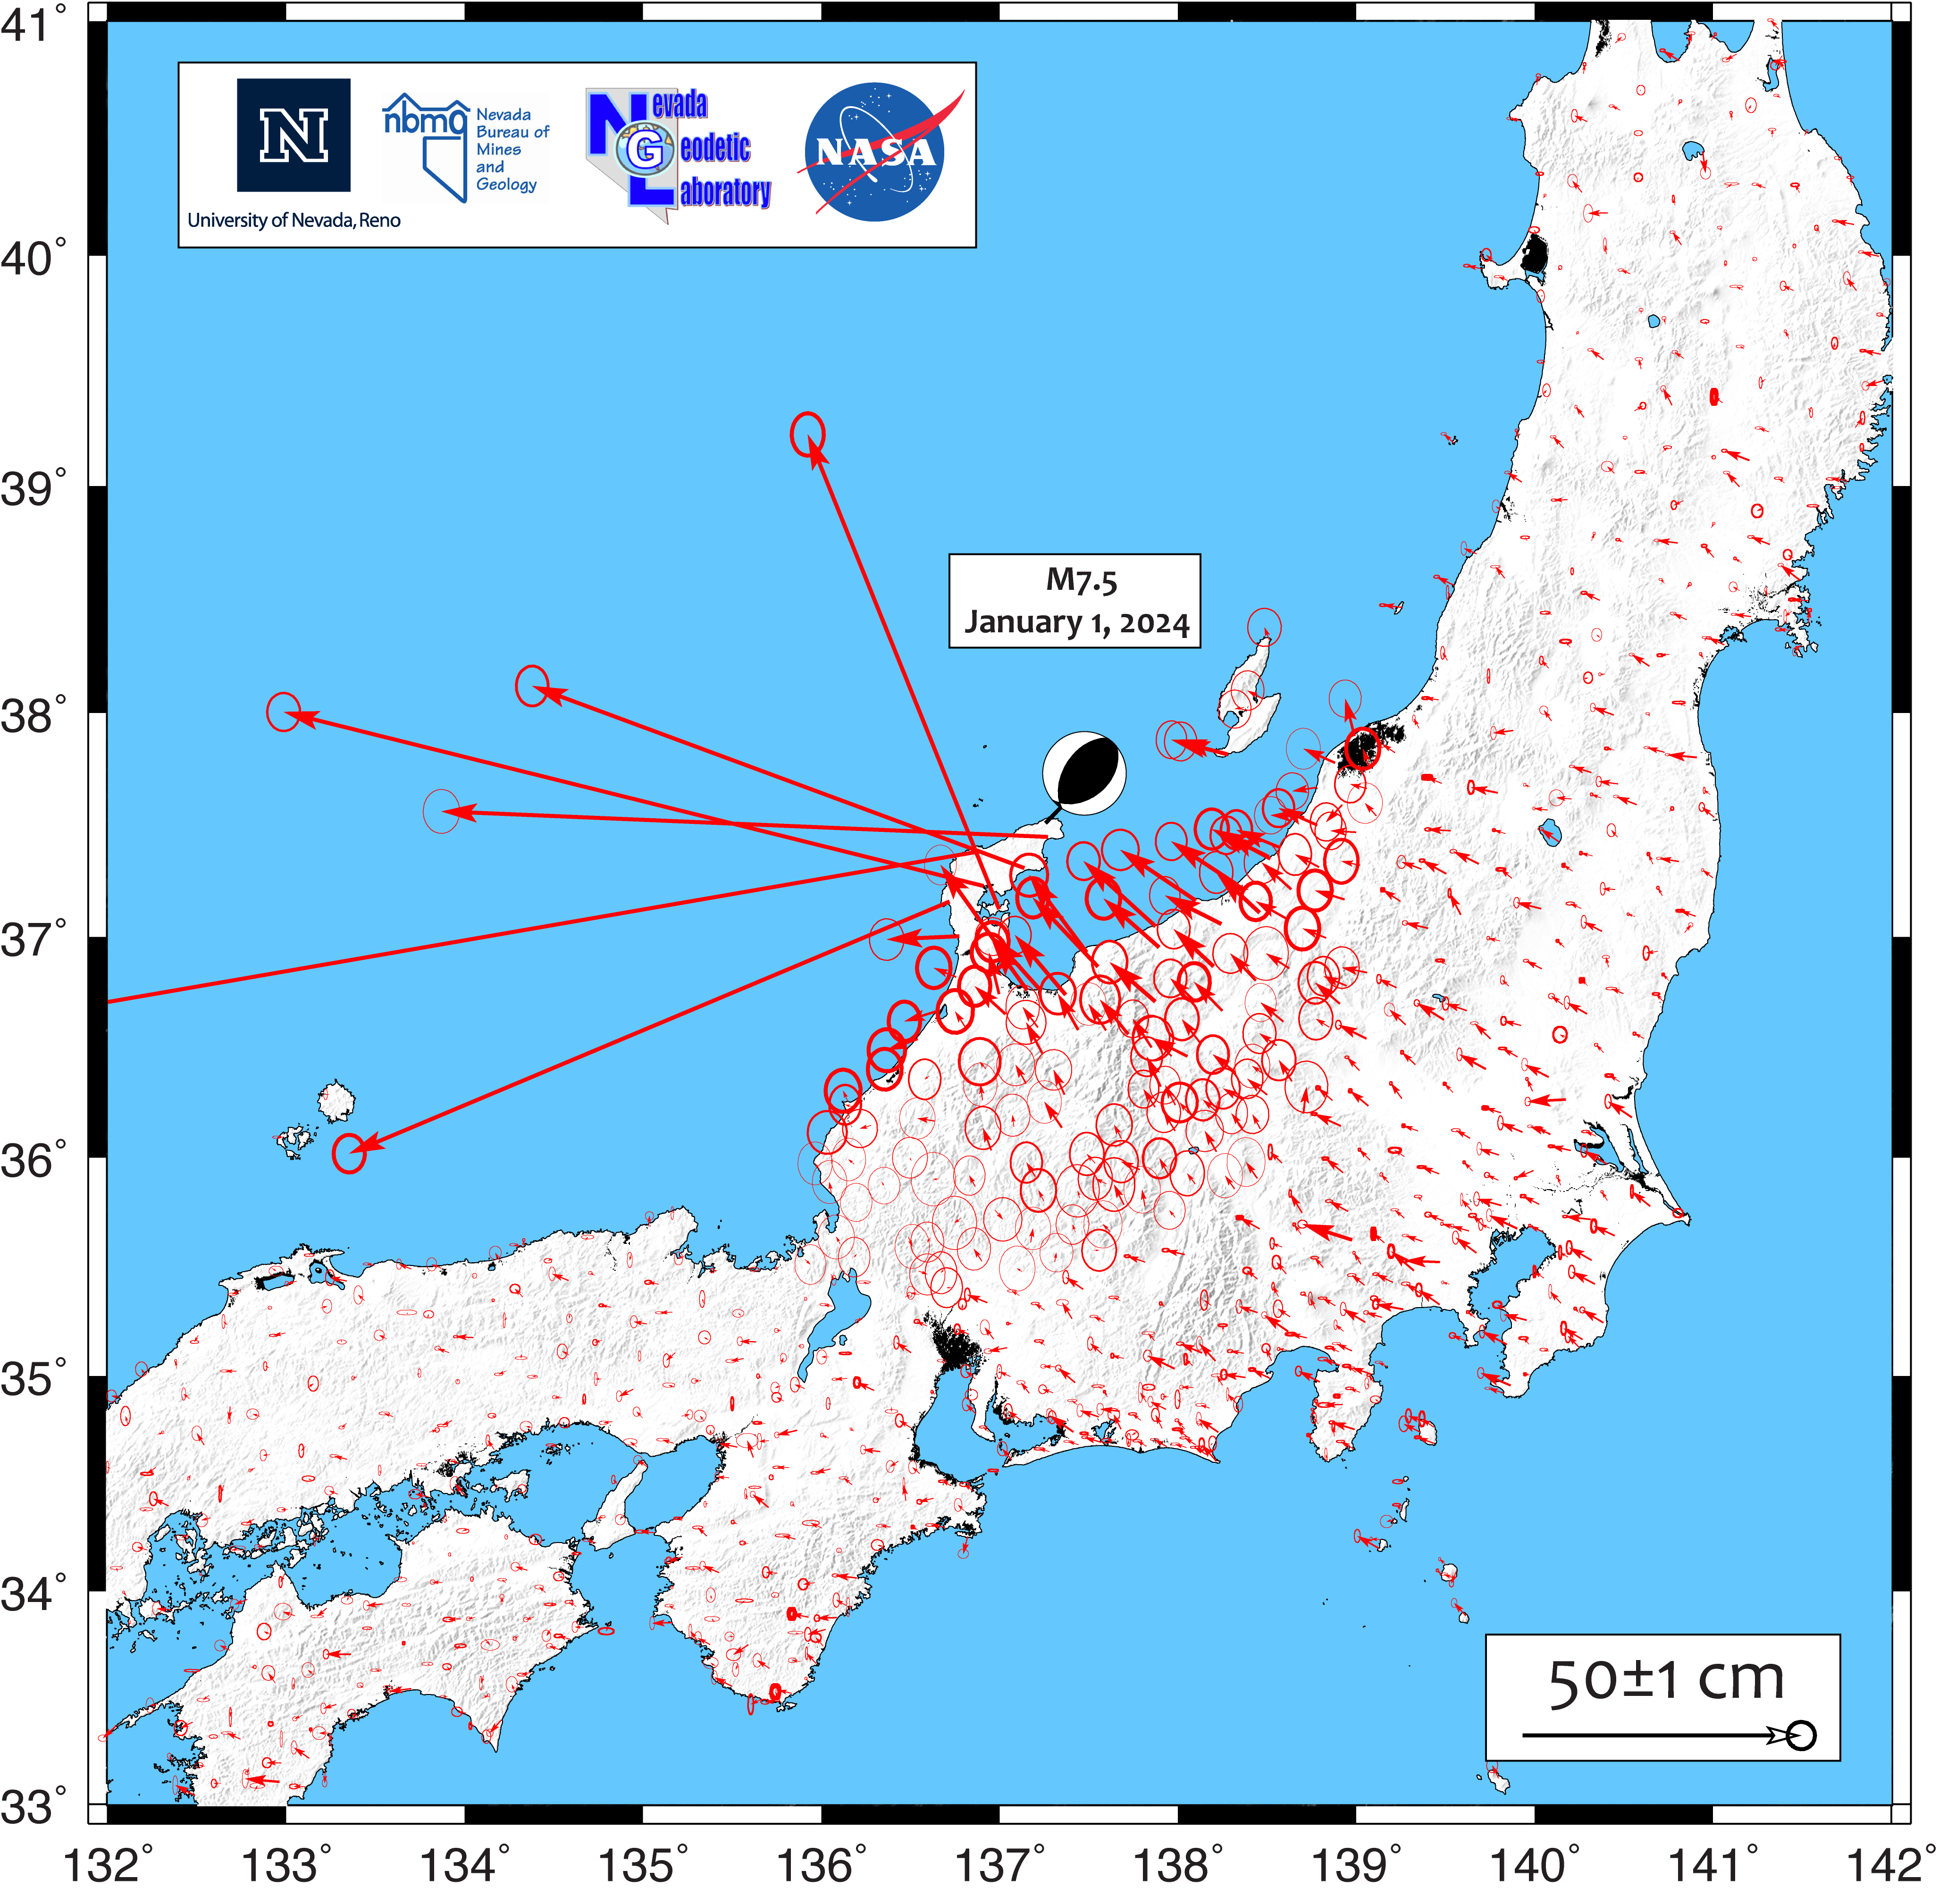
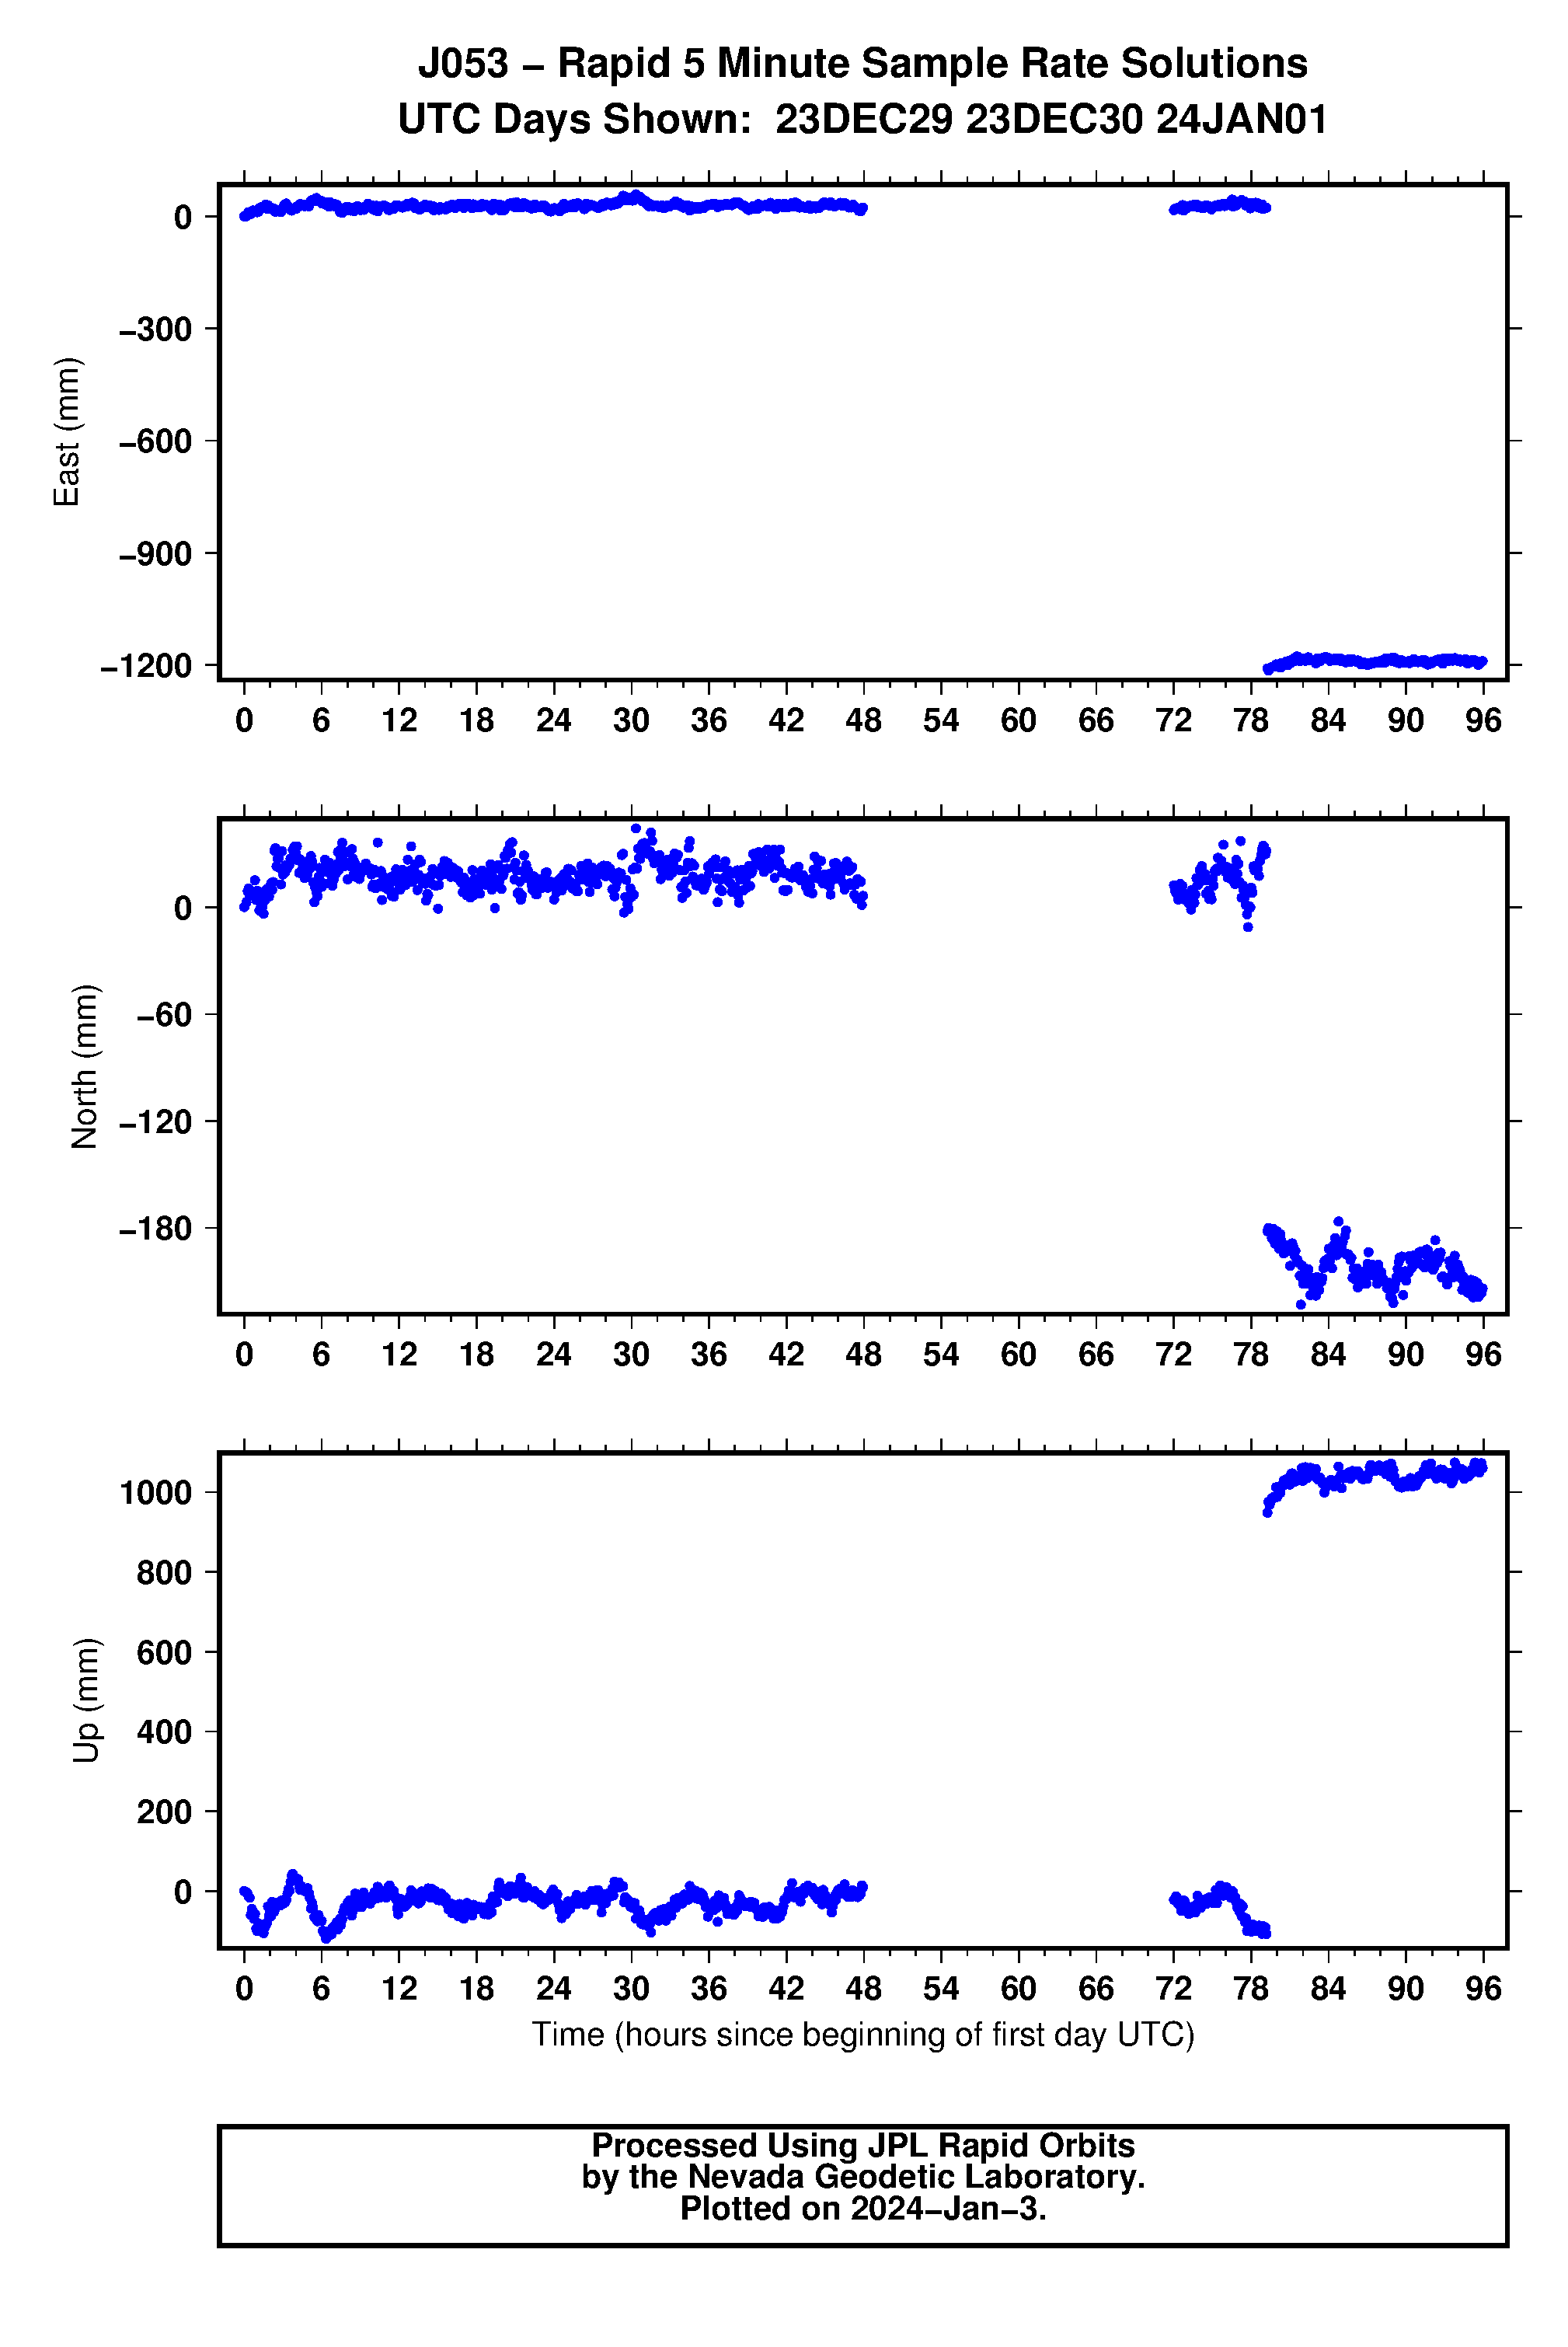
[January 4, 2024] Damaging M7.5 Earthquake hits Japan
On January 1, 2024 a shallow thrust earthquake struck the Wajima area of west Japan causing damage to buildings, fire, and loss of life. The M 7.5 event was shallow, and caused coseismic Earth surface deformation over a large section of Japan, extending all the way to the country's east coast.The Nevada Geodetic Laboratory used data from Japan's GNSS Earth Observation Network System (GEONET), processing it with JPL's GipsyX software to obtain 5 minute sample rate station position time series. We used the results to estimate coseismic displacements for over 1000 stations. The solution depicts the permanent movement of Earth's surface resulting from the earthquake. The maximum displacement was at station JO53 which moved ~1.25 m horizontally and ~1.05 m vertically upward. Signifcant displacement appears to extend all the way to the east coast of Japan (see figure below).
A file with preliminary coseismic offsets based on JPL rapid orbit is available HERE. These solutions account for the M6.2 event that occurred 8 minutes following the mainshock, meaning that only data collected between the M7.5 and M6.2 were used to constrain positions after the M7.5 for stations thought to be affected by the M6.2.
[May 26, 2023] New Data Product: Monument Characteristics Table
For about half of all GPS stations processed at NGL we have been able to extract and tabulate information about the station monuments from the IGS log files. This information includes description of the monument, its foundation construction, height, depth, and geologic enviroment when available. This information can be used to assess the factors contributing to station stability, error checking and tracking down issues in the time series, studies of noise characteristics, etc.This information is now posted in the: Monument Table.
[April, 2023] New paper published by NGL grad student Zack Young
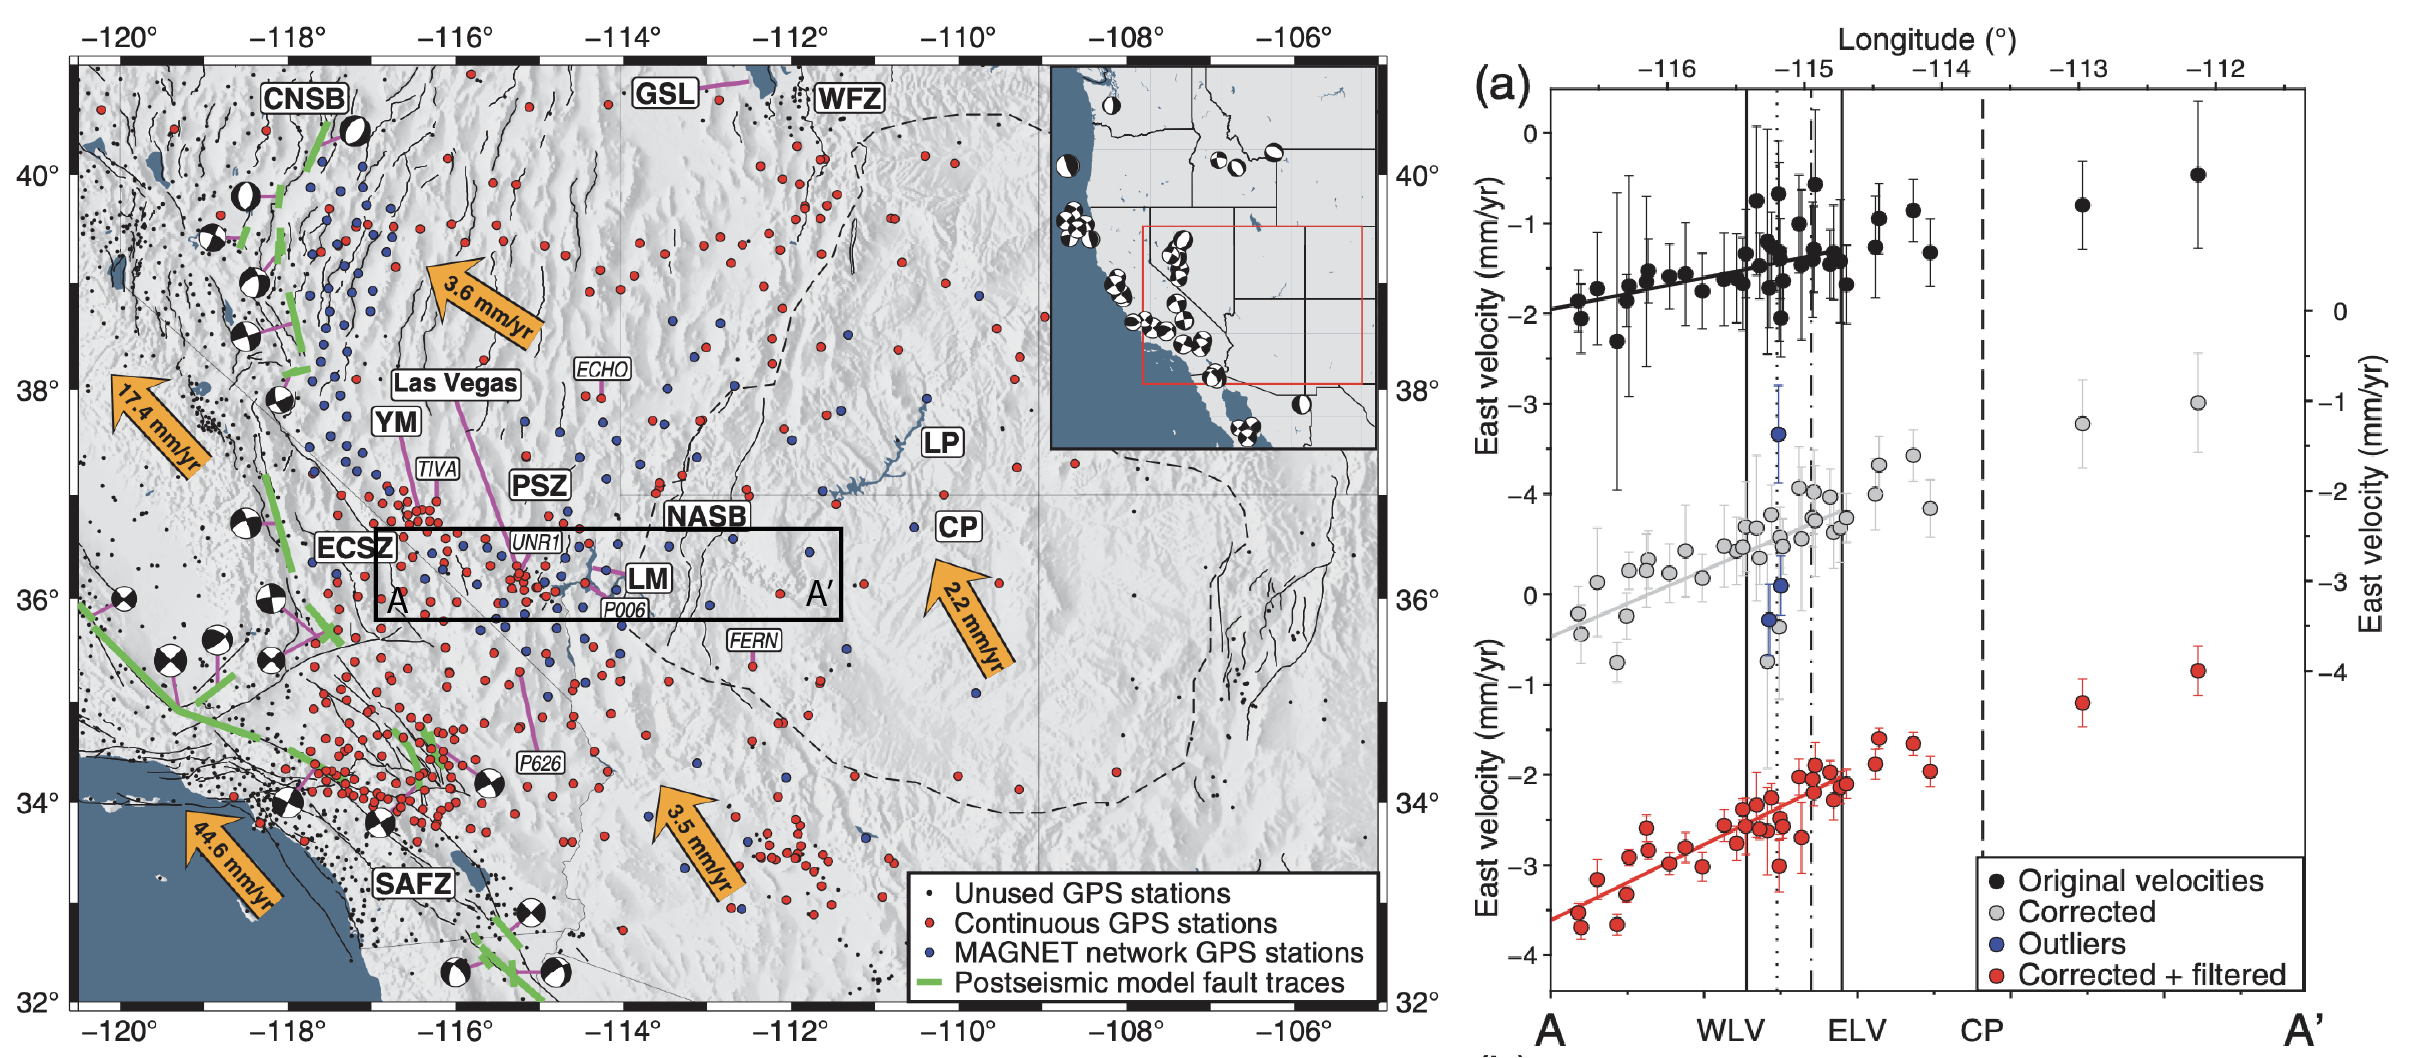
Tectonic deformation in the American Southwest is complex, exhibits a range of deformation styles driven by Pacific-North American plate boundary interactions. Young et al., 2023 use GPS data and modeling to map the patterns and rates of active crustal deformation across the central Basin and Range and Las Vegas, Nevada.He derives new and improved maps that describe the distribution of active crustal strain. These fields reveal that the active crustal extension rate across Las Vegas Valley is larger than previously reported, 0.5-0.6 mm/yr.
His models show how the postseismic relaxation response following all the recent major earthquakes substantially alters the deformation field within the central Basin and Range, emphasizing the need to understand the entire seismic cycle when using geodesy for hazard assessment.
The findings are published in the Bulletin of the Seismological Society of America:
Young, Z. M., C. Kreemer, W. C. Hammond, and G. Blewitt (2023). Interseismic Strain Accumulation between the Colorado Plateau and the Eastern California Shear Zone: Implications for the Seismic Hazard near Las Vegas, Nevada, Bull. Seismol. Soc. Am. 113, 856-876, https://doi.org/10.1785/0120220136.
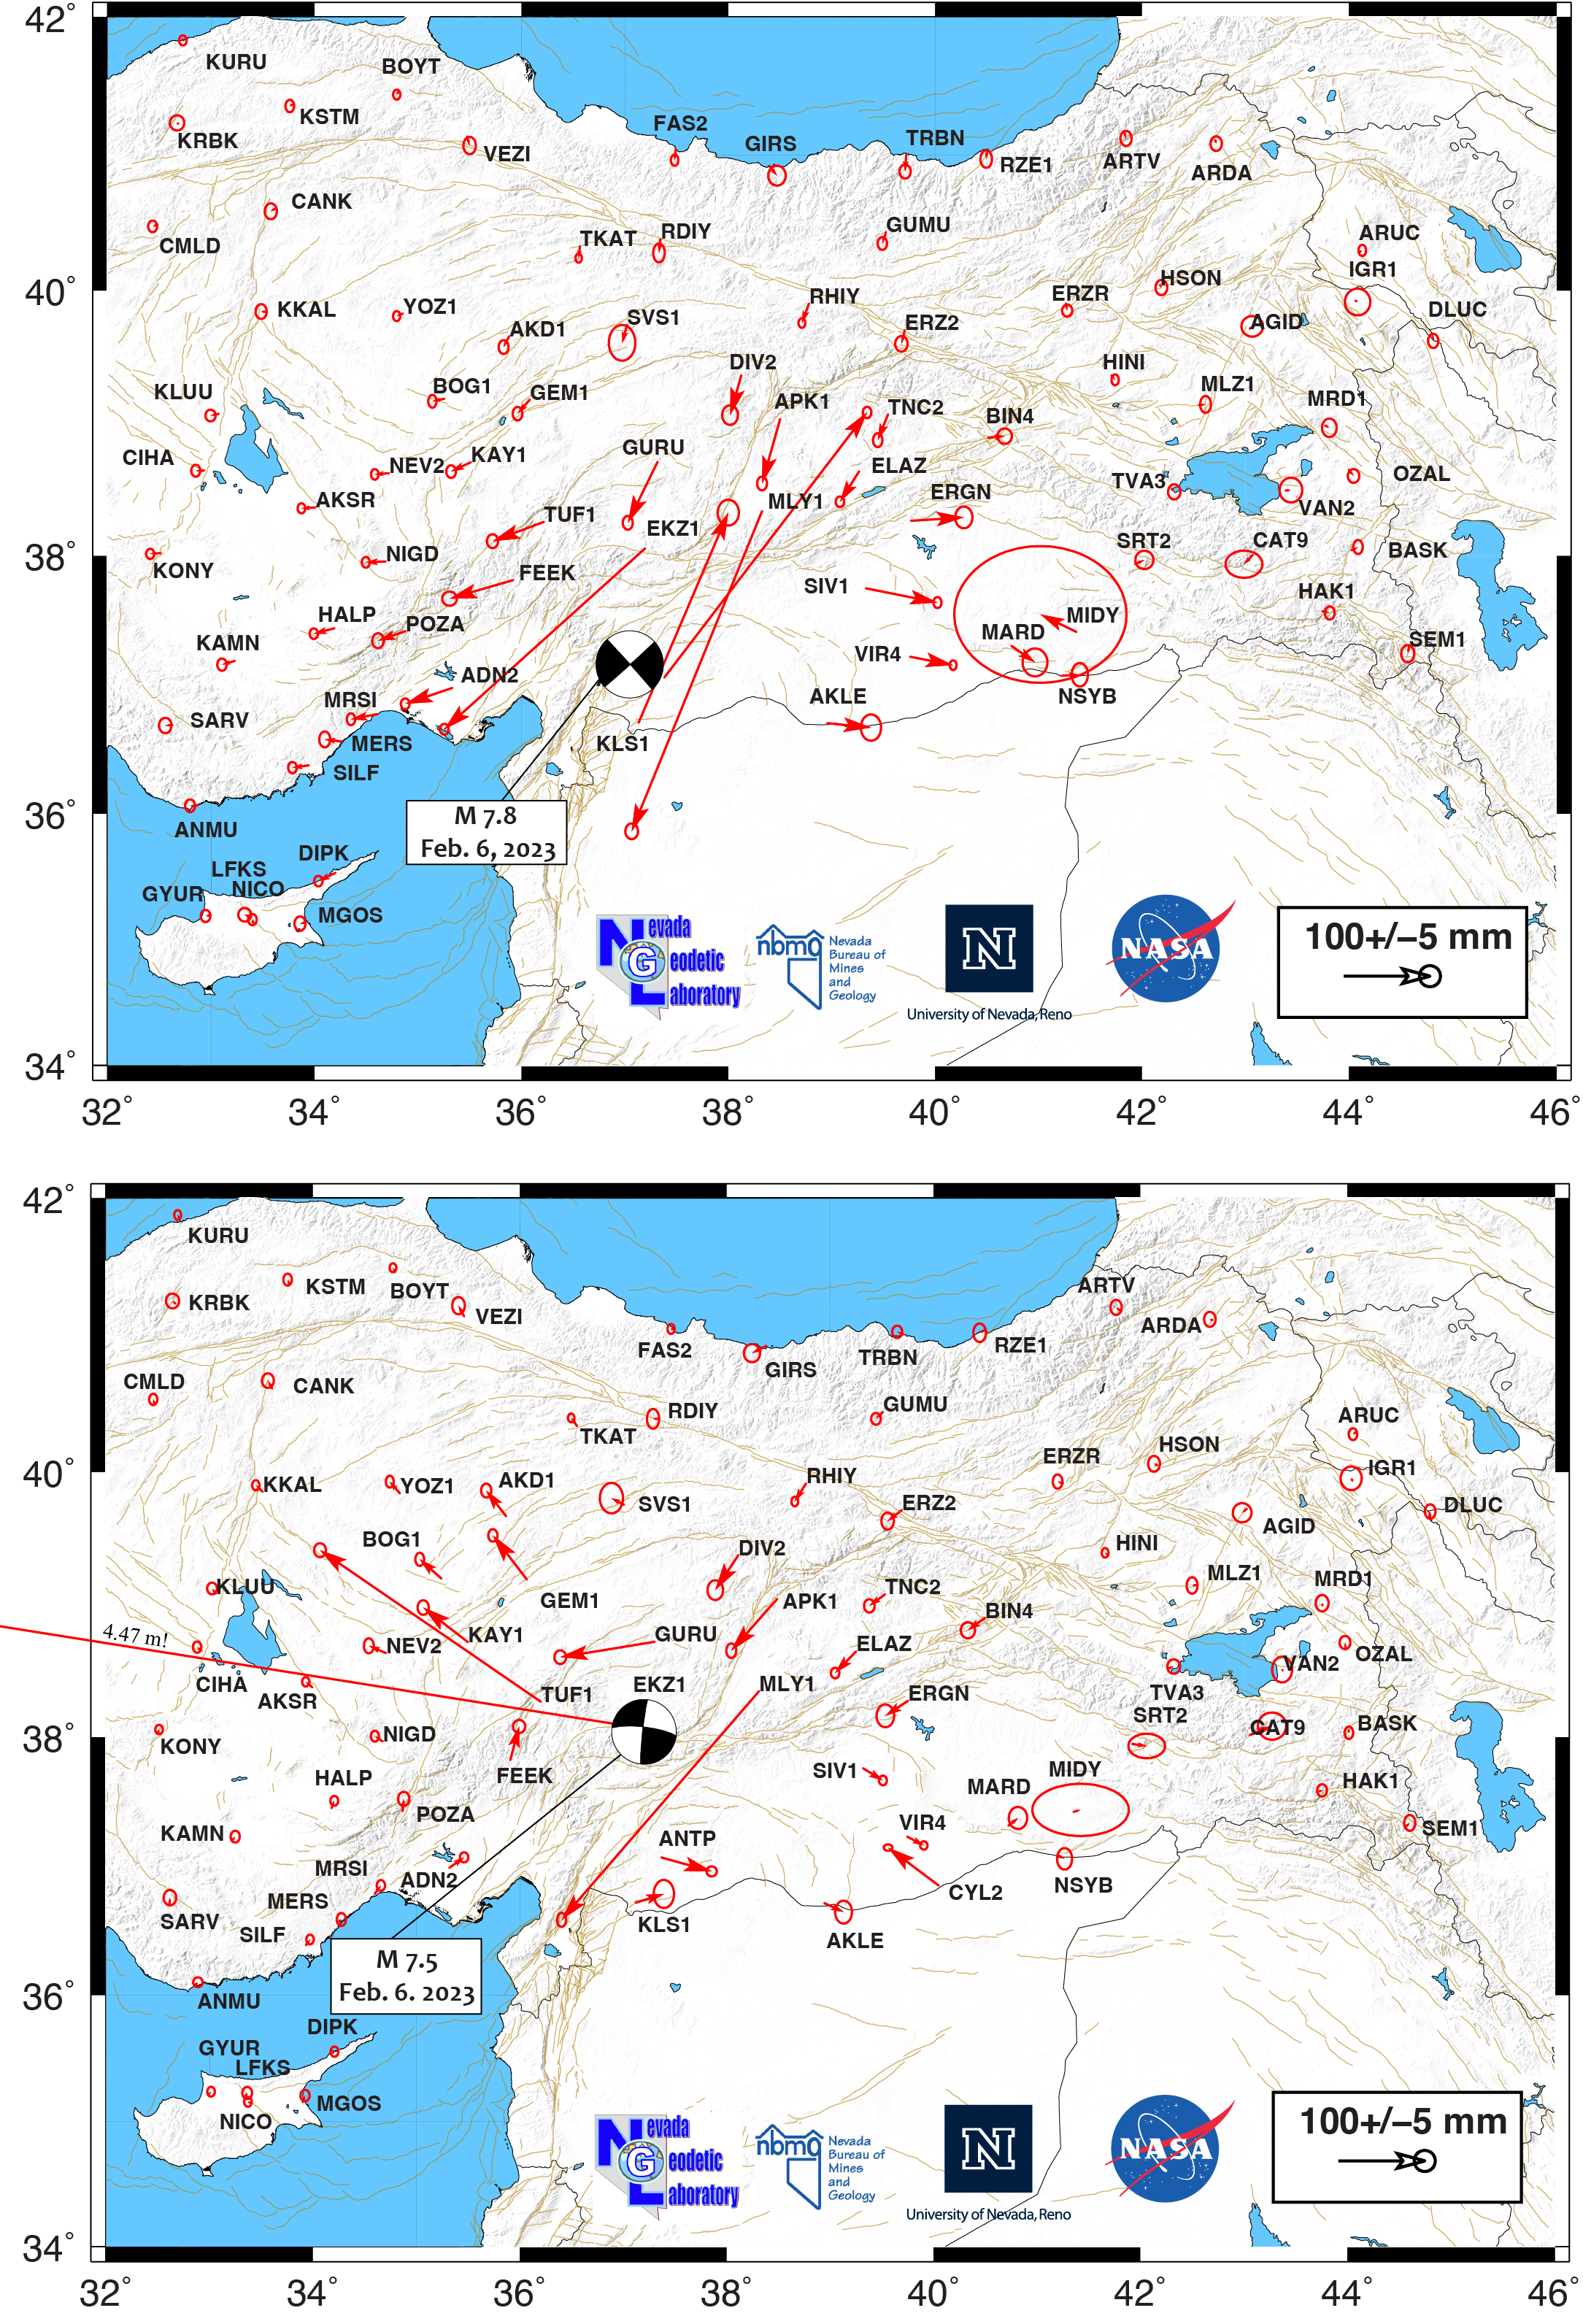
[February 13, 2023] Turkey M 7.8 and M 7.5 Earthquakes
On Feb. 6, 2023 a sequence of large earthquakes caused tragic loss of life and massive devastation in Turkey and Syria. The two largest events M 7.8 and M 7.5 moved the ground by meters near the epicenters, consistent with up to 10 meters of slip imaged by seismic techniques.Data has been obtained from some CORS network stations near the epicenters and have been processed in our system. These solutions are now available on our station web pages. We estimated preliminary coseismic displacements from 5 minute sample rate time series derived with rapid orbits from the Jet Propulsion Laboratory. Data from the days before, during, and after the event were divided into periods before, between, and after the M7 earthquakes to calculate colseismic displacments. Thanks to Prof. Ugur Sanli from Yildiz Technical University in Turkey for directing us to the CORS-Tr data in the region affected by the earthquakes.
Below are vector plots showing the deformation from each of the two largest events. In the first event station MLY1 moved over 0.3 meters. In the second event EKZ1 moved over 4.4 meters ~westward, since it was north of and very close to the epicenter. Movement in opposite direction is seen from stations on opposite sides of the earthquake moment tensors nodal planes, as expected from each of these mostly strike slip earthquakes. Magnitude of displacement tapers with distance.
Files with preliminary coseismic offset measurements are available for the M7.8 (us6000jllz) and M7.5 (us6000jlqa).
Author's note: On Feb. 26. 2023 the figure and offset files were again updated to reflect results obtained with JPL final orbits and additional data that has since been obtained.
[February 10, 2023] New Paper! A Global Integrated Water Vapor Dataset
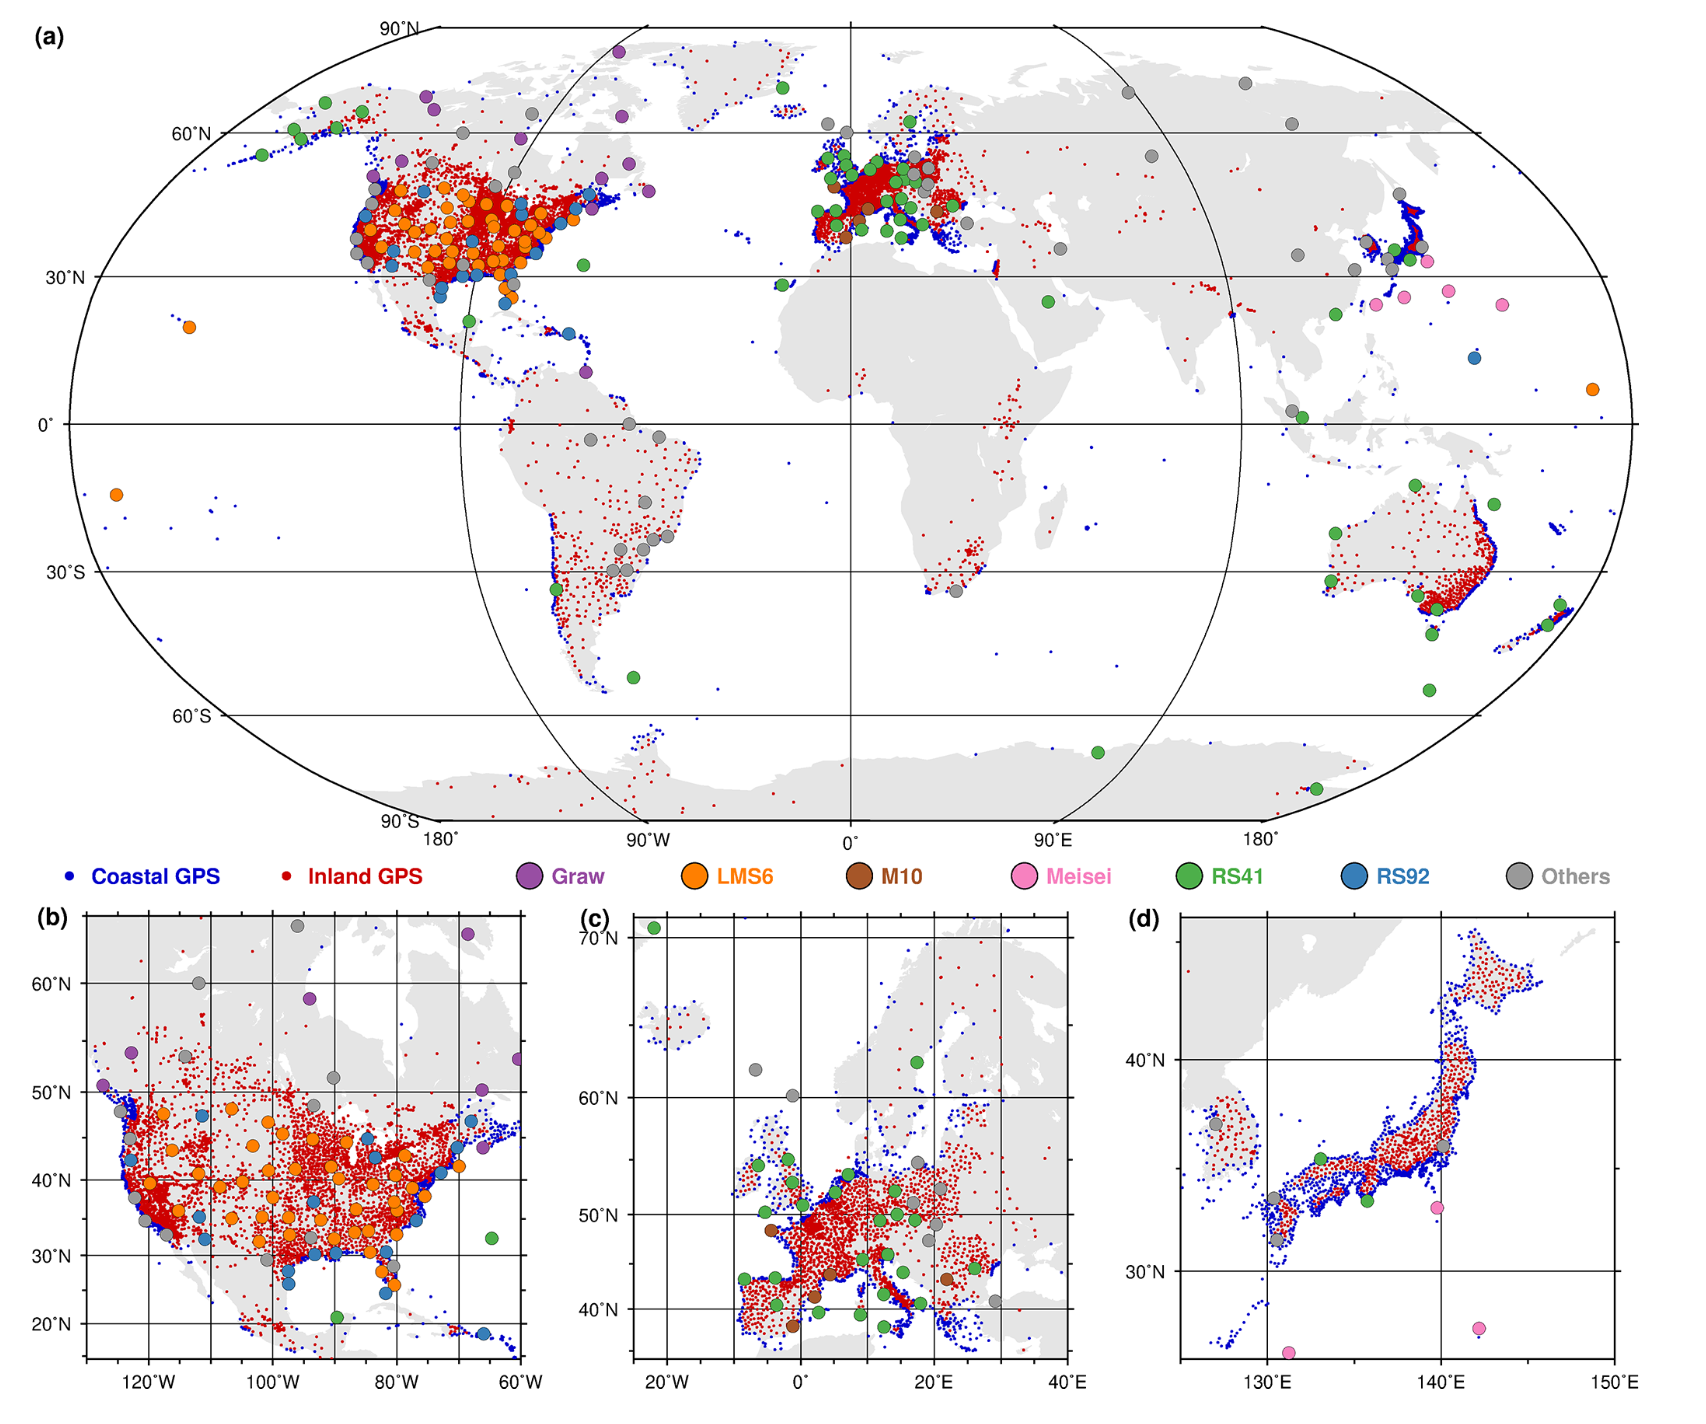
Water vapor plays a significant role in various Earth system processes. As the medium of moisture and latent heat in the atmosphere, water vapor affects many meteorological, climatological, and hydrological phenomena in a range of spatial and temporal scales, including extreme weather. A new paper, published today in Earth System Science Data, describes development of a new 5 minute global integrated water vapor (IWV) product from 12552 GPS stations in 2020. It contains more than 1 billion IWV estimates which are used to develop an enhanced version of the existing operational GPS IWV dataset from the Nevada Geodetic Laboratory. This enhancement is reached by using accurate meteorological information from ERA5 for the GPS IWV retrieval with a significantly higher spatiotemporal resolution, and will provide more accurate IWV estimates. This product is valuable for many applications, such as analysis of extreme weather and diurnal variations of water vapor in the atmosphere.
The paper, is available at this link: Yuan, P., et al,, 2023, An enhanced integrated water vapour dataset from more than 10,000 global ground-based GPS stations in 2020, Earth System Science Data, 15, 723-743, https://doi.org/10.5194/essd-15-723-2023.
The dataset with 5-minute integrated water vapor from 12,552 GPS stations worldwide in 2020 is available for download at: https://zenodo.org/record/6973528.
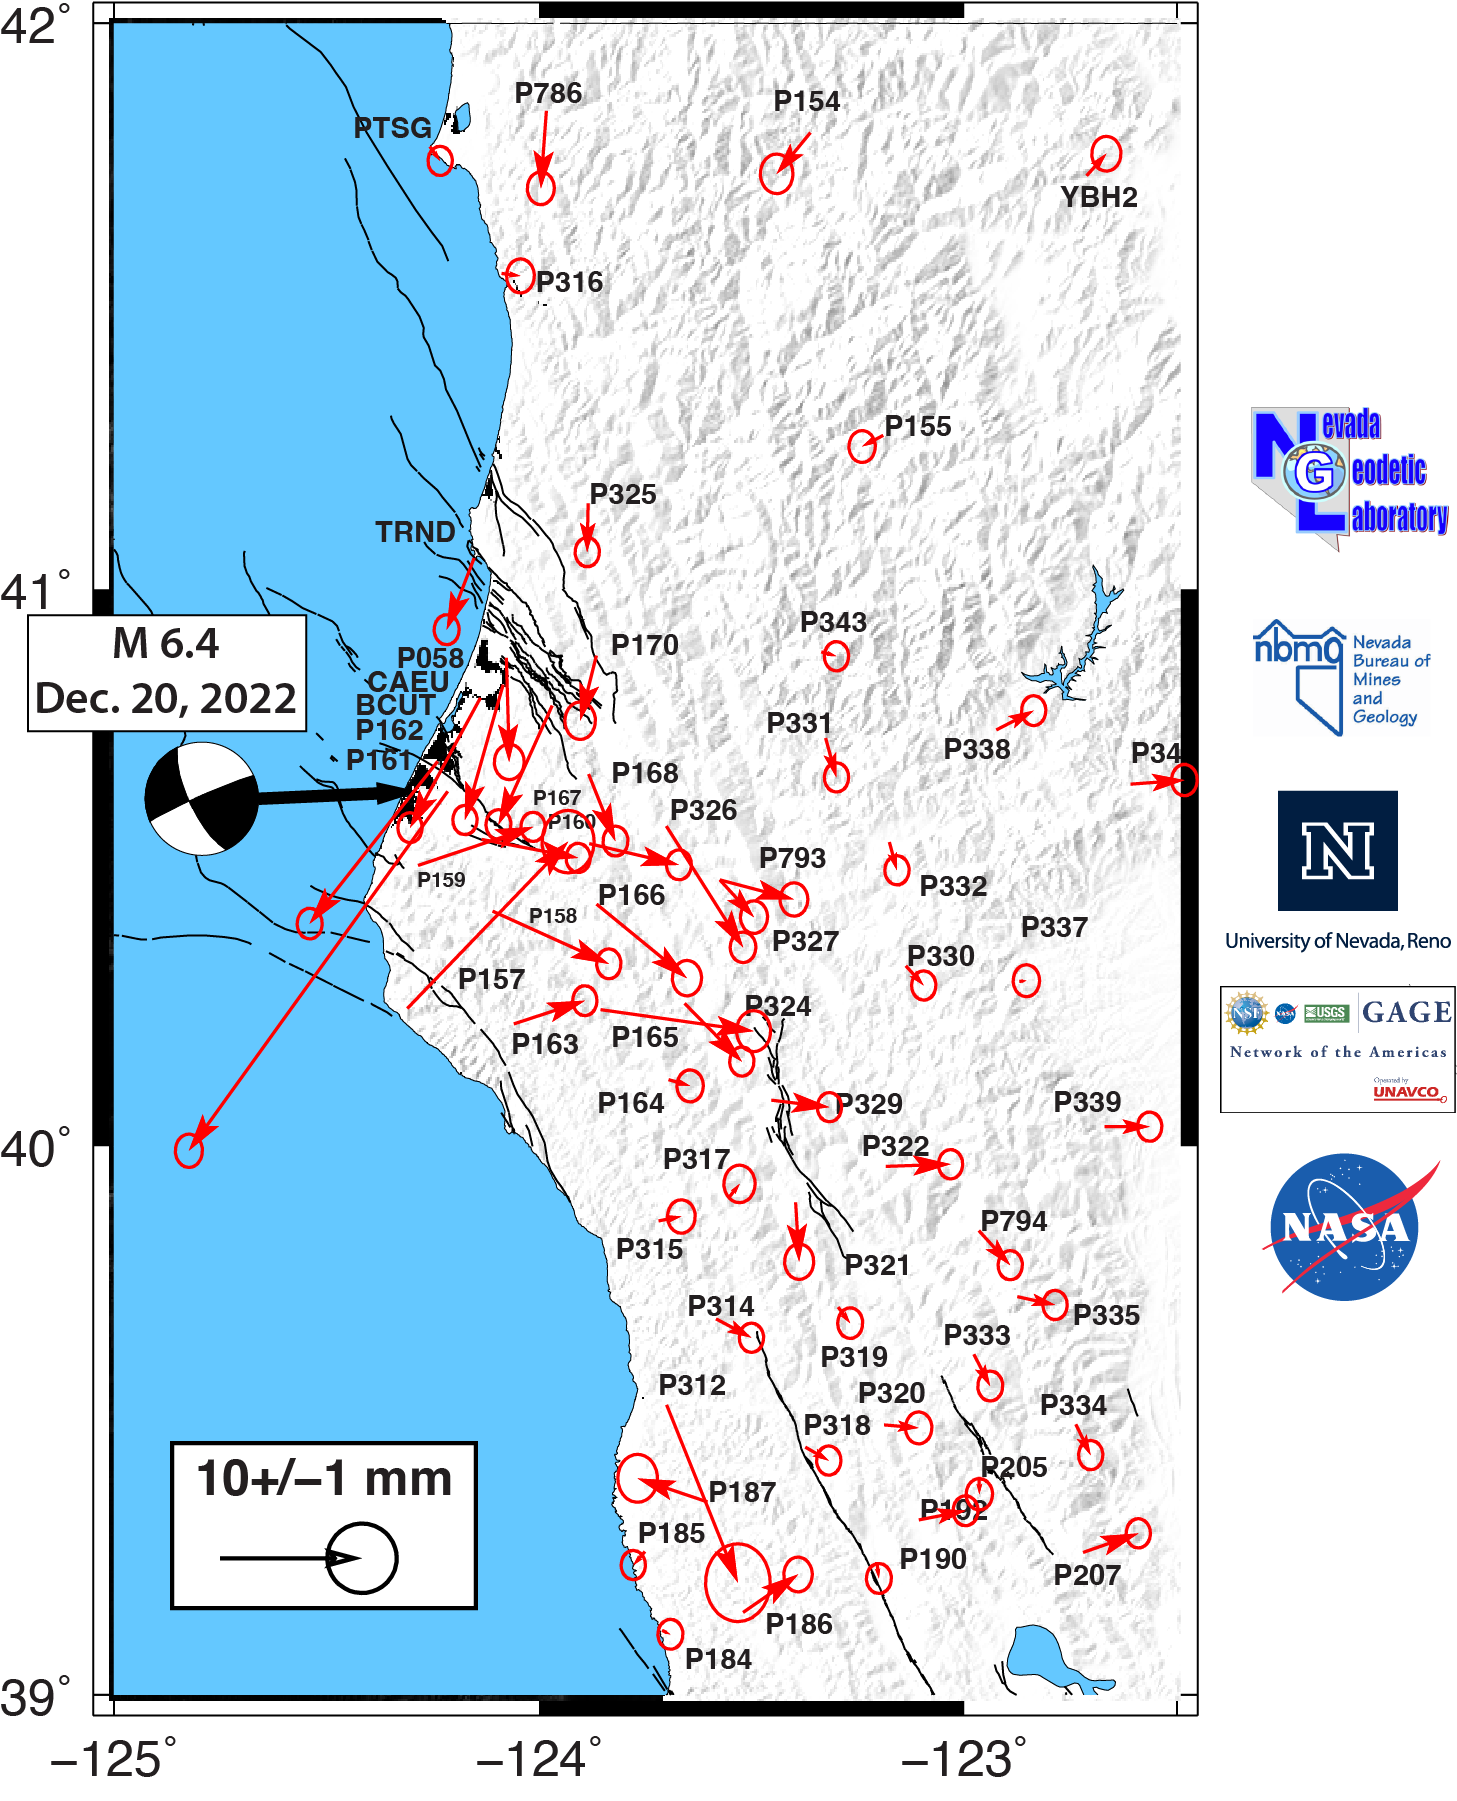
[December 22, 2022] M6.4 Damaging Earthquake in Ferndale, Califoria
A damaging earthquake occurred yesterday on the northern California coast near Ferndale. The M6.4 event resulted in fatalities and significant damage to structures in the area. See the Temblor story for more discussion of the impacts and tectonic context of this earthquake.We have estimated preliminary coseismic displacents at GPS stations in the area using 5 minute time series that were obtained using rapid orbits from the Jet Propulsion laboratory. The maximum measured displacement of ~31 mm occurred at EarthScope Network of the Americas (NOTA) station P161. The pattern of displacements from all the stations matches the pattern expected from the extensional and contractional quadrants of the the event's moment tensor.
These displacements were updated on Dec. 22 and are based on about one and a half days of data collected in NOTA after the event that have been processed at NGL. The uncertainties will continue to decrease as more data are collected and final orbits become available. A preliminary table of displacements based on the rapid orbits is available at this link.
The results shown here are based largely on data provided by the GAGE Facility, operated by UNAVCO, Inc., with support from the NSF, the NASA, and the USGS under NSF Cooperative Agreement EAR-1724794.
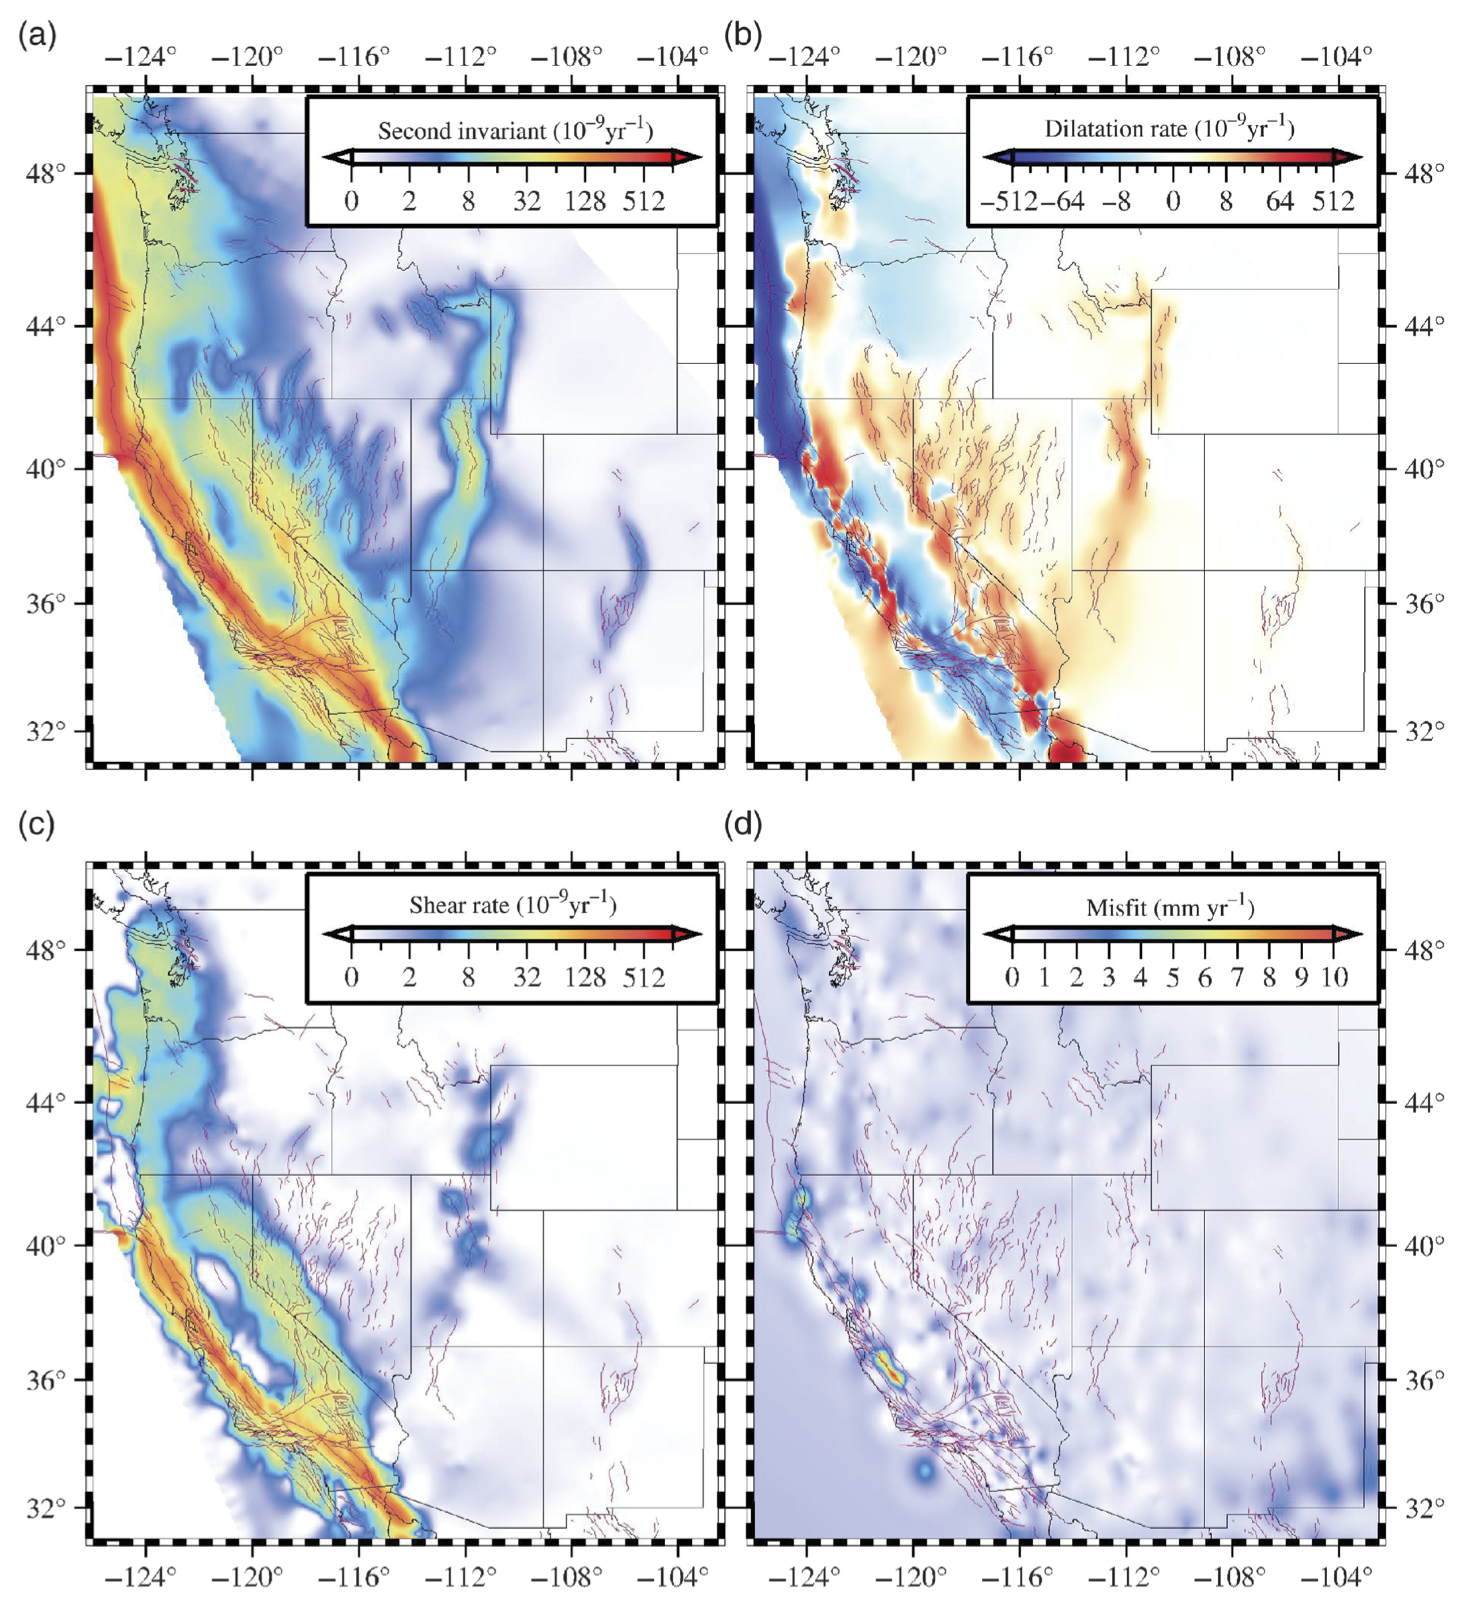
[August 3, 2022] New Western US Strain Rate Map
Kreemer and Young present a new suite of strain rate models for the western United States based on geologic and geodetic data.Published in Seismological Research Letters, they present the very interesting finding that slow and fast deforming areas of the continent exhibit a different relationship between seismicity and strain rates. Seismicity rates increase relatively slowly with strain rate in faster deforming areas.
[July 26, 2022] System Outage Planned for Thursday Morning July 28, 2022
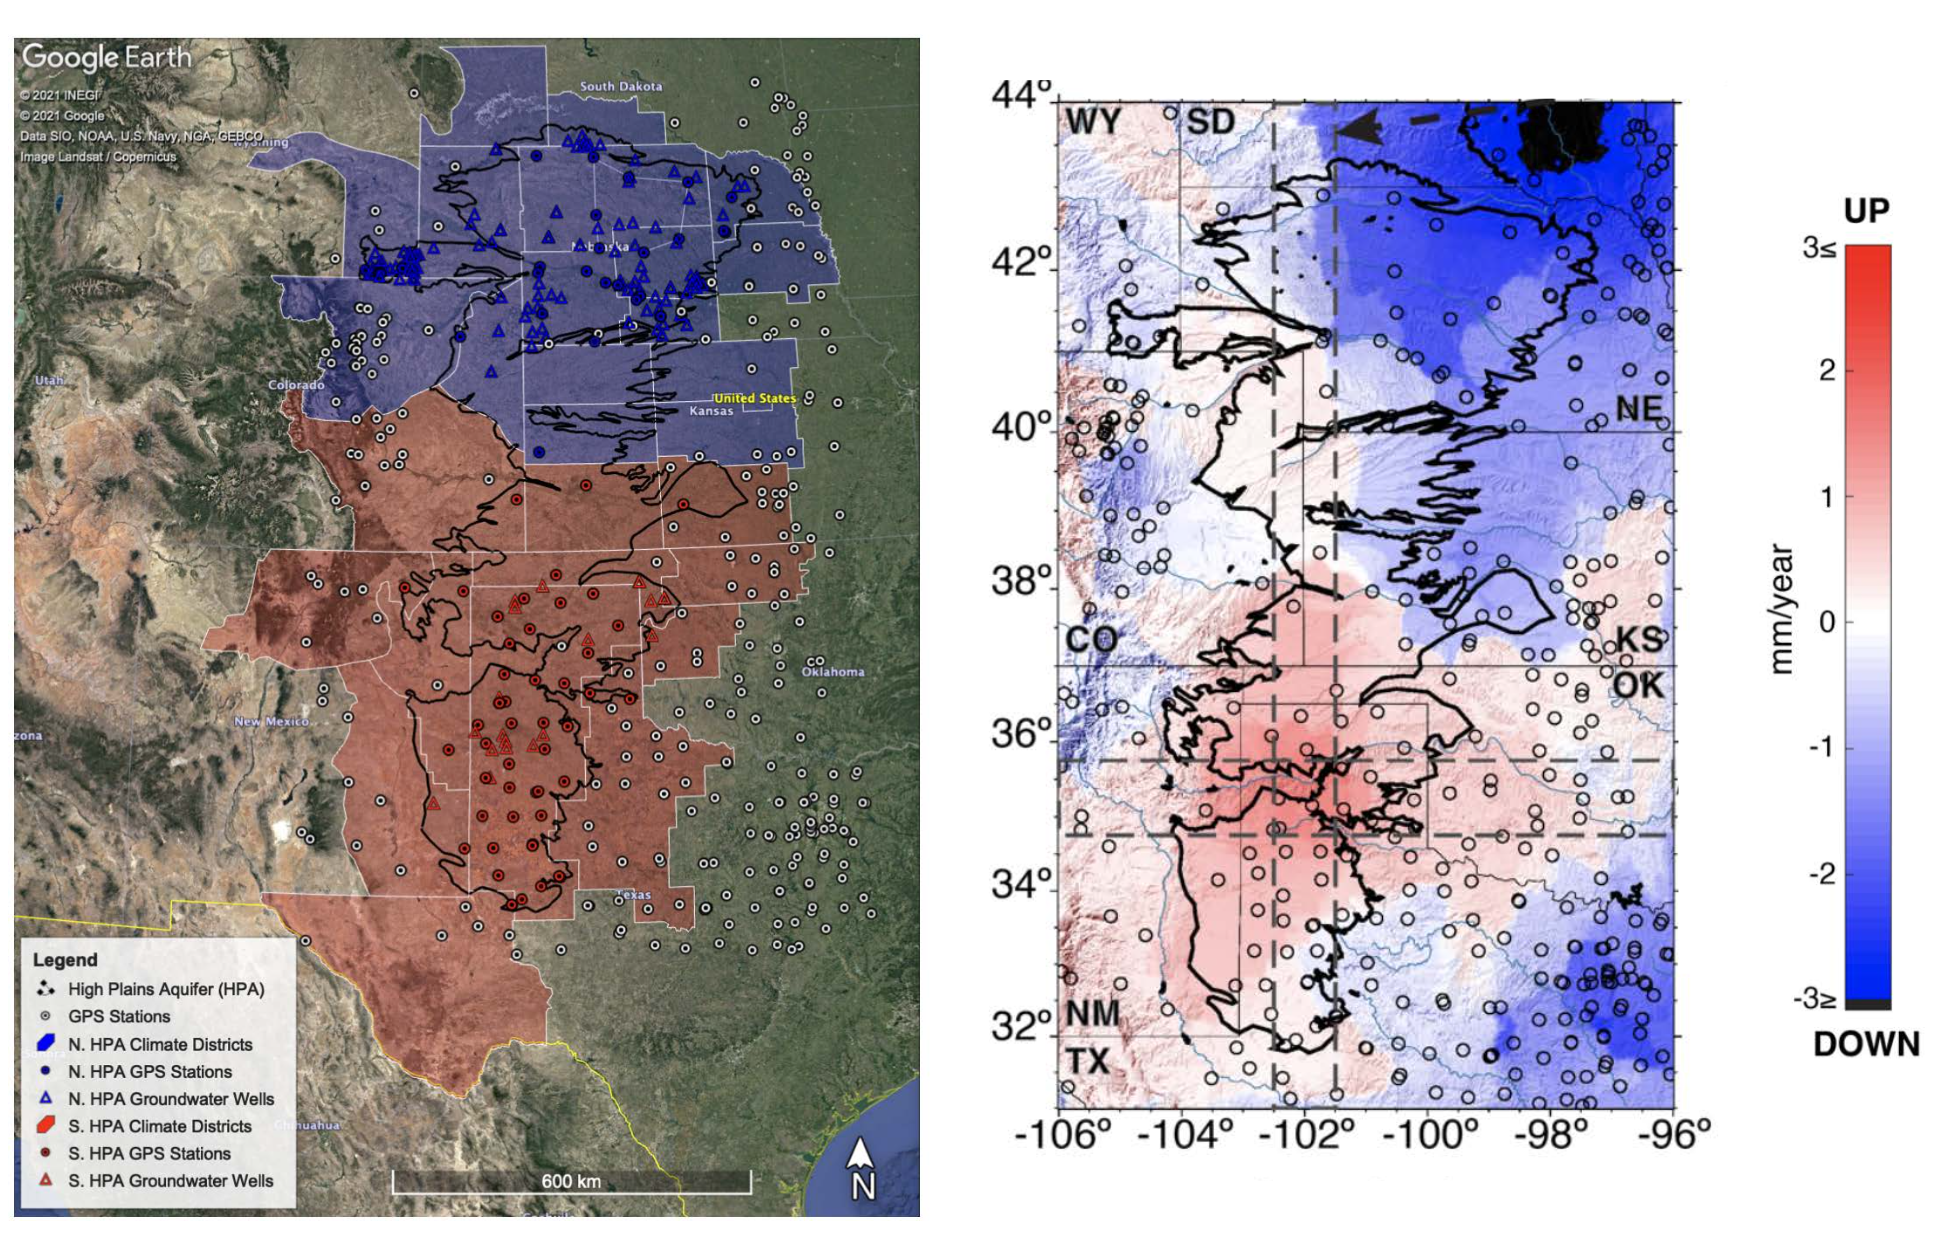
Please note that our web pages will be down this coming Thursday morning for a planned system upgrade. NGL data products will be not available until we complete the upgrade. Thanks for your patience.[June 15, 2022] New Paper: Uplift of the High Plains Aquifer
Just published this week in the AGU Journal Water Resources Research: Overacker et al., (2022) use GPS data to show that the High Plains Aquifer in the central United States is undergoing active uplift that is accellerated by drought.The High Plains Aquifer, also known as the Ogalalla aquifer, is the largest grounwater system in the United States. We image an uplift anomaly of ~1 mm/yr that is focused near the southern portion of the system and is associated with water withdrawal. The aquifer is unconfined, so water loss results in load reduction uplift, not compaction-driven subisence as is commonly observed in other systems such as the California Central Valley. The difference in physical mechanism responsible for vertical land motion revereses the sign of active uplift associated with groundwater loss, and highlights the utility of integrating climate, geodesy, hydrology and geology when studying large groundwater systems.
[June 1, 2022] We Are Back Online.
WE'RE BACK! University power issues triggered failure of our web server on May 21. Our web pages and online data products are now restored and back online.
Please note that time series text files and MIDAS velocity solutions will be up to date as usual, but time series plots on the station pages will be static until we repair the failed server. Sorry for the inconvenience. Thanks for your patience, Folks!
[May 19, 2022] Important System Note: File Format Change for .tenv3 and .vel
Please note that because of user demand and better internal consistency we have enhanced the format of the time series text files (with suffix .tenv3) and midas velocity text files (suffix .vel) to include three additional columns added to the right side of the file. These columns contain the latitude, longitude (in degrees) and height (in meters) of the station. In the case of the .tenv3 files these values change in a way consistent with the changes in daily position, in all three coordinates.
Apologies if this change disrupts workflows that use these files. However, the presence of the additional information should add simplicity in many applications that use them.
[October 25, 2021] Out Today: Spotlight on Global Vertical Land Motion
See the Research Spotlight in Eos on our new paper (Hammond et al., 2021) that describes using GPS to measure vertical land motion around the world.The analysis uses data from over 19,000 locations to estimate the rates, patterns, budgets and sources of the vertical movement of the land surface that is driven by various processes in the Earth such as plate tectonics, glacial isostatic adjustment, the earthquake cycle, changes in aquifers and hydrological loads.
The methodology is used to generate new continually updated vertical land motion data product based on our GPS data holdings and processing system which can be used to improve understanding of the driving factors behind sea level rise in coastal areas.
The article was also featured on the cover JGR for volume 127, issue #7, and was selected by the editors to appear in a special collection of papers identified as pivotal research on the climate crisis published in AGU journals.

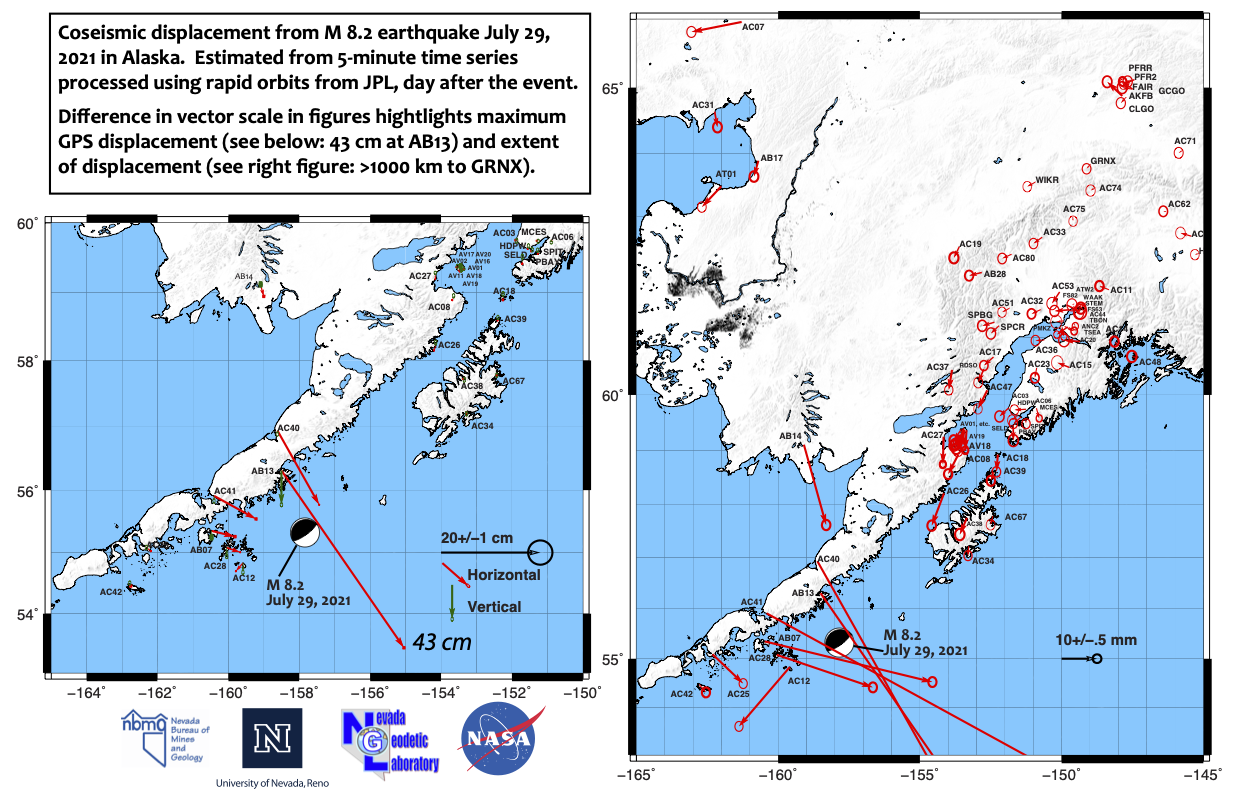
[July 30, 2021] M 8.2 earthquake in Alaska!
About 35 hours ago (July 29 UTC) a very large earthquake struck the Aleutian Penninsula along the convergent plate boundary between the Pacific and North America plate. At M 8.2 it is the largest in Alaska in over 50 years. This thrust earthquake occurred near the location of a similar, but smaller (M 7.8) event last year (see entry below for July 23, 2020).We accessed data from NSF's Network of the Americas operated by UNAVCO, and other networks in Alaska, and computed position time series, with JPL's Gipsy software and rapid orbits. Using 5 minute positions we estimated a preliminary set of coseismic offsets which are shown in the figure below and provided as a text file.
The largest GPS-measured displacement was ~43 cm, occuring at station AB13, which also subsided vertically by ~7 cm. A coherent displacement pattern extends far to the northeast, past Anchorage (~800 km from epicenter) and possibly as far north as Denali National Park (>900 km). For scale... this would be like an earthquake in California moving the state of Utah by several mm!
Text file with preliminary coseismic displacements.
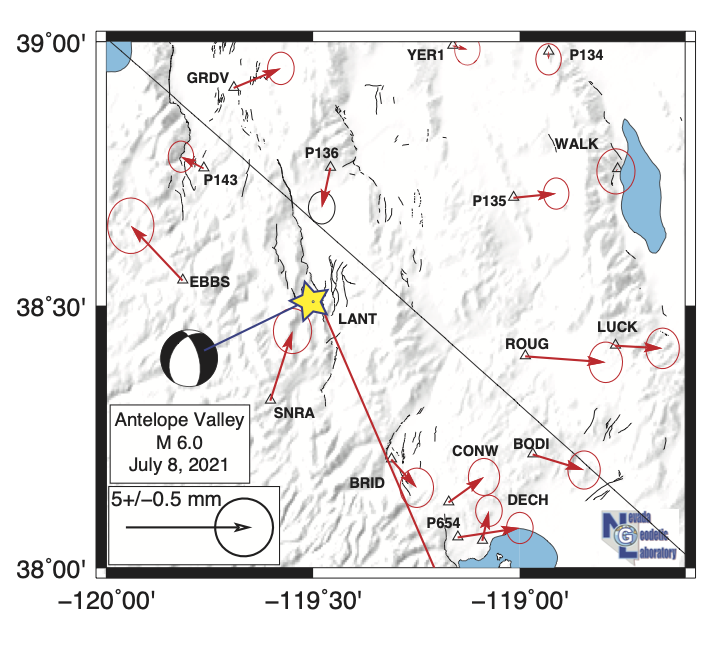
[July 22, 2021] Update on Antelope Valley Earthquake response: Complicated by wildfire!
Below is the latest map of offsets that include new data collected after the earthquake. These are based on more data, 24 hour rapid solutions, and are more precise that those from 5 minute time series shown previously. The large southward displacement of LANT remains, however its aziumth now seems more south-southwest. Stations for which we will eventually have offsets are labelled in blue, many of these now have receviers at them recording data. However, access to stations west of the epicenter is almost totally shut down because of the Tamarack fire which is at this time only 4% contained.Click here for preliminary text file of the offsets. The uncertainties for offsets at stations BFLT, TOPA, RISU and SEE are larger than the others because they had not been surved as recently prior to the earthquake. These uncertainties will be reduced with further surveying.
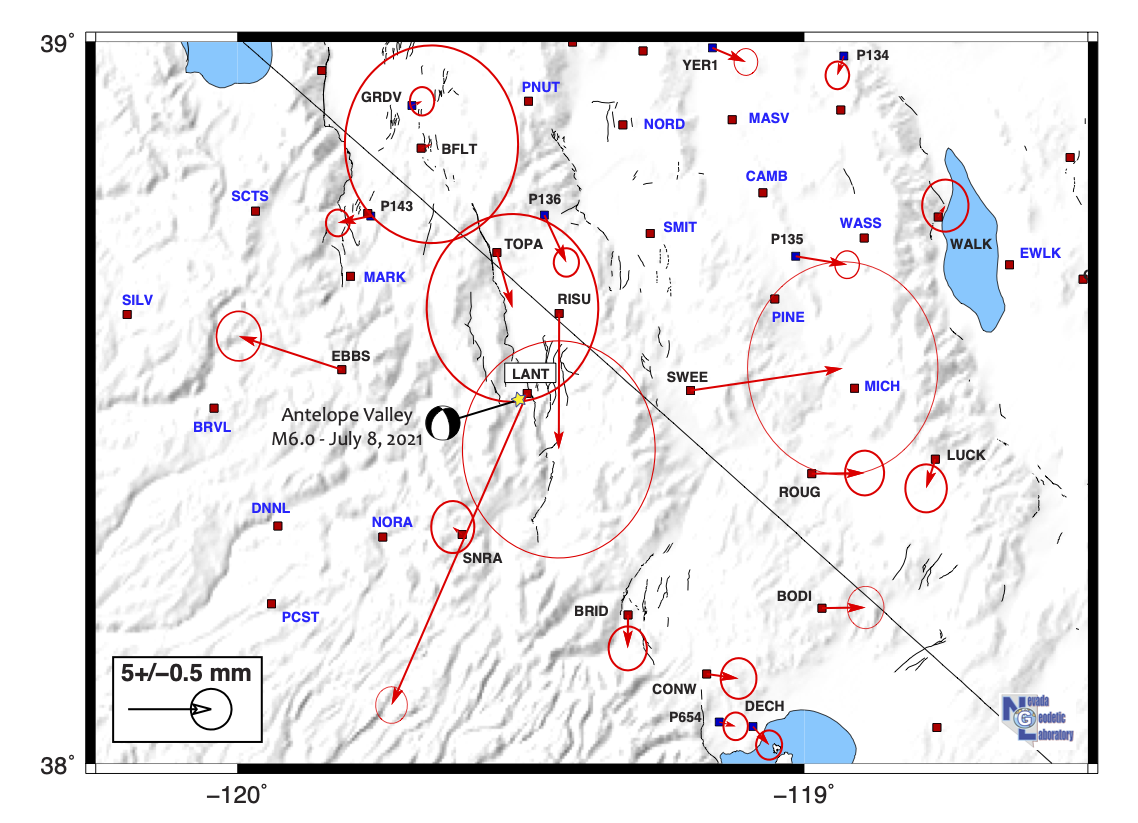
[July 16, 2021] Highlights from the Field: the M6.0 Antelope Valley Earthquake
Here is a quick update on the MAGNET GPS deployment for the Antelope Valley earthquake. We were in the field for several days and retrieved data from stations WALK, EWLK, GILL, INDI, CALA, ARMY, FLAT, LUCK, ROUG, BODY, CONW, BRID, LANT, SNRA, EBBS. Those data were processed yesterday and we obtained post-event positions for most of them. We also moved receivers into stations NORA, DNNL, PCST, BRVL, SILV, MARK, SCTS, KINS, which will give us displacements on the west side of the event. We will let those stations collect data for at least a week before returning get data from them. If more earthquakes occur in the near future there is a nice network in place to record it.The figure below is preliminary and has the scale expanded to emphasize the small signals in the medium-field (within ~50km) from the epicenter. Note the scale bar indicates size of 5 mm displacement. The vector for LANT goes off the page at this scale. These offsets are computed from 5 minute time series processed at NGL which are available at our station pages.
The vectors show P136 and SNRA moving toward epicenter, EBBS, P143, P135, ROUG, LUCK, BODI, BRID moving away from epicenter, and other stations further from the epicenter showing noise or zero offsets (e.g. WALK, DECH, etc.). These offsets show ~east-west extension and ~north-south contraction. look more or less as expected from a normal faulting earthquake. However there could also be an dextral component to the slip which will require detailed modeling to explore completely.
Data from the NSF Network of the Americas at stations P143, P136, P134, P654 operated by UNAVCO are also used in the analysis.
There are some pictures from the deployement... see Bill's site with pictures and video.
[July 11, 2021] - NGL Responds to the M6.0 Earthquake in Antelope Valley
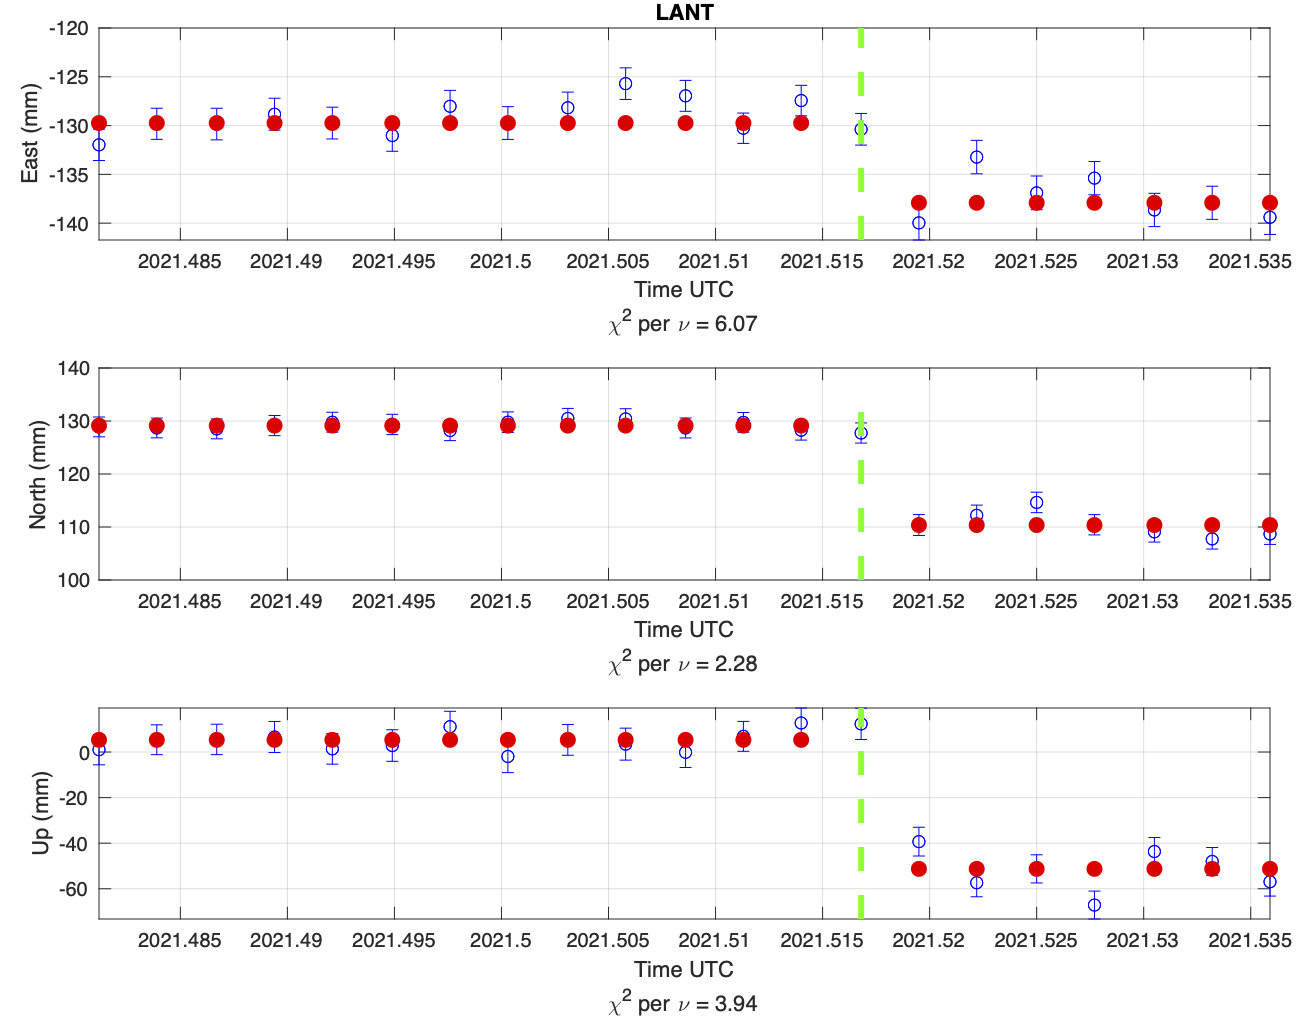
We now have some data from the MAGNET GPS stations that were running during the this event. On the 9th we retrieved data from LANT and ROUG and installed more receivers at other nearby stations. Data retrieved have been processed and we are seeing offsets consistent with the InSAR from gCent posted on twitter.LANT is located at about the middle of the gCent interferogram. With 5 minute GPS solutions we got enough data between July 8 22:49:48 and midnight UTC to get a ~10 cm subsidence at LANT, with just a little over an hour's data, roughly consistent with the interferogram, and with normal slip on the plane directly beneath the station.
LANT also moved ~4 cm horizontally to the SSE (see plot below), consistent with it being located on the hanging wall of an east dipping fault (Slinkard Valley Fault or Antelope Valley fault) that slipped in a right-normal oblique motion. This could help resolve some uncertainty in the mechanism if it holds up as we collect more data.
We will be continuing to move receivers into stations near the event, and collecting more data from stations that were running over the next several days.
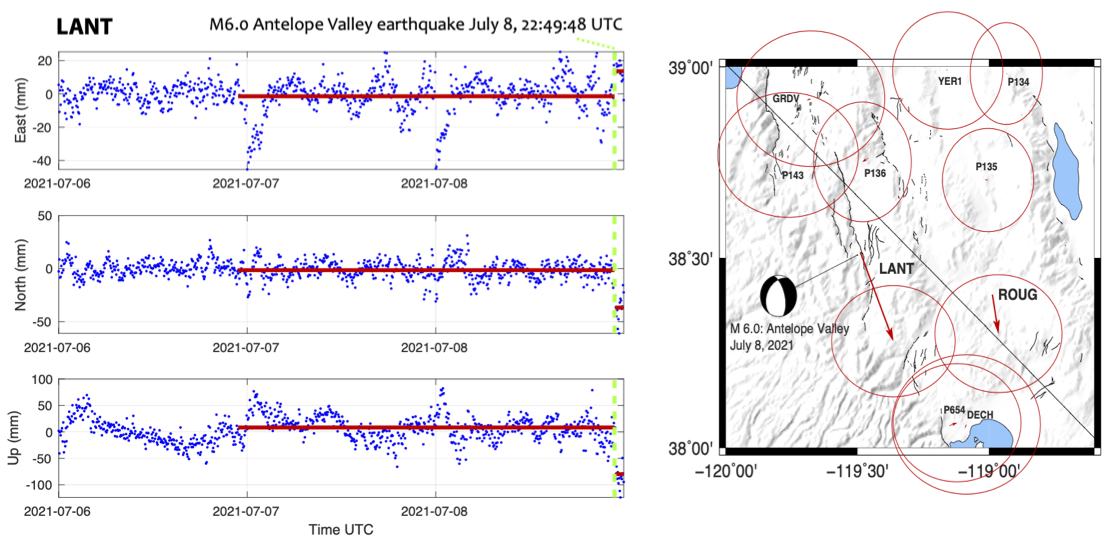 Note the post-earthquake data is right of the green dashed line which denotes the time of the event.
[July 3, 2021] - New Paper and Data Product: Global Vertical Land Motion
Sea level rise is a global problem. Vertical motion of the land directly affects coastal relative sea level rise, and has many possible driving mechanisms, e.g., plate tectonic movements, earthquakes, subsidence from aquifer withdrawal, post-glacial rebound, mantle flow, or other active geophysical processes.The precision, coverage, and prevalence of open data holdings that are now available from GPS stations around the world provide a unique dataset for constraining these movements on a global scale. Since GPS stations around the world are of various quality and very heterogeneously distributed, our analysis emphasizes robust methods to obtain geographically balanced estimates of a global field. We use these estimates to show the rates and patterns of vertical land movement and evaluate the balance of uplift and subsidence across the Earth's surface.
The method and results are described in a new manuscript published with open access in the Journal of Geophysical Researh: Solid Earth.
Click here to access the data product that provides maps and rates at over 2300 tide gauges around the world.
Development of this product was made possible trough funding from the NASA Sea Level Change Team.
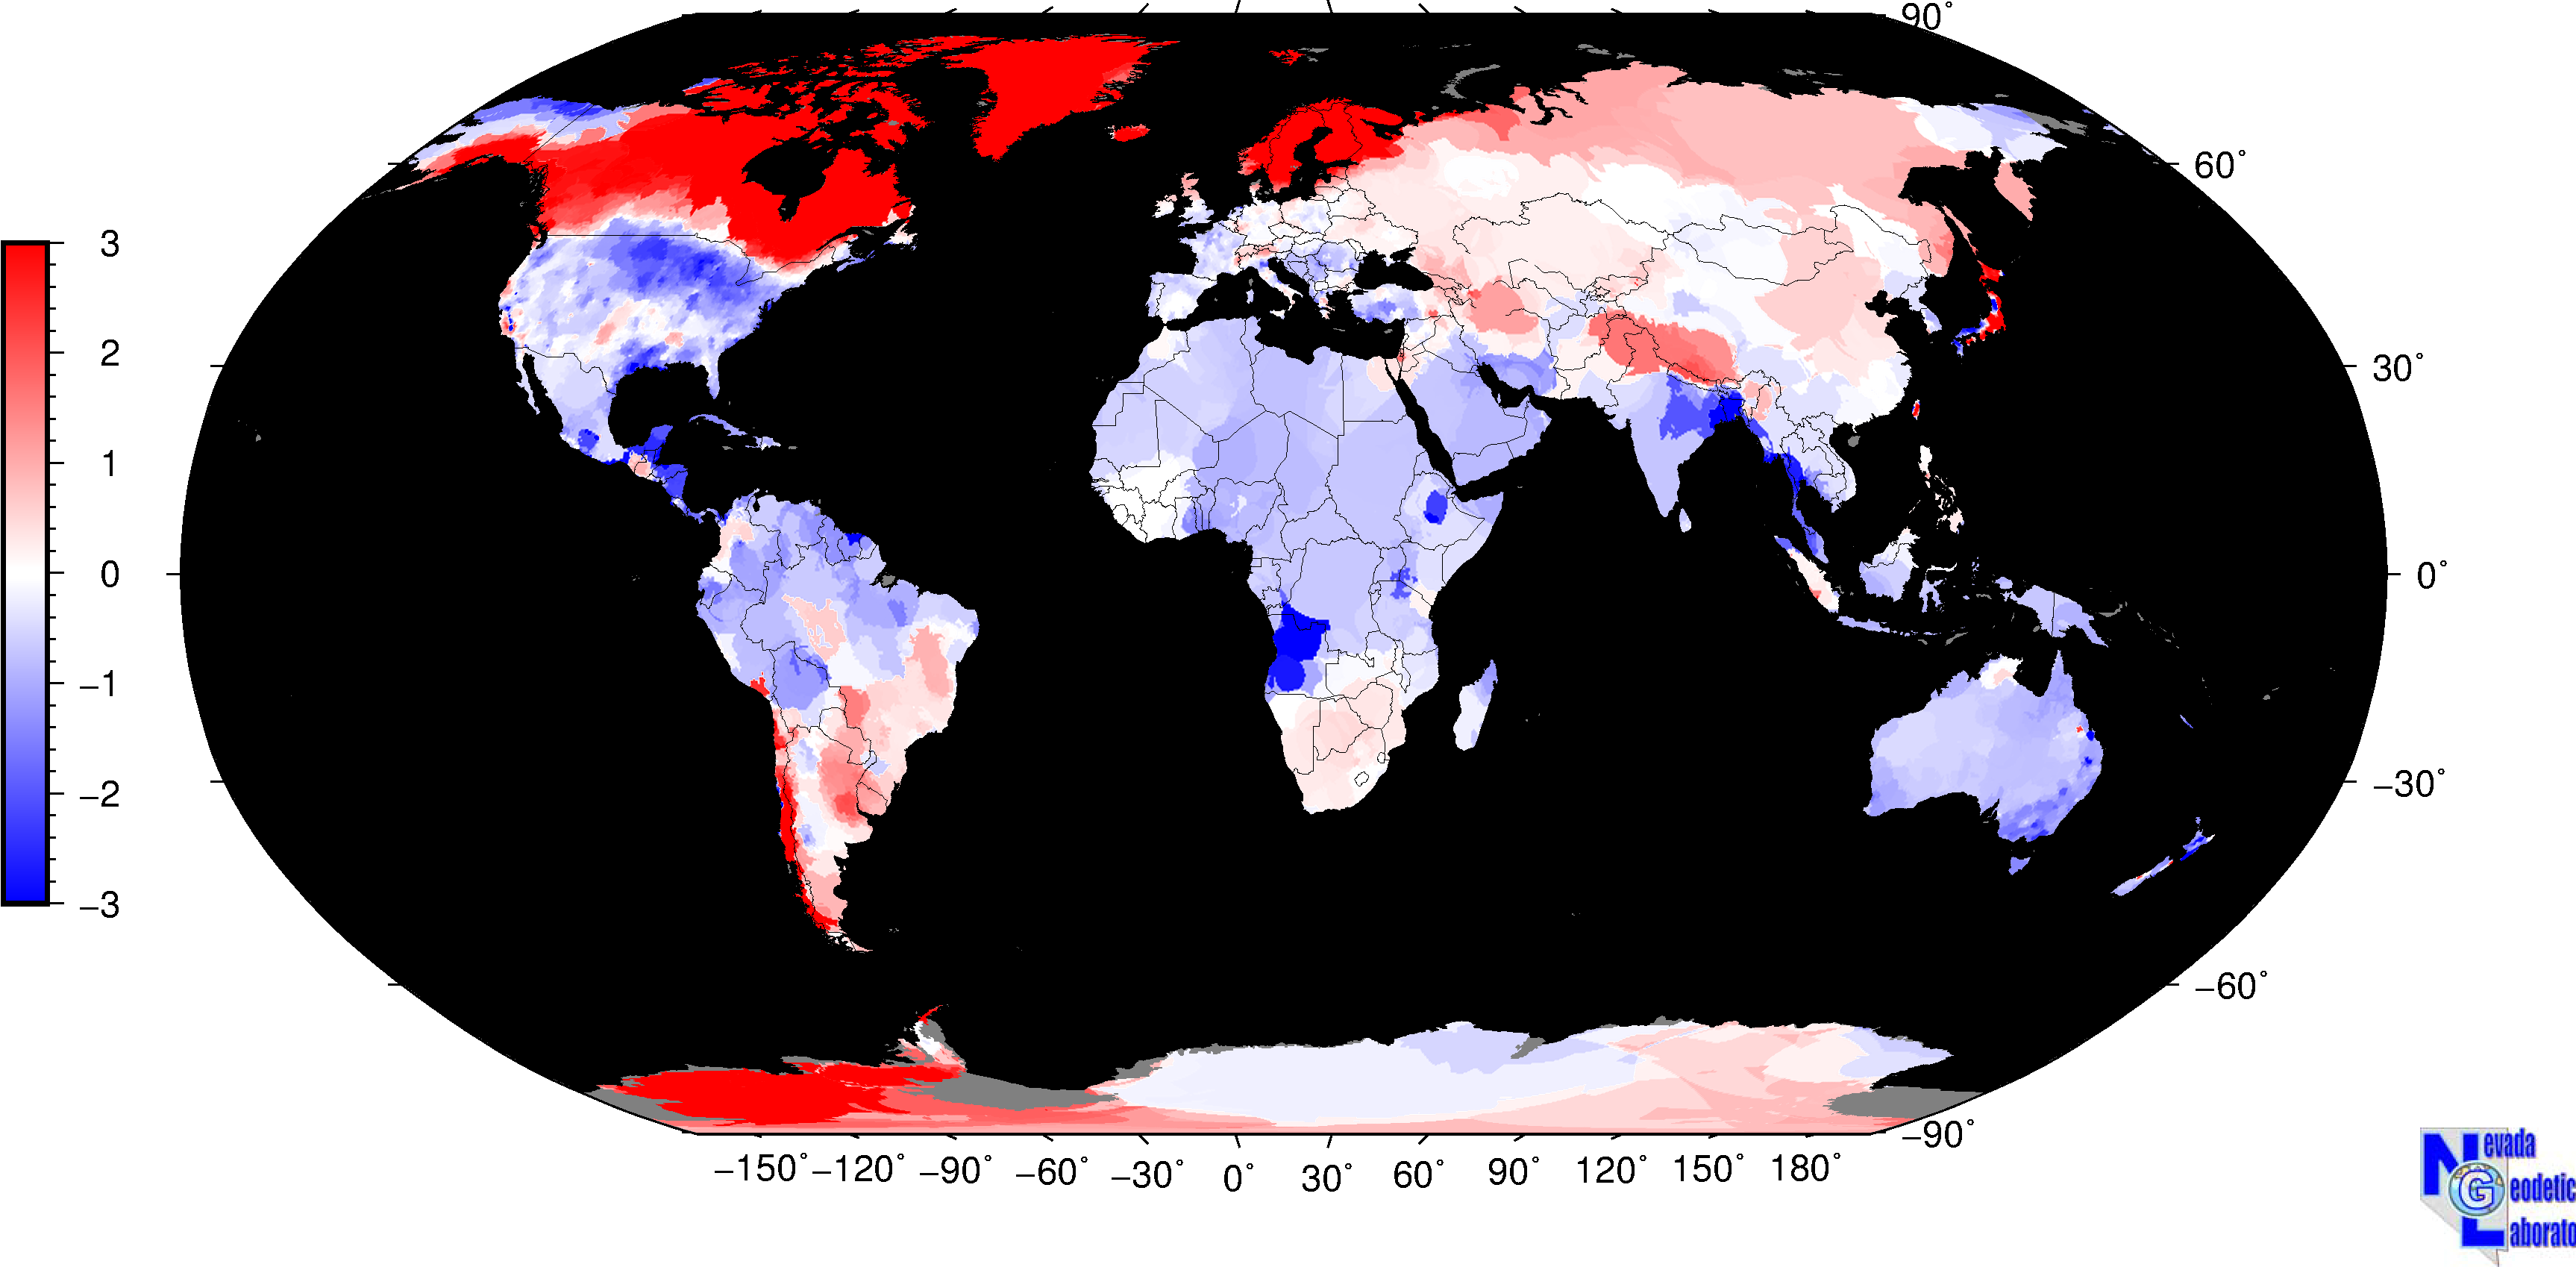
Color scale in mm/yr.
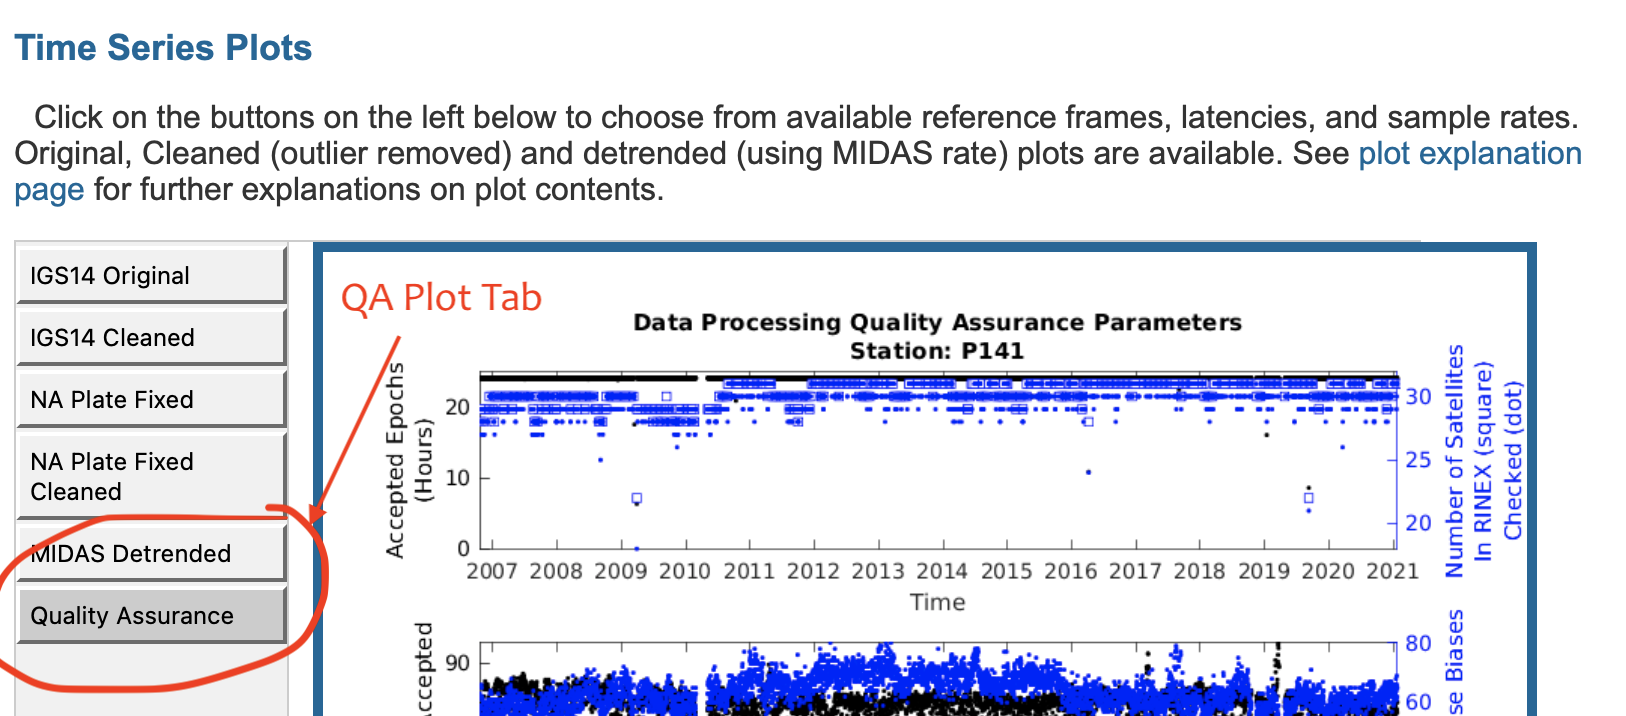
[May 18, 2021] - New Quality Assurance (QA) Plots Now Available on Station Pages
Those interested in our GPS solutions may find utility in a new data product that is now available for all stations in our holdings. For some time the Quality Assurance (QA) files have been produced and made available as text files, linked from the station pages (e.g. for station P141 you can download the the P141 QA file).Now these files are available in graphical form as plots that can be easily compared to the position time series. The plots show time series of parameter values that provide in-depth knowledge of the results and quality of the data processing, including, for example, the number of phase biases and percent of phases accepted, metrics that show how well the derived positions fit the code and phase data, plus many others. Importantly, the files can reveal when equipment performance is degrading, or external factors effect the results of processing. Thus the QA parameters can be used to track down errors, problems, and/or equipment issues with the GPS station.
The tab for the QA plot is the last tab listed for the time series plots on each station page.
The guide to the QA files describes the parameters and how they can reveal factors that influence processing results.
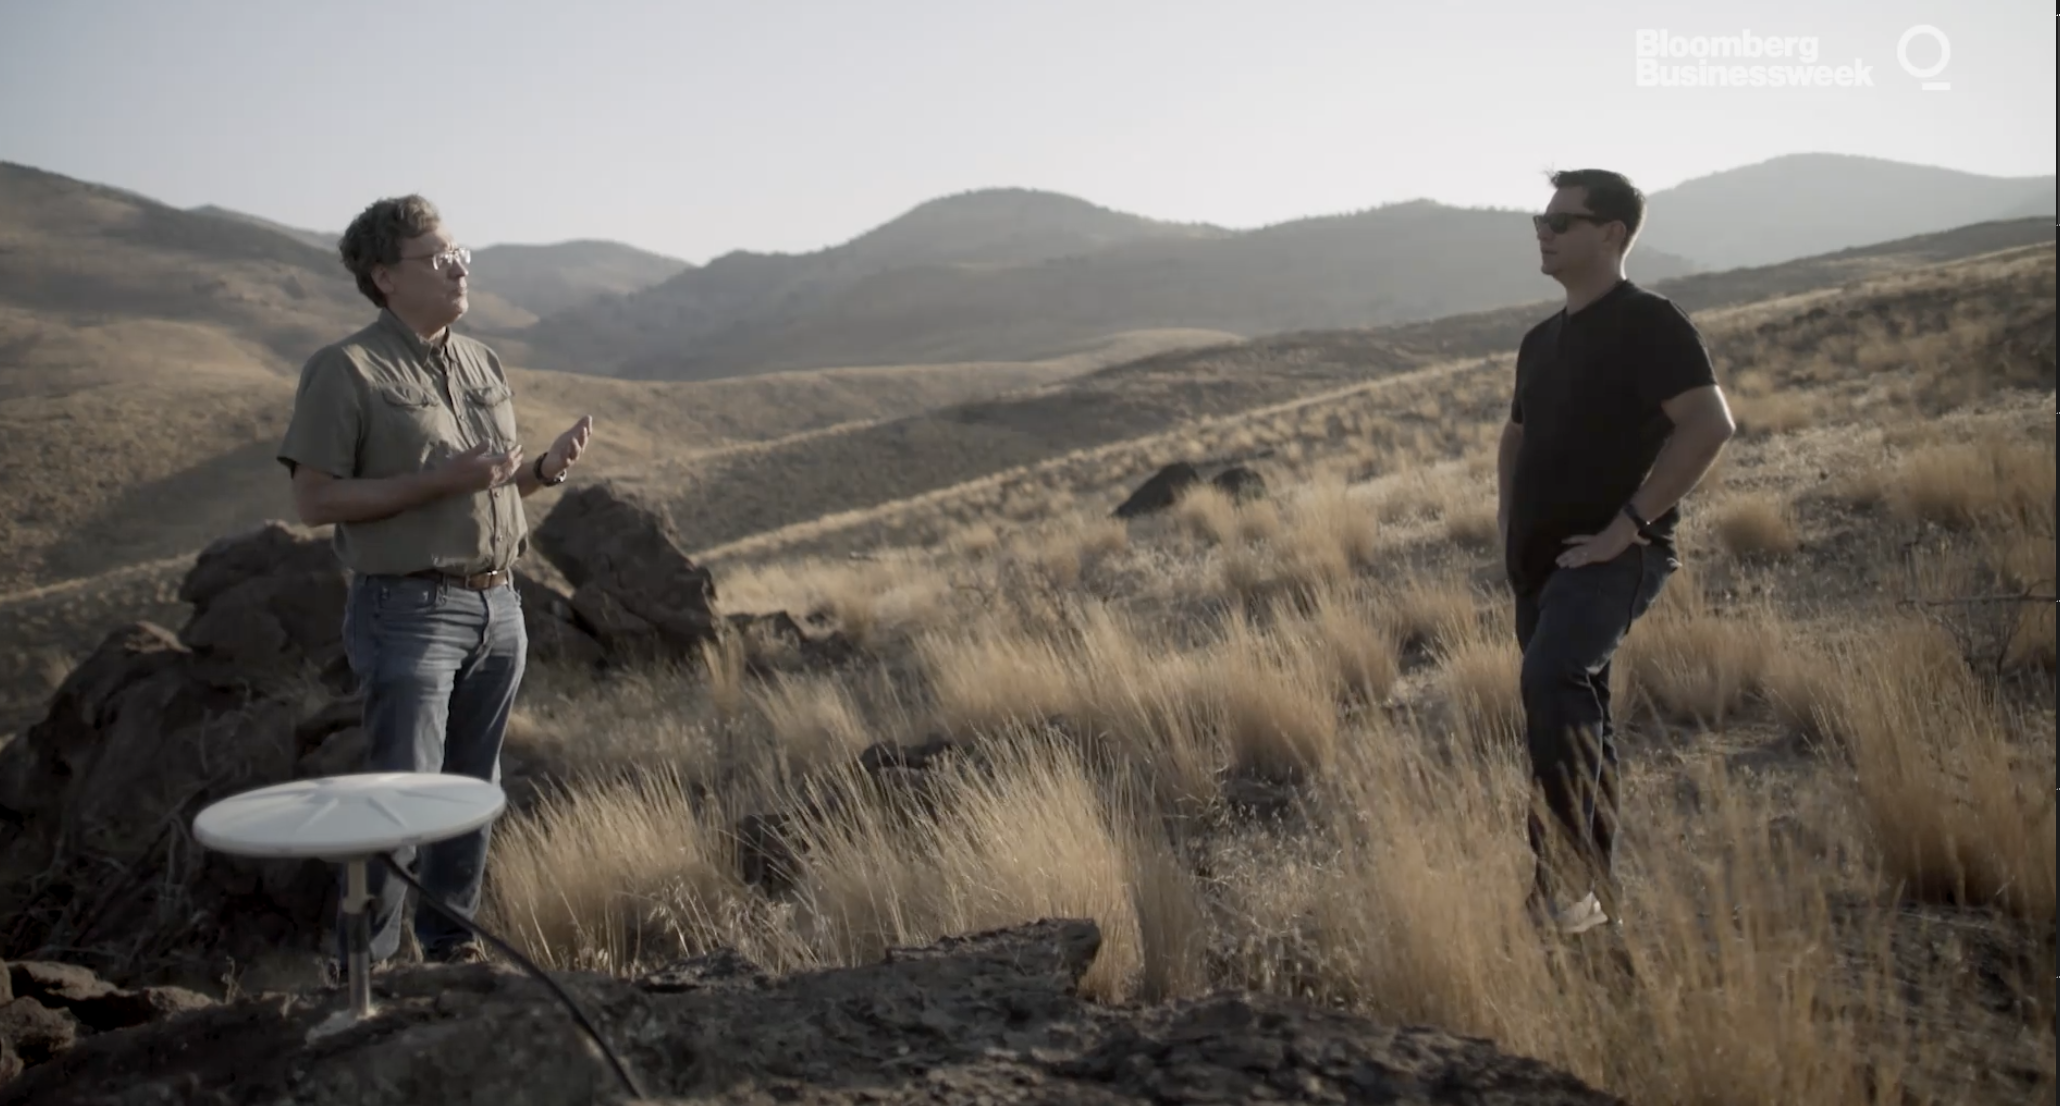
[January 21, 2021] - MAGNET featured in Bloomberg Video
NBMG Director Jim Faulds appears in a fun Bloomberg story about Highway 395, Tesla and the Walker Lane. Starting around 3:00 he discusses the MAGNET Network's role in measuring the faults and deformation in the Walker Lane.
Check it out:
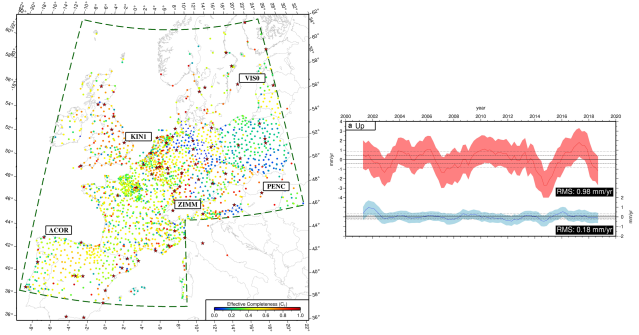
[January 9, 2021] - New Paper on Common-mode Filtering
There is a new paper from Corné Kreemer and Geoff Blewitt from NGL on reducing scatter in geodetic time-series. The paper presents a method that removes more noise than any other previous common-mode “filtering” technique. The secret is to define “common” as local as possible, and use all stations.The paper is available at the Journal of Geodesy.
The example below-right is a MIDAS velocity time-series for station KIN1 using 2.5-year periods centered on a moving window for every 0.2 years. Red/blue lines and outline are velocity and one standard deviation for unfiltered and filtered time-series, respectively. Velocities are plotted relative to long-term trend and, for reference, the dashed and dotted lines are 1 and 2 standard deviations in that trend, respectively. Please see the manuscript for details.
[December 23, 2020] - A Pair of New Earthquake Geodesy Papers
The challenges in 2020 were many. Included in these were significant earthquakes in Nevada and Idaho, both with magnitude ~6.5. Permanent displacements of the Earth surface from these events were detected in GPS networks and have been used to learn more about the earthquake cycle in the seismically active part of the western United States.The Monte Cristo Range earthquake of May 15, 2020 struck the central Walker Lane, squarely within the MAGNET semi-continuous GPS network where ~1 dozen of our receivers were serendipidously deployed near the epicenter, providing an excellent opportunity to observe co- and post-seismic left lateral strike slip deformation. The event triggered a rapid and sustained field deployment that involved students and staff of the Nevada Burean of Mines and Geology who summarized rapidly obtained geologic and geodetic data for the event. In the published study Hammond et al., 2020 present the results obtained from the deployment. They were able to constrain the coseismic and postseismic displacement fields, and use them to compare and contrast geodetic, seismic and geologic assessments of seismic moment. They also found that postseismic deformation continued for at least months afterward.
GPS-measured strain accumulation prior to the event may have been optimized by the postseismic movements from previous 20th century earthquakes in the Central Nevada Seismic Belt, suggesting that faults in the Great Basin may interact and influence the timing of one anothers coseismic release.
Pollitz et al., 2020 investigated the M 6.5 Stanley, Idaho earthquake with a combination of InSAR, GPS and seismic waveform data. They found that the event had up to 2 meters of left‐lateral and normal slip on an ~10 km long south‐southeast‐striking fault, which could represent a previously unidentified northern extension of the Sawthooth fault. The complex event involved minor slip on conjugate planes associated with the Trans-Challis fault system, and complementary postseismic afterslip.
Both studies used data from the NSF Network of the Americas, operated by UNAVCO. They have both been published in a special issue of Seismological Research Letters on the recent Intermountain West Earthquakes.
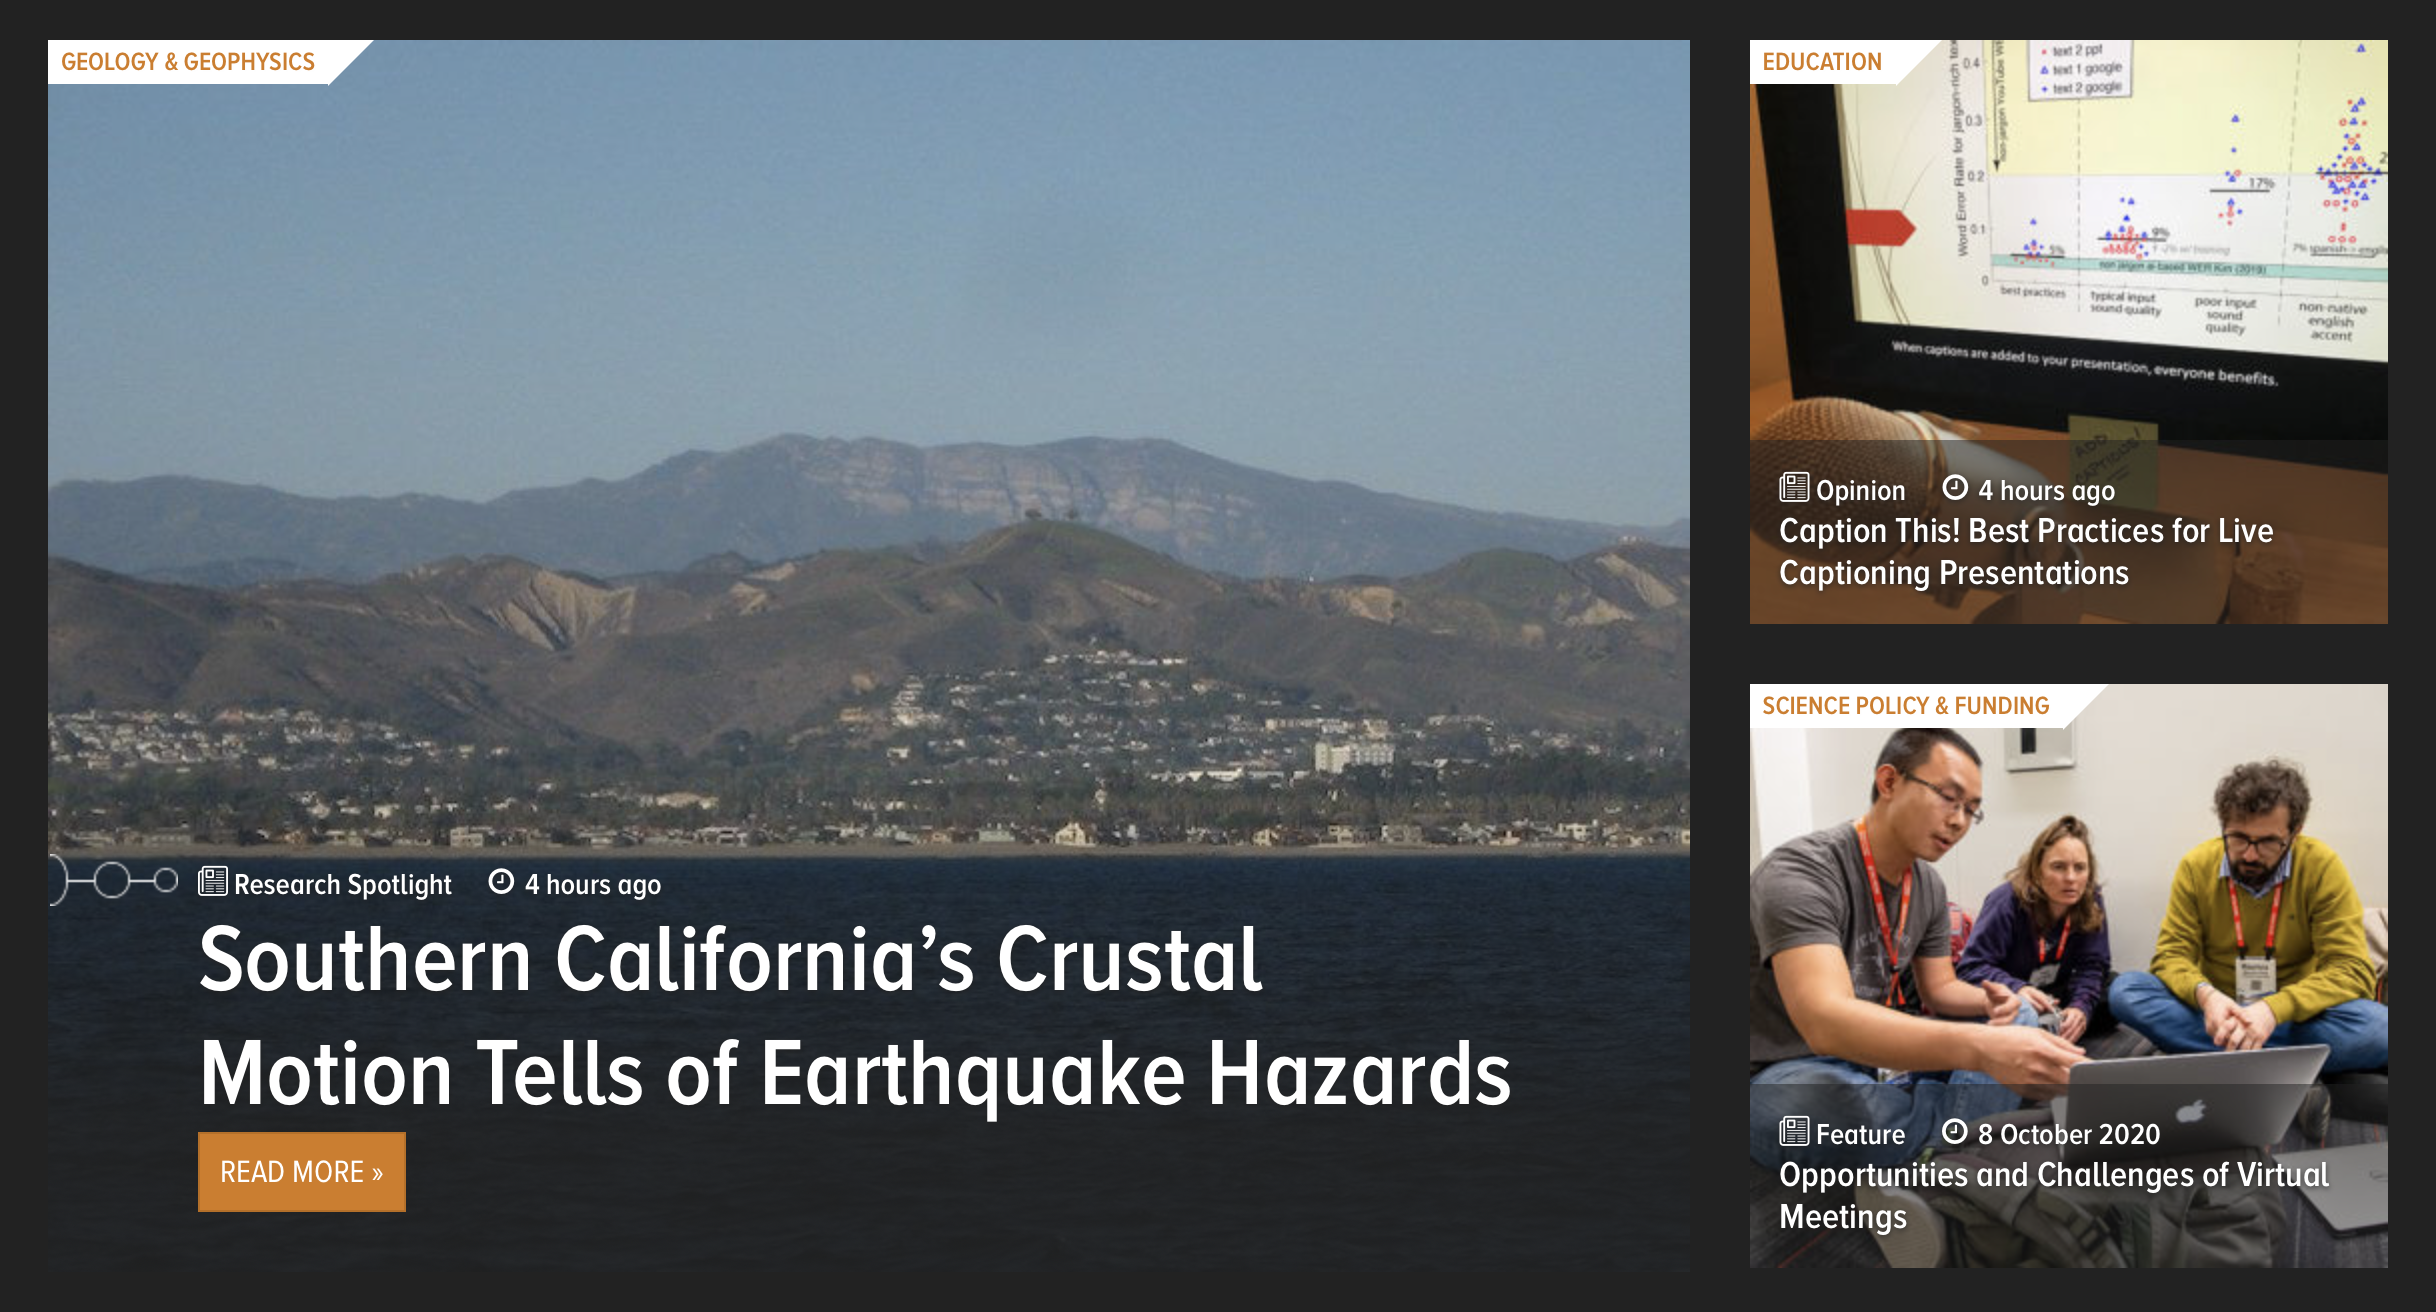
[October 9, 2020] Western Transverse Ranges Research Spotlight in Eos
In collaboration with a multi-institution team NGL has published a new study on the long- and short-term uplift of the western Transverse Ranges, and how these motions relate to fault activity, slip rates and earthquake potential. The study integrates geodetic data with fault and other geologic data to model subsidence along the Santa Barbara coastline and uplift of the Santa Ynez Range. The uplift and subsidence are consequences of recoverable elastic deformation associated with interseismic locking on faults dipping under the Western Transverse Ranges. Long term uplift of the Santa Barbara coast is achieved through the intermittant earthquakes that reverse the short term subsidence.Eos is now featuring a research spotlight on the work. To go directly to the article click on the image below, or see the post on Twitter. The Johnson et al., 2020 article is now published in the Journal of Geophysical Research - Solid Earth.
[July 23, 2020] M 7.8 Alaska Penninsula
On July 22, 2020 a thrust earthquake occurred offshore at 28 km depth within the Aleutian trench where the Pacific Plate subducts beneath the North American plate. The event caused coseismic movement of a number of stations on the Alaska Peninsula and Aleutian Islands. We estimated coseismic offsets the day after the earthquake from 5 minute sample rate time series that were derived using rapid orbits from the Jet Propulsion Laboratory. Most of the stations are from the UNAVCO operated Network of the Americas. Near the end of the peninsula the horizontal offsets indicate south-southwest motion, consistent with trenchward motion of the hanging wall. Significant vertical motions were also observed, for example station AC12 moved upward over 34 cm and station AC28 moved downward 7.5 cm.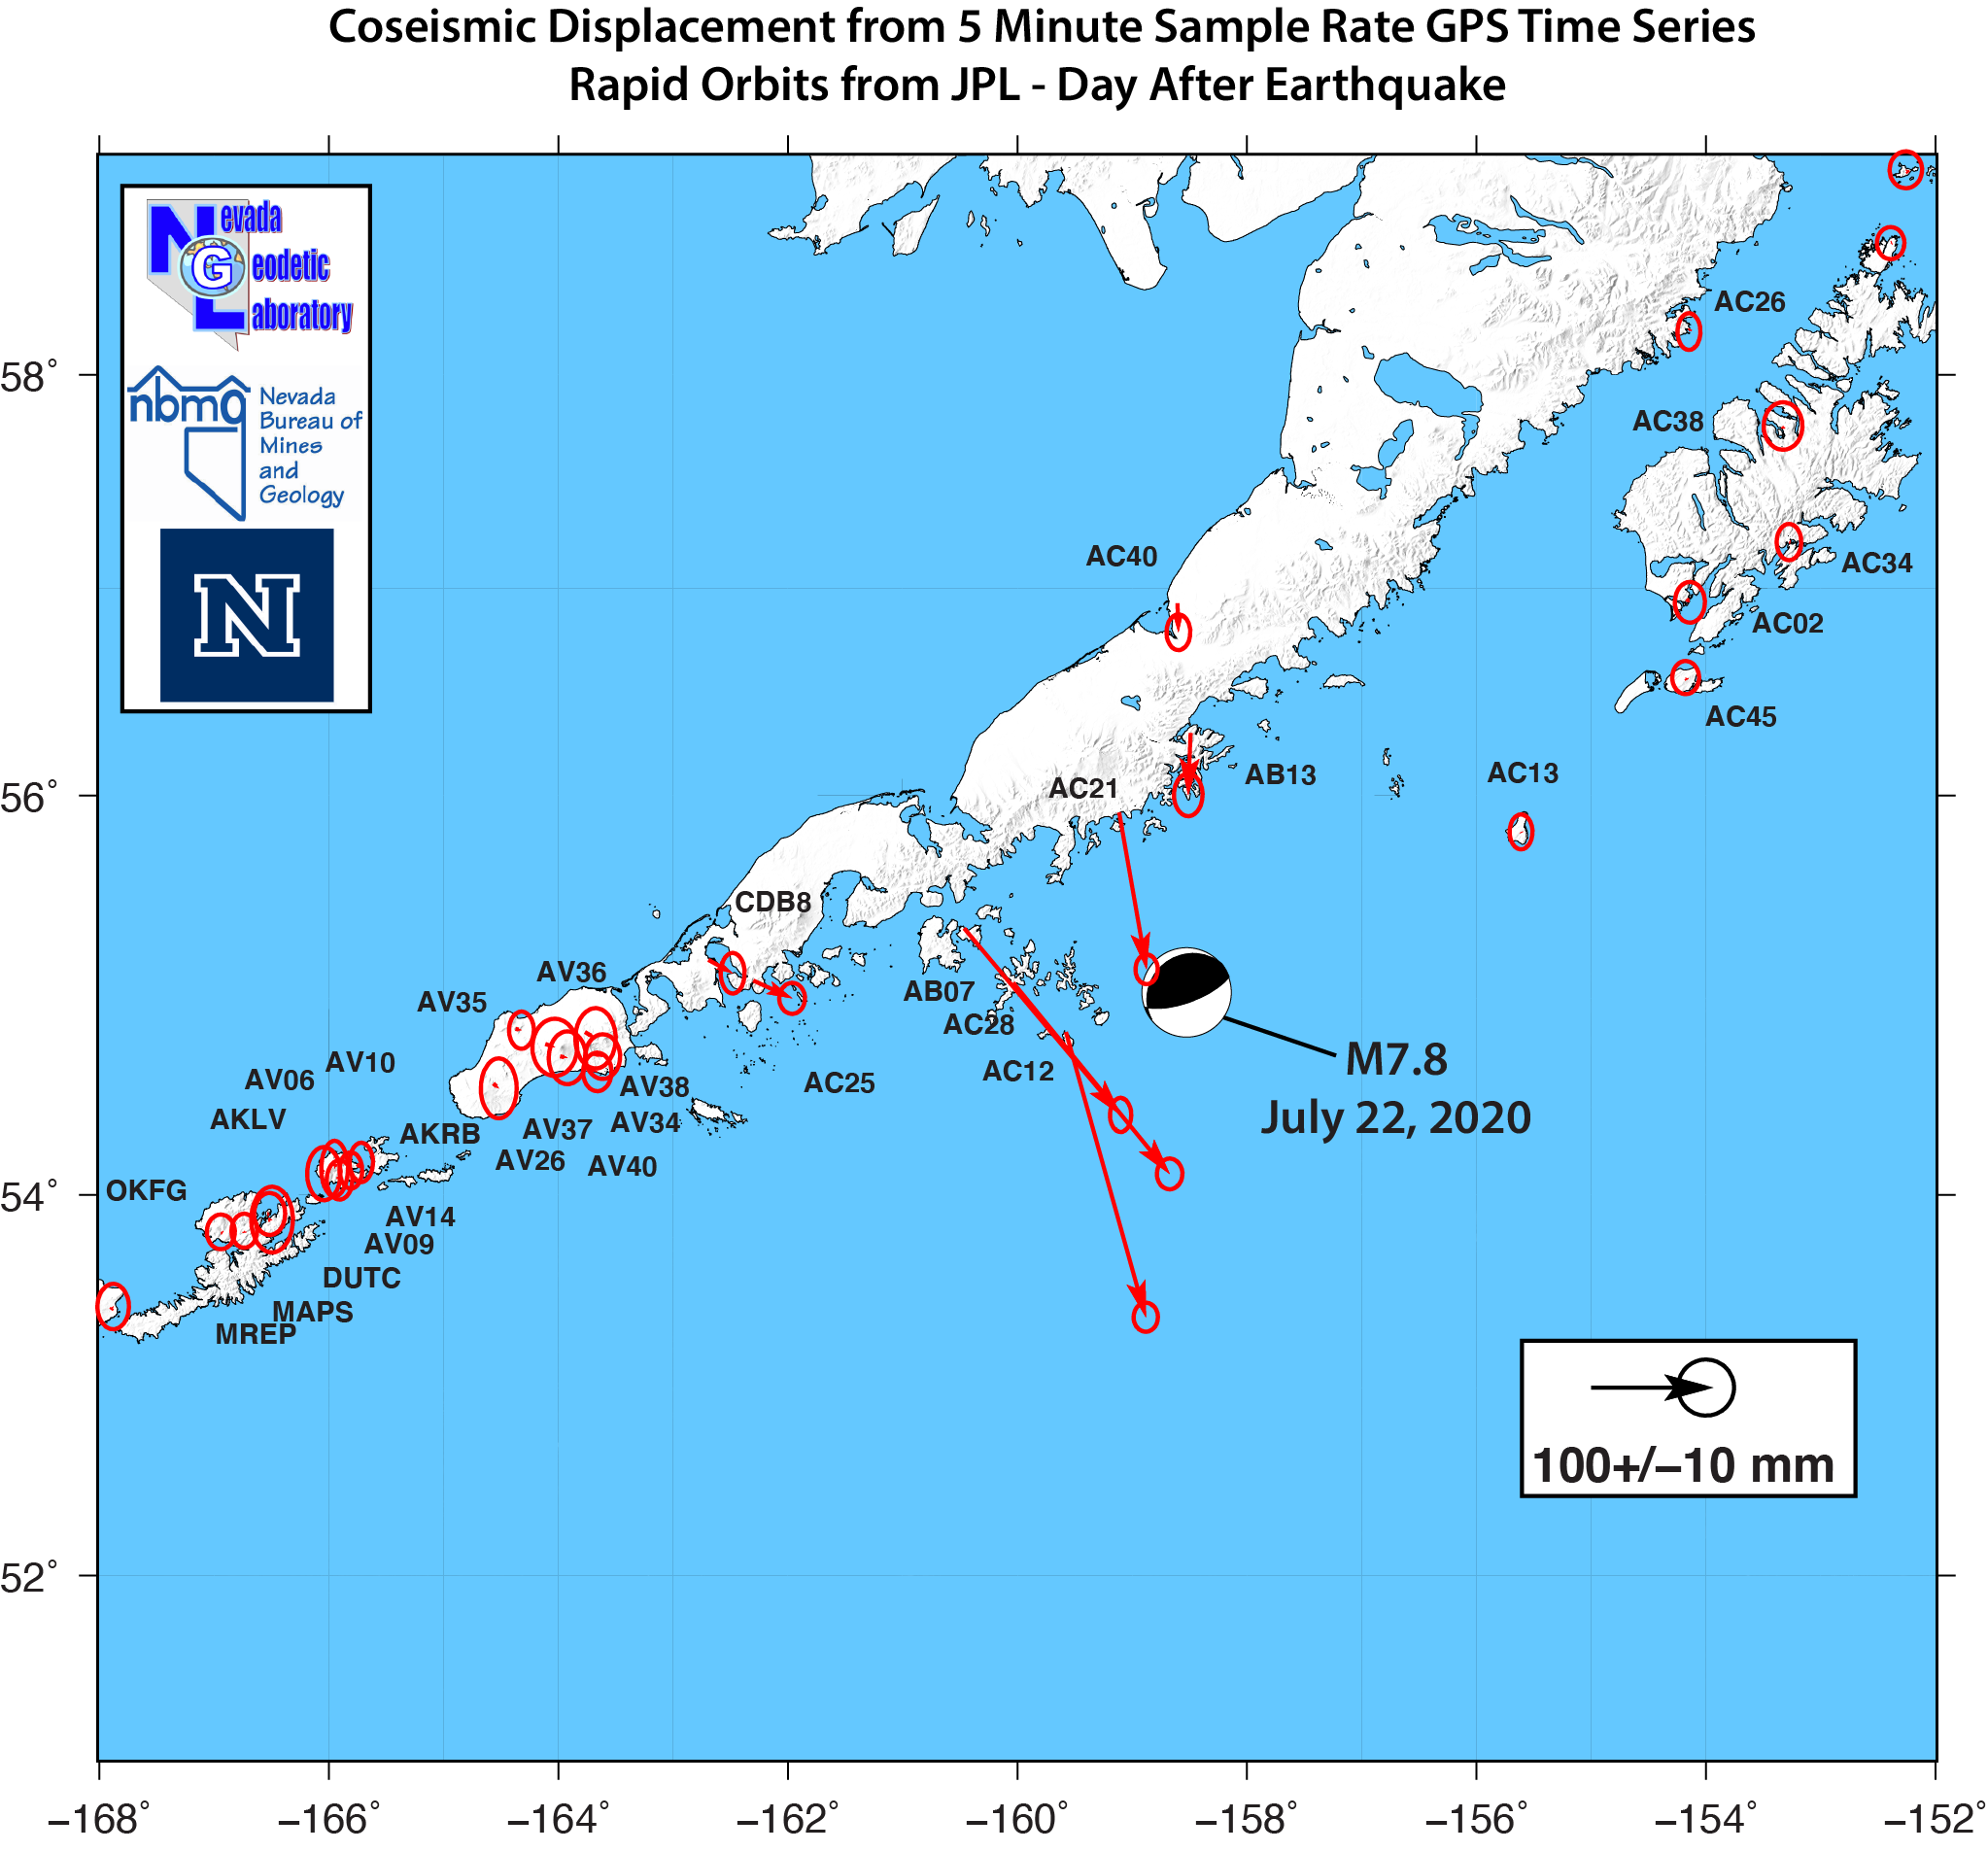
Preliminary coseismic offsets table based on next-day 5 minute solutions is : here.
[June 28, 2020] M 5.8 Earthquake Near Lone Pine, Eastern California shakes the Southern Sierra!
A moderately sized earthquake struck the southern Owens Valley on June 24, 2020, causing widespread shaking and rock fall in the southern Sierra Nevada. The event was detectable in small movements of several nearby continuous GPS stations including P093 and P465 from NSF's Network of the Americas operated by UNAVCO. P093 moved south by about 6 mm and P465 moved west about 4 mm. The direction of movements are characteristic of coseismic contraction and extension that are consistent with the P and T axes the seismic moment tensor. Precision of these measurements will improve as more post-event data are collected. Additionally, more vectors will become available once data are retrieved from stations in UNR's MAGNET GPS network (locations shown with blue triangles in figure below).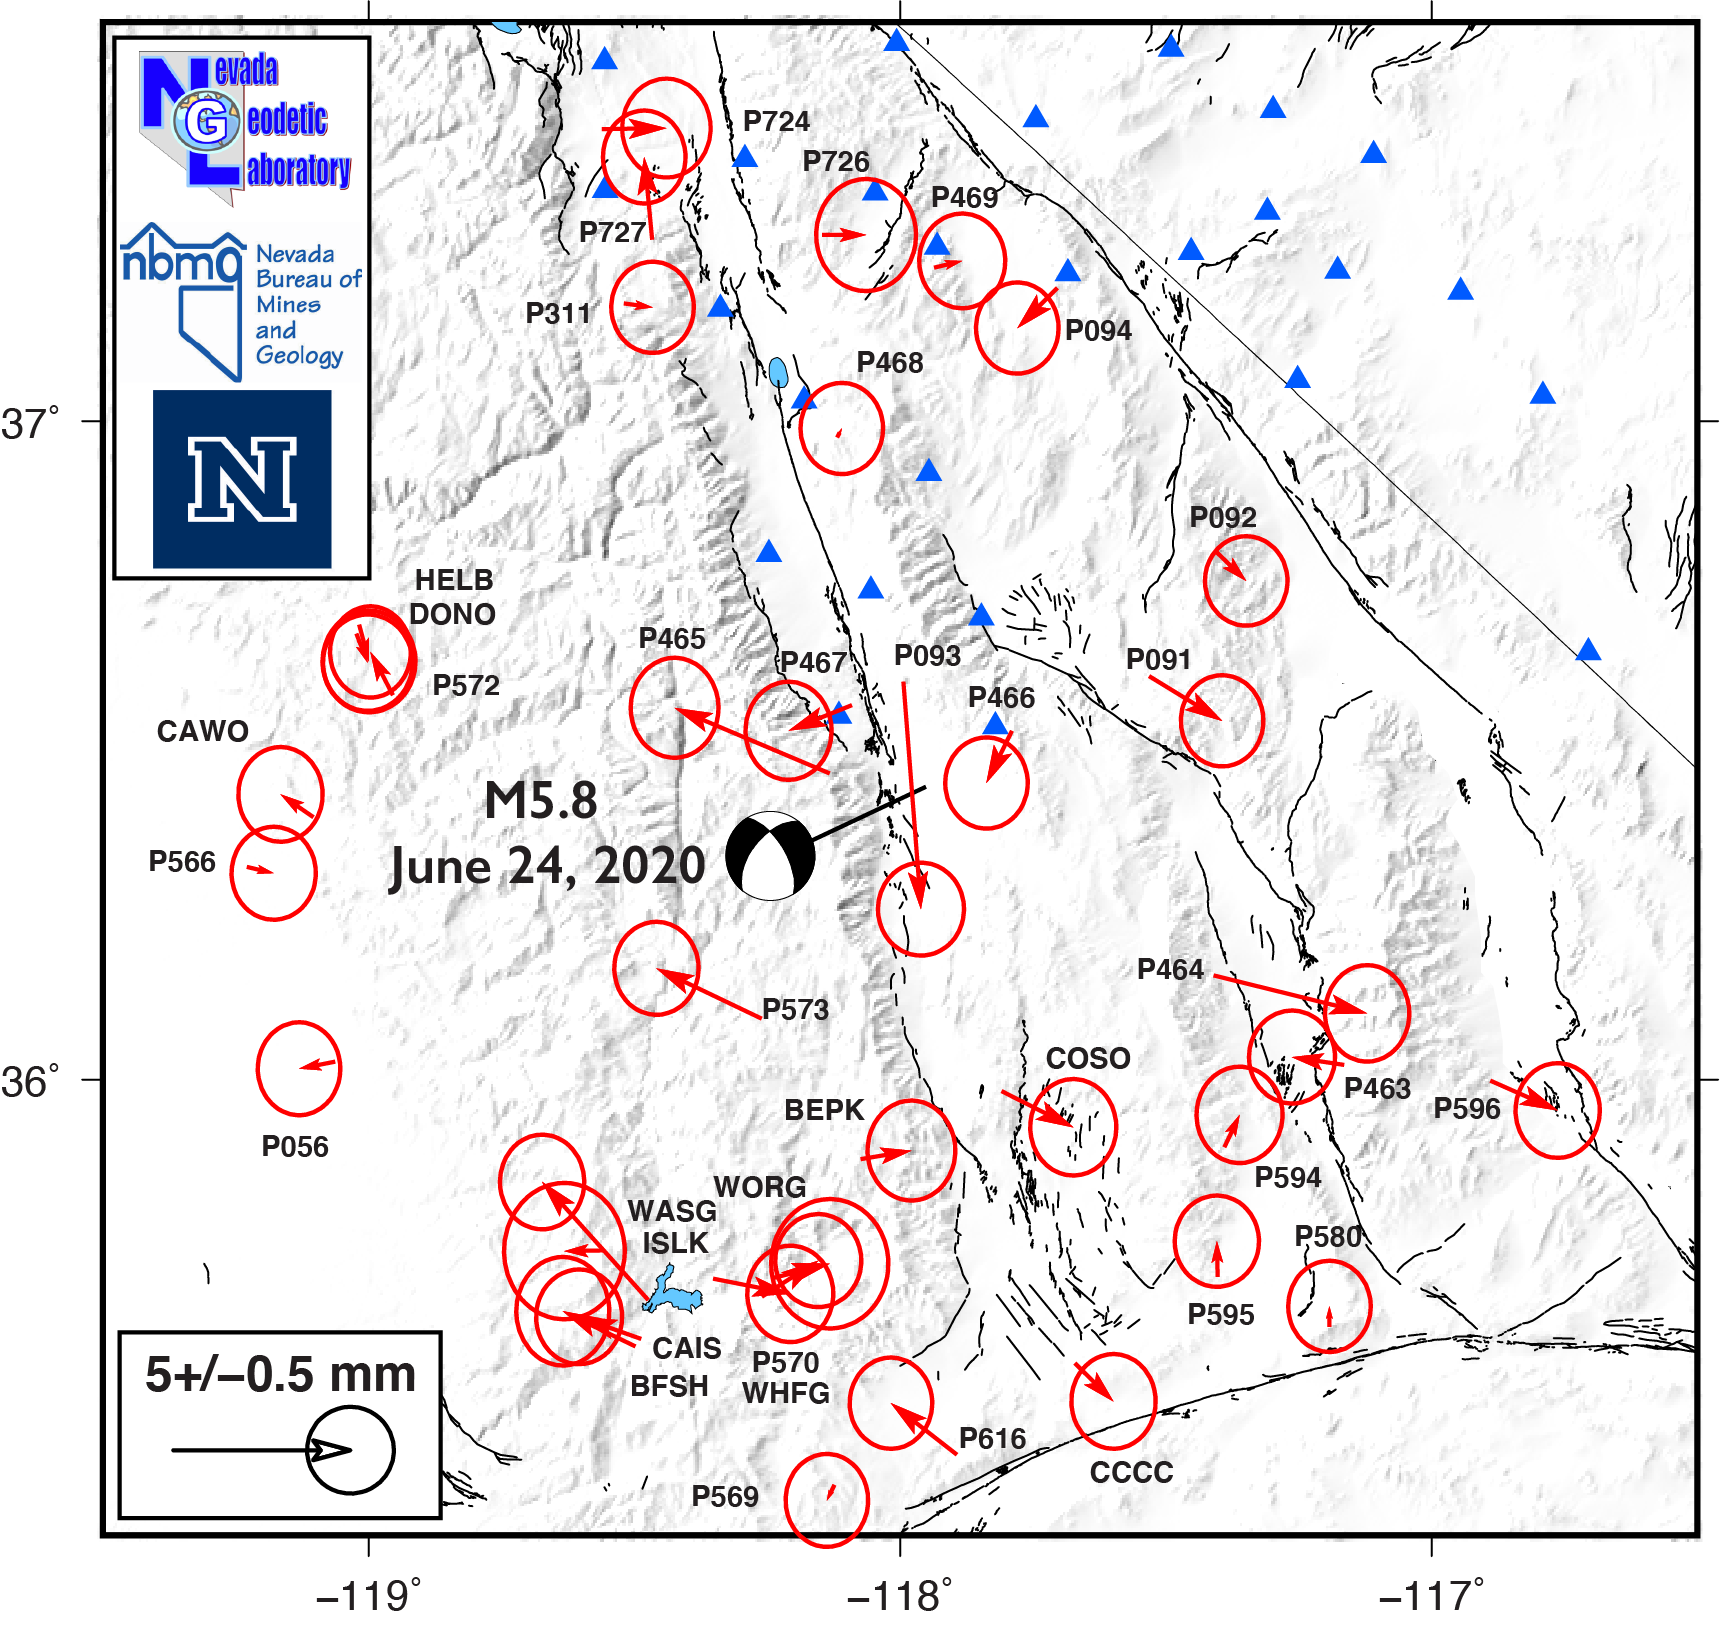
Preliminary coseismic offsets table: here.
[June 26, 2020] M 7.4 Earthquake Oaxaca, Mexico
A large earthquake struck southern Mexico on June 23, 2020. Preliminary cosismic displacements are available which show large offsets for stations nearest the epicenter. The station OXUM moved over 16 cm southwest and rose vertically over 4 cm.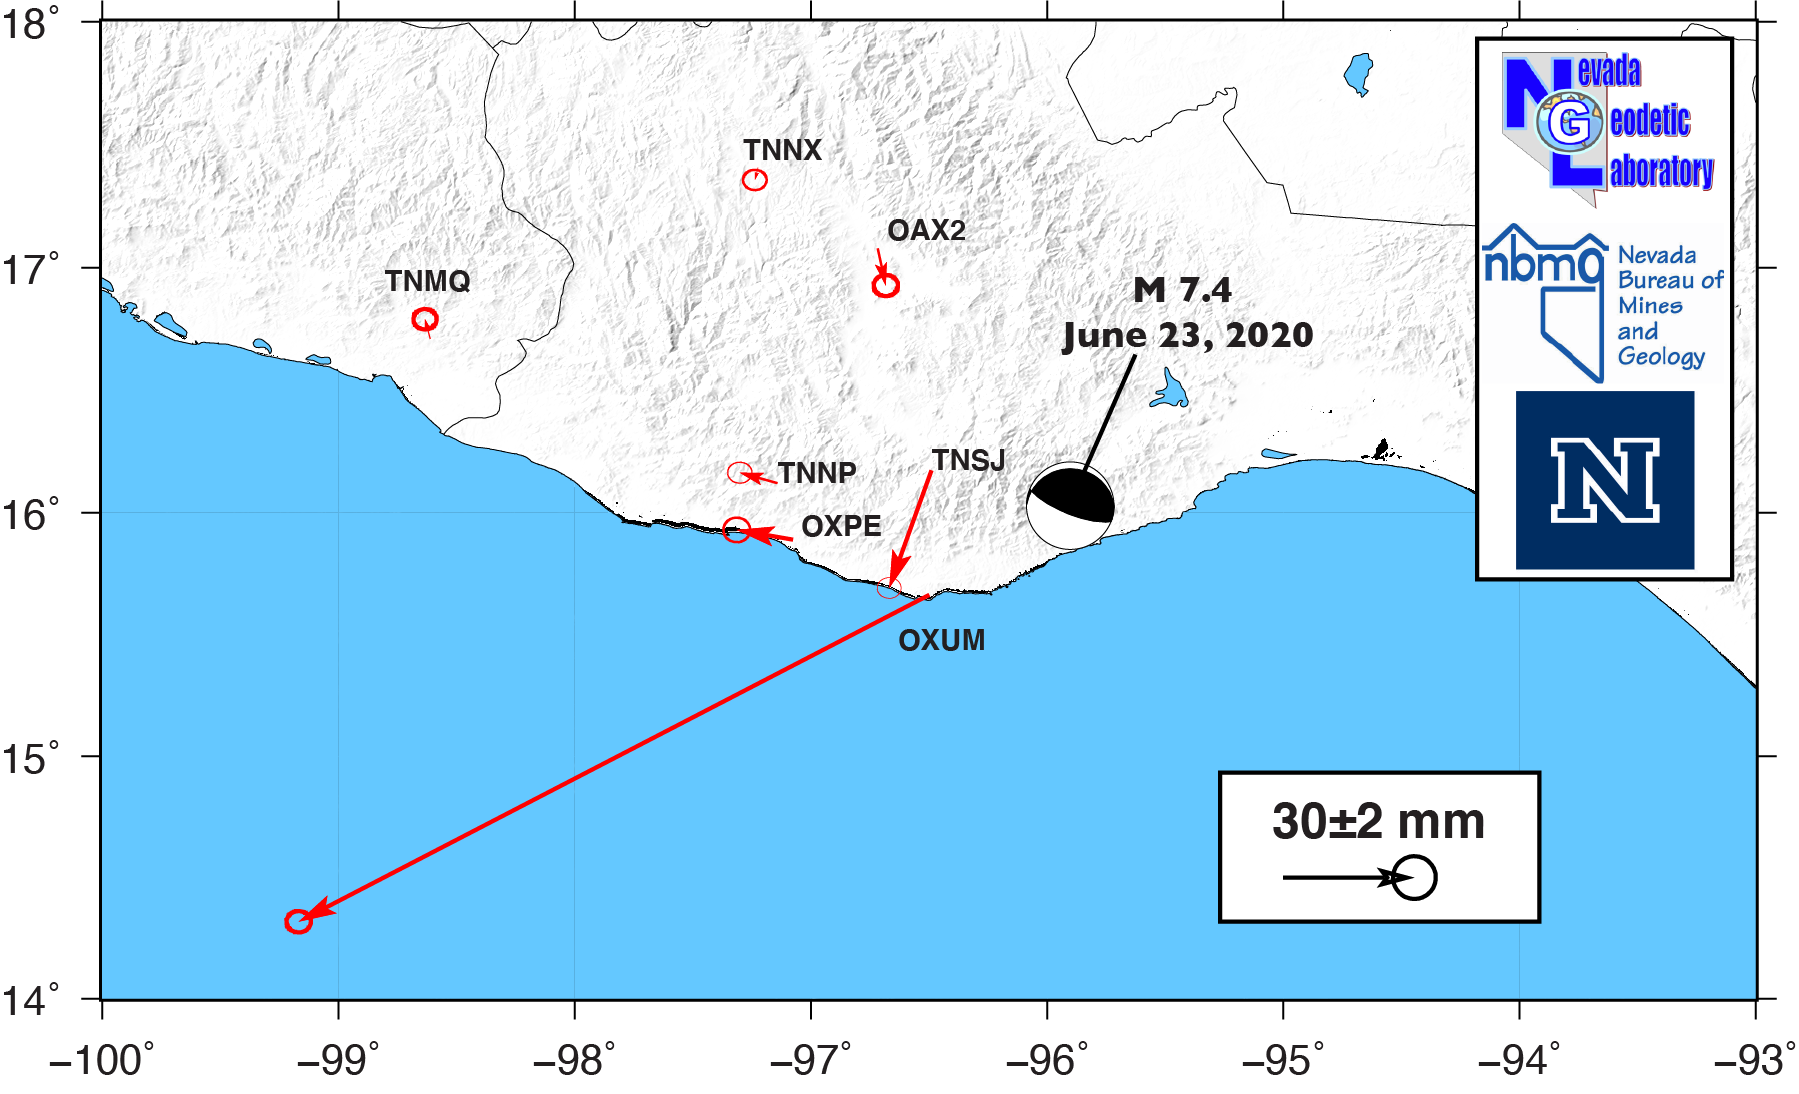
Preliminary coseismic offsets table: here.
[June 19, 2020] Update on Monte Cristo M6.5 Earthquake
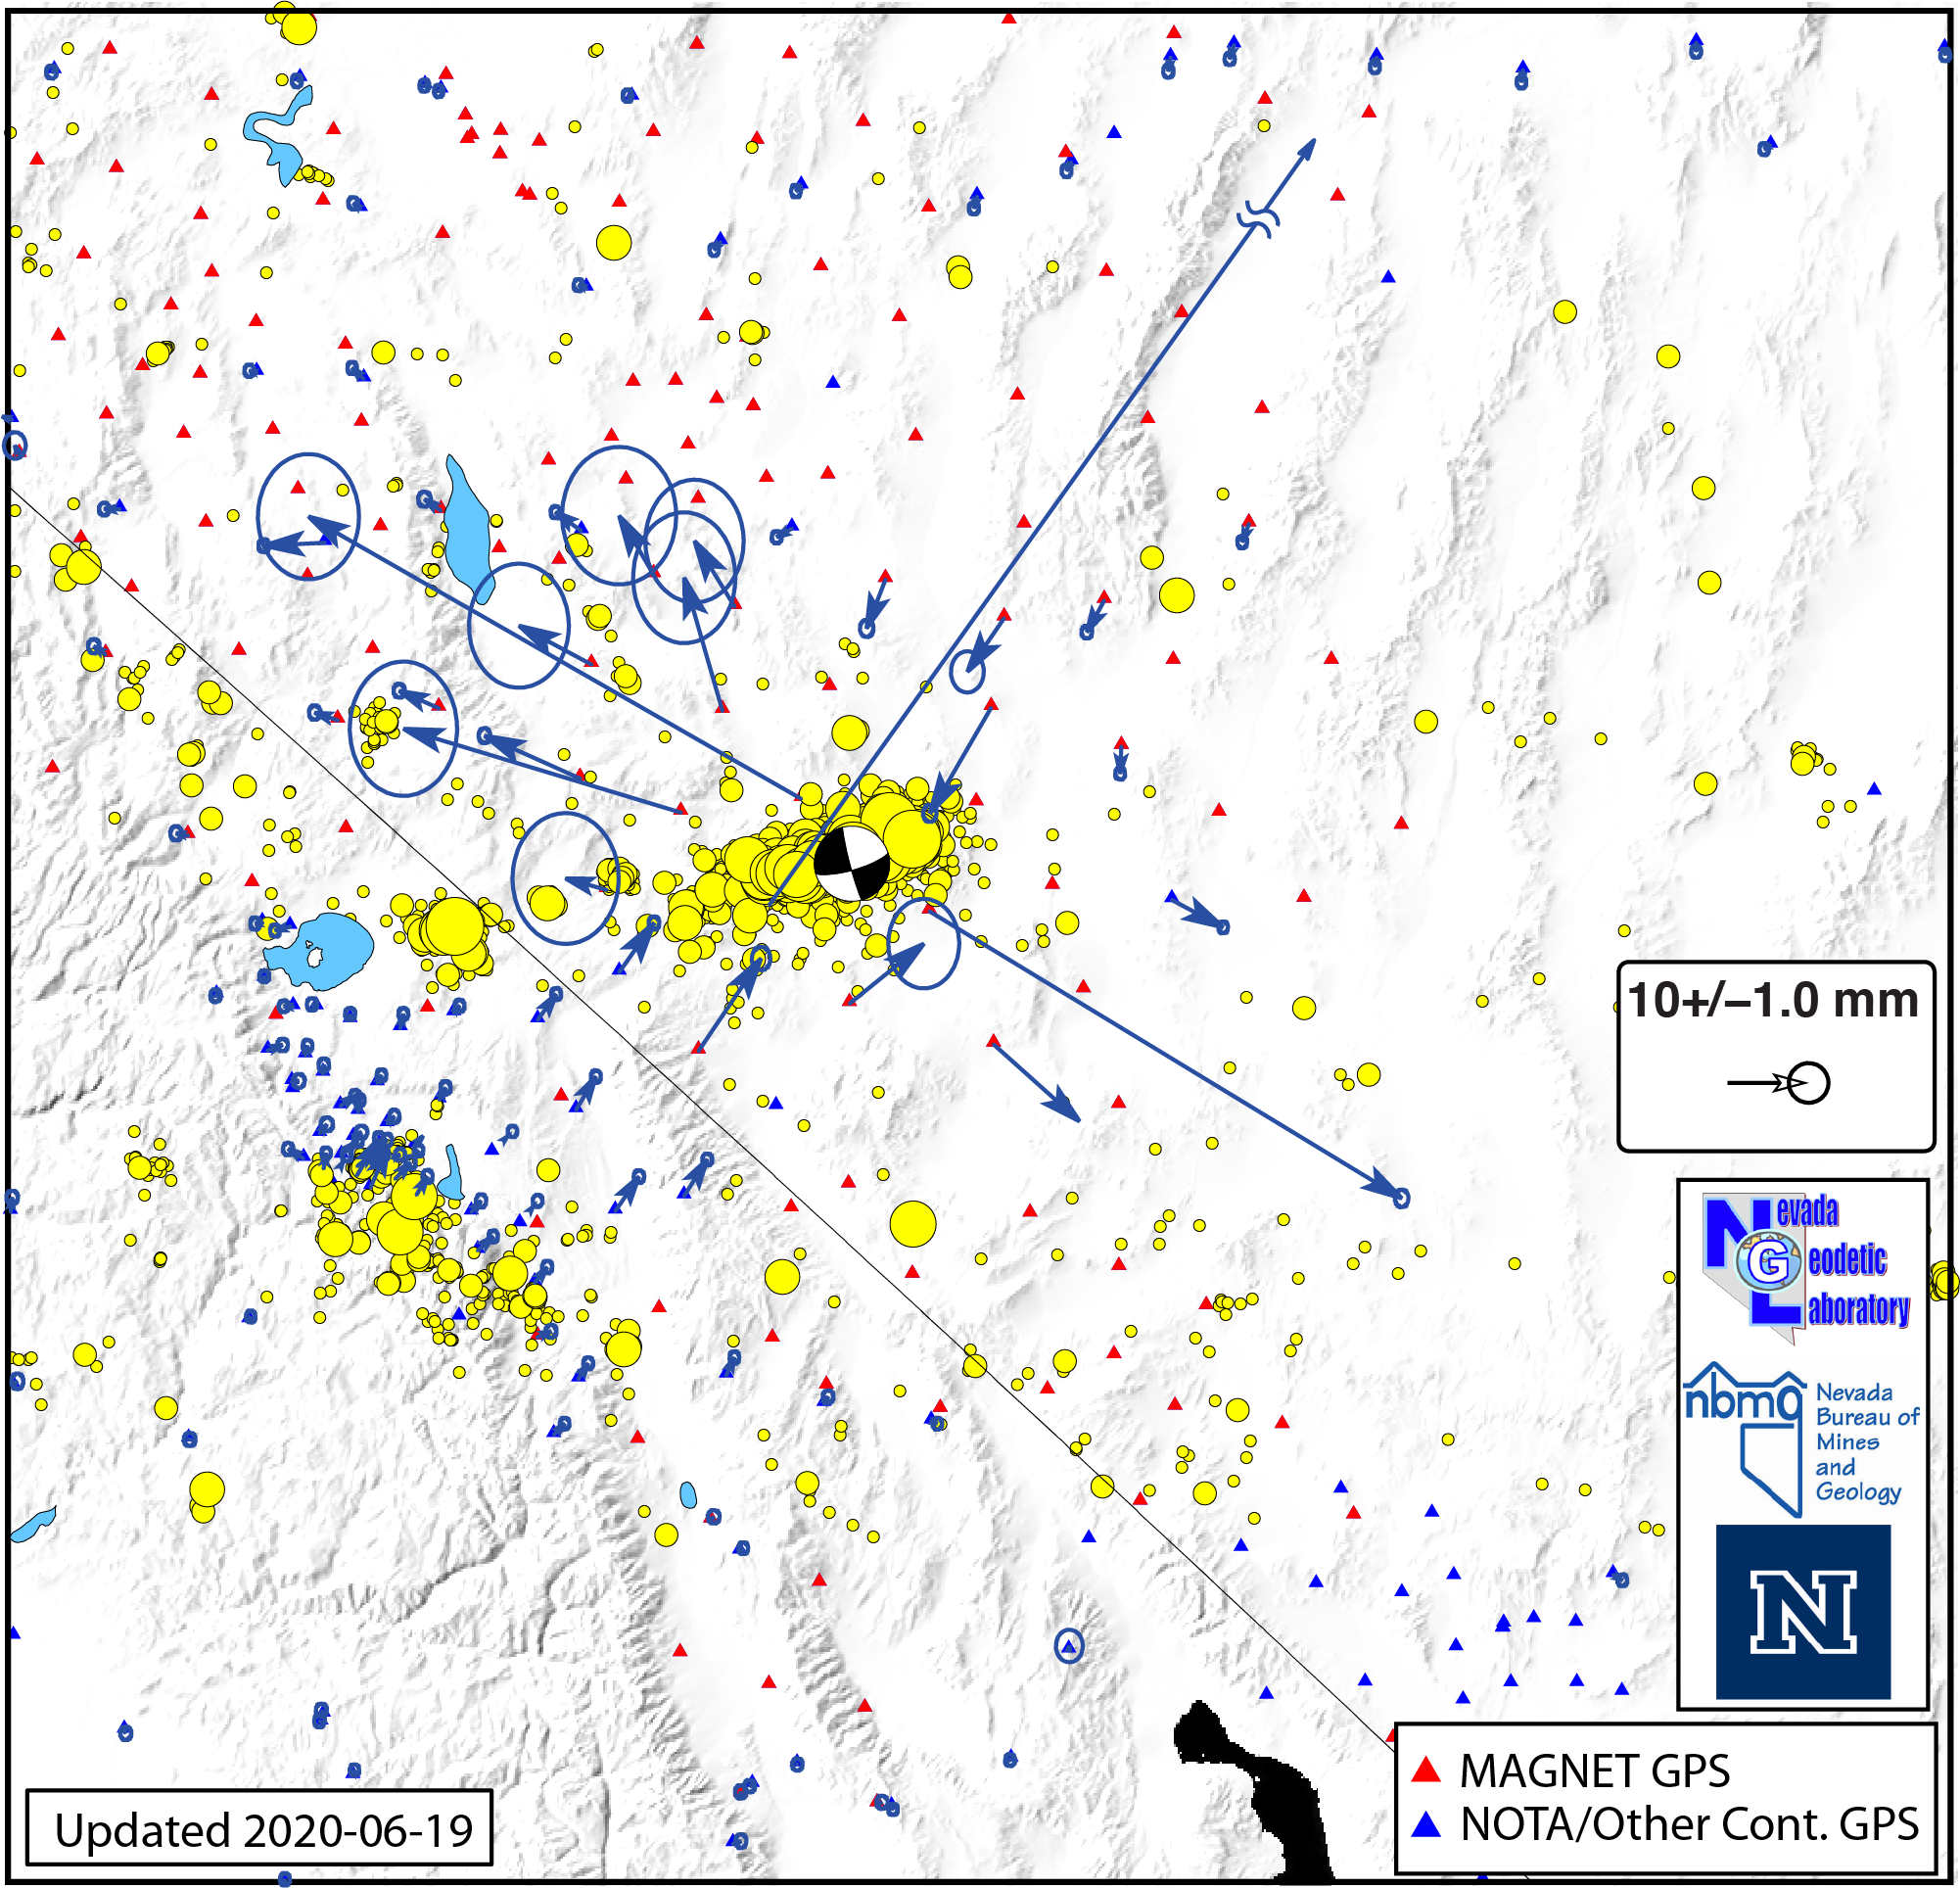
Update on coseismic offsets table: here.
[June 2, 2020] Update on Monte Cristo Earthquake
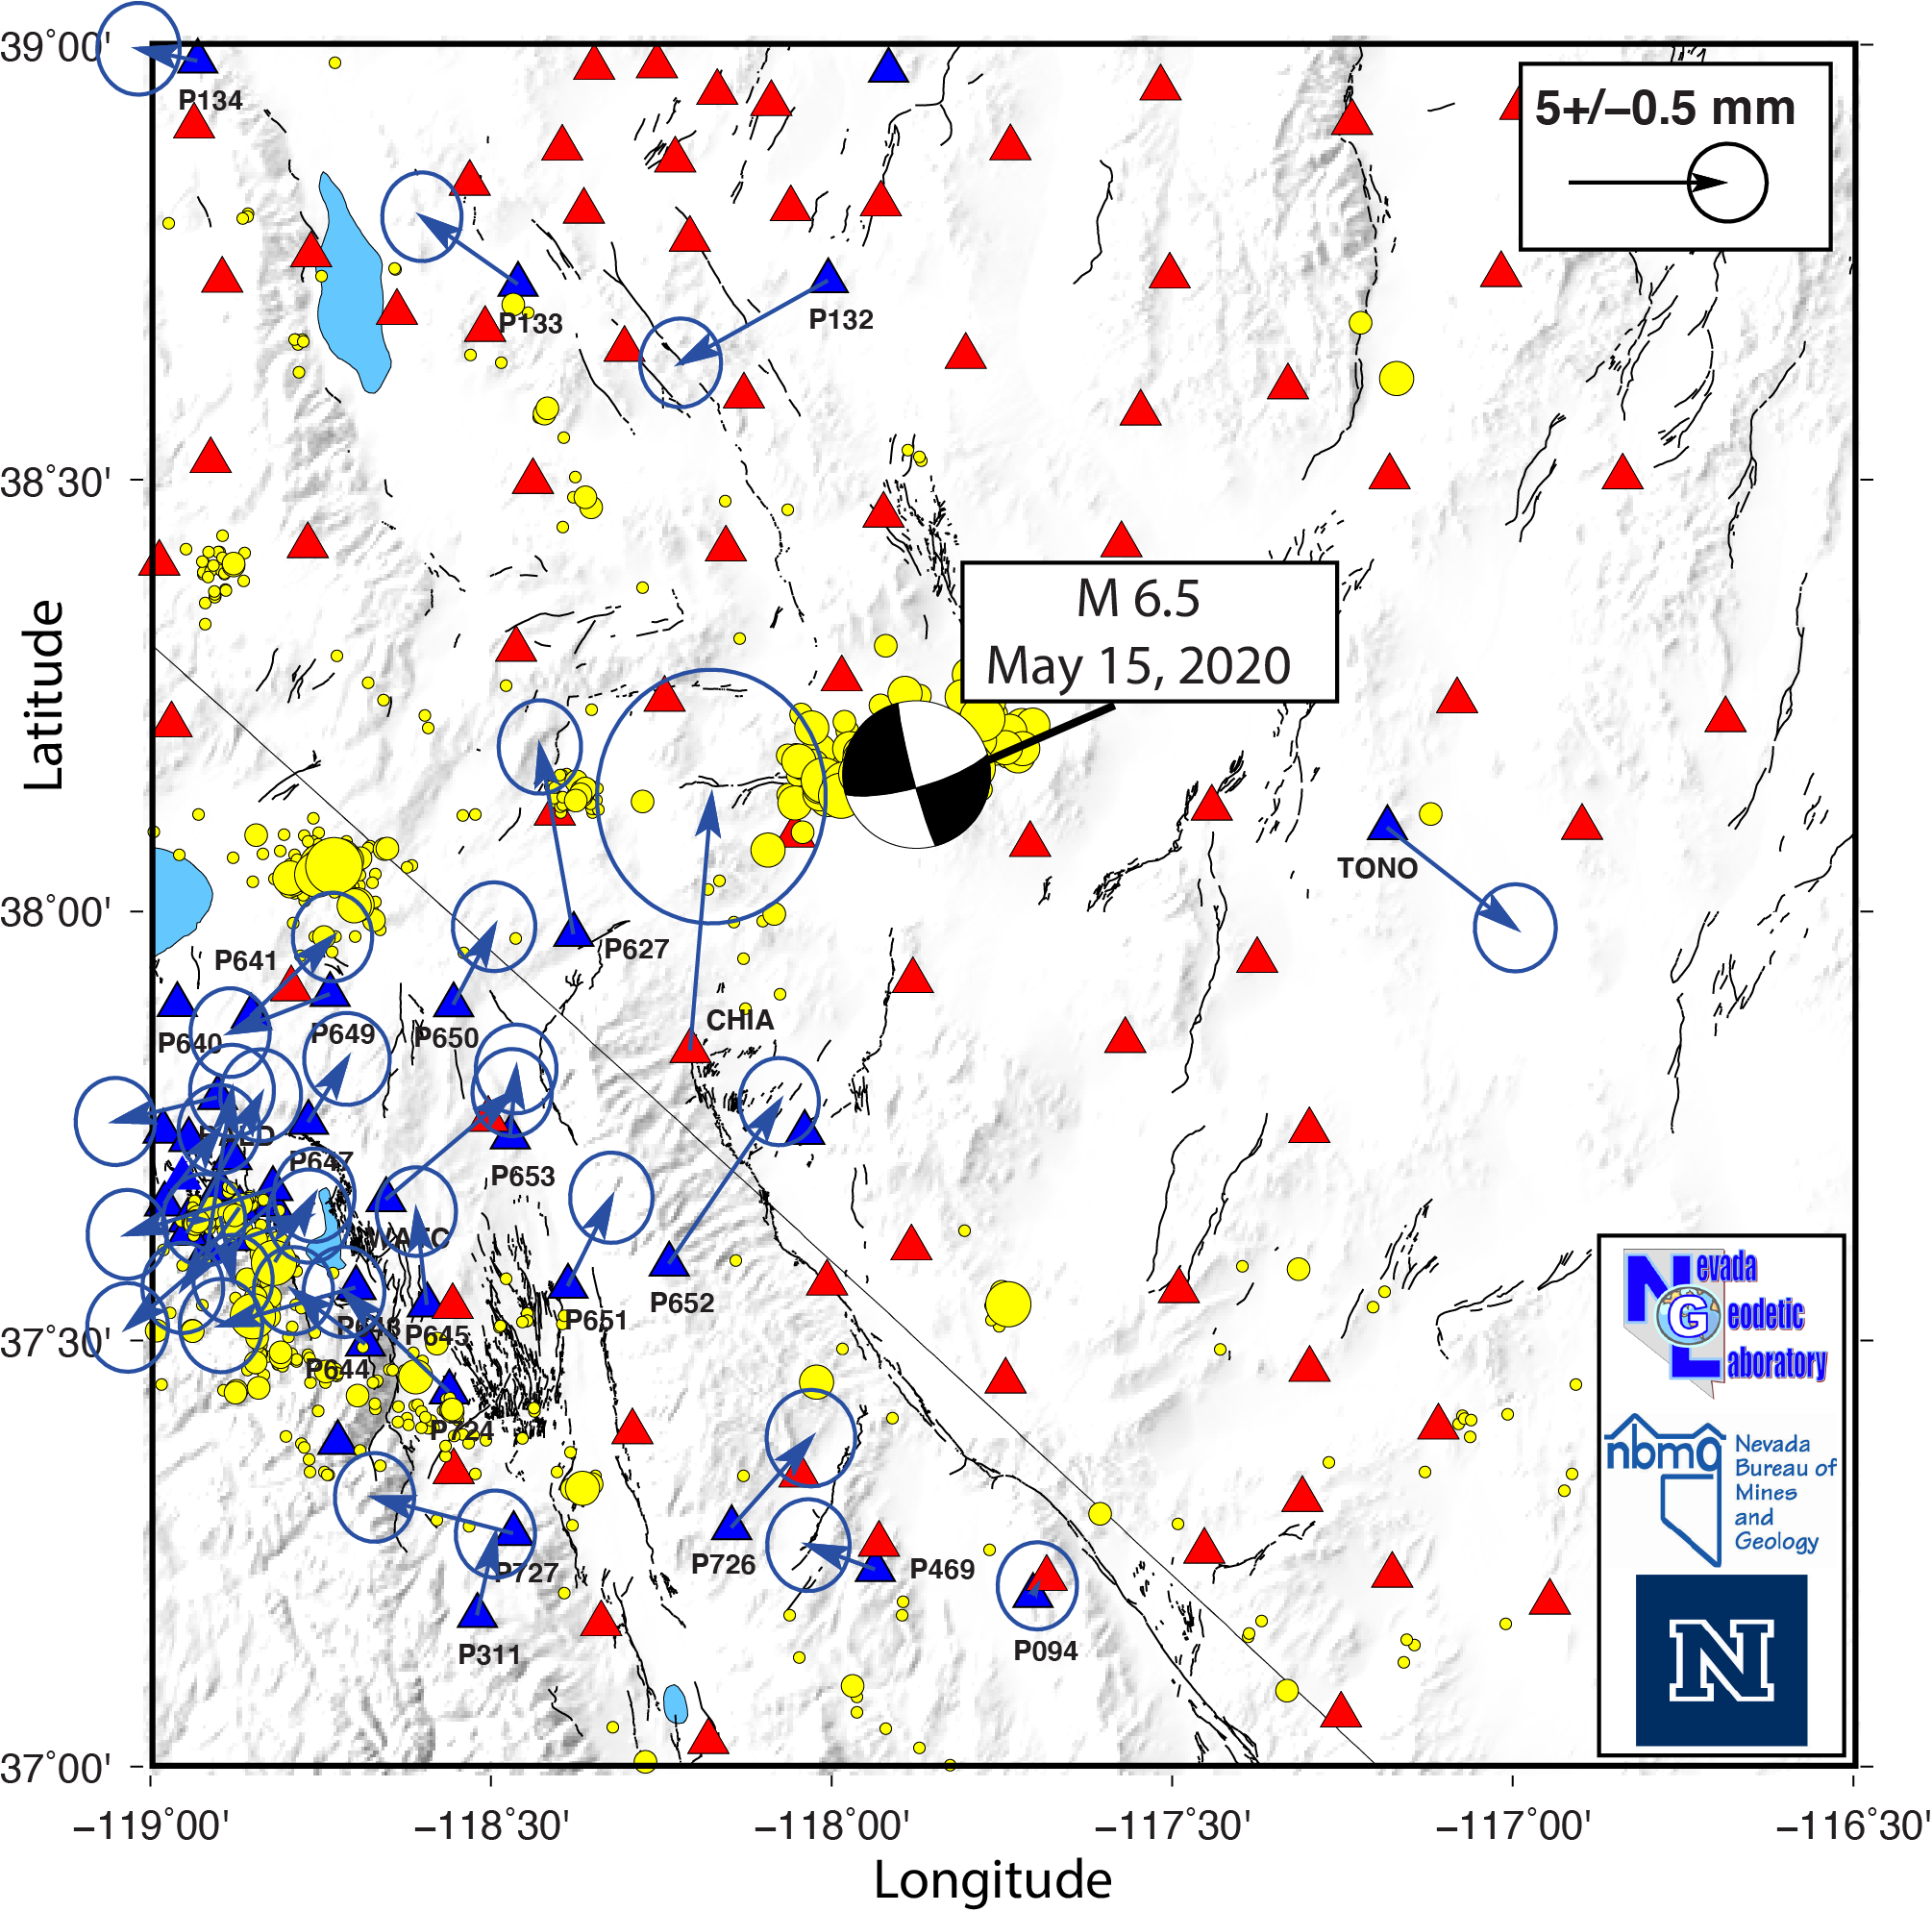
Over the past week data collection on the Monte Cristo Range earthquake has continued. We now have coseismic offsets on 24 MAGNET stations, 15 of which are recording signficant coseismic displacement. Stations in each of the four quadrants of the displacement field have returned data, revealing the systematic horizontal NW-SE extension, NE-SW contraction, characteristic of a strike slip earthquake. An updated offset map and table are provided below. The largest offset so far is at station COLU, on the west side of the Columbia Salt Marsh, which has 145 mm displacement to the northeast. These offsets and some preliminary modeling are now sufficient to favor slip on a left lateral plane striking 78 degrees clockwise from north, similar to what are indicated by InSAR, aftershock, and surface rupture data.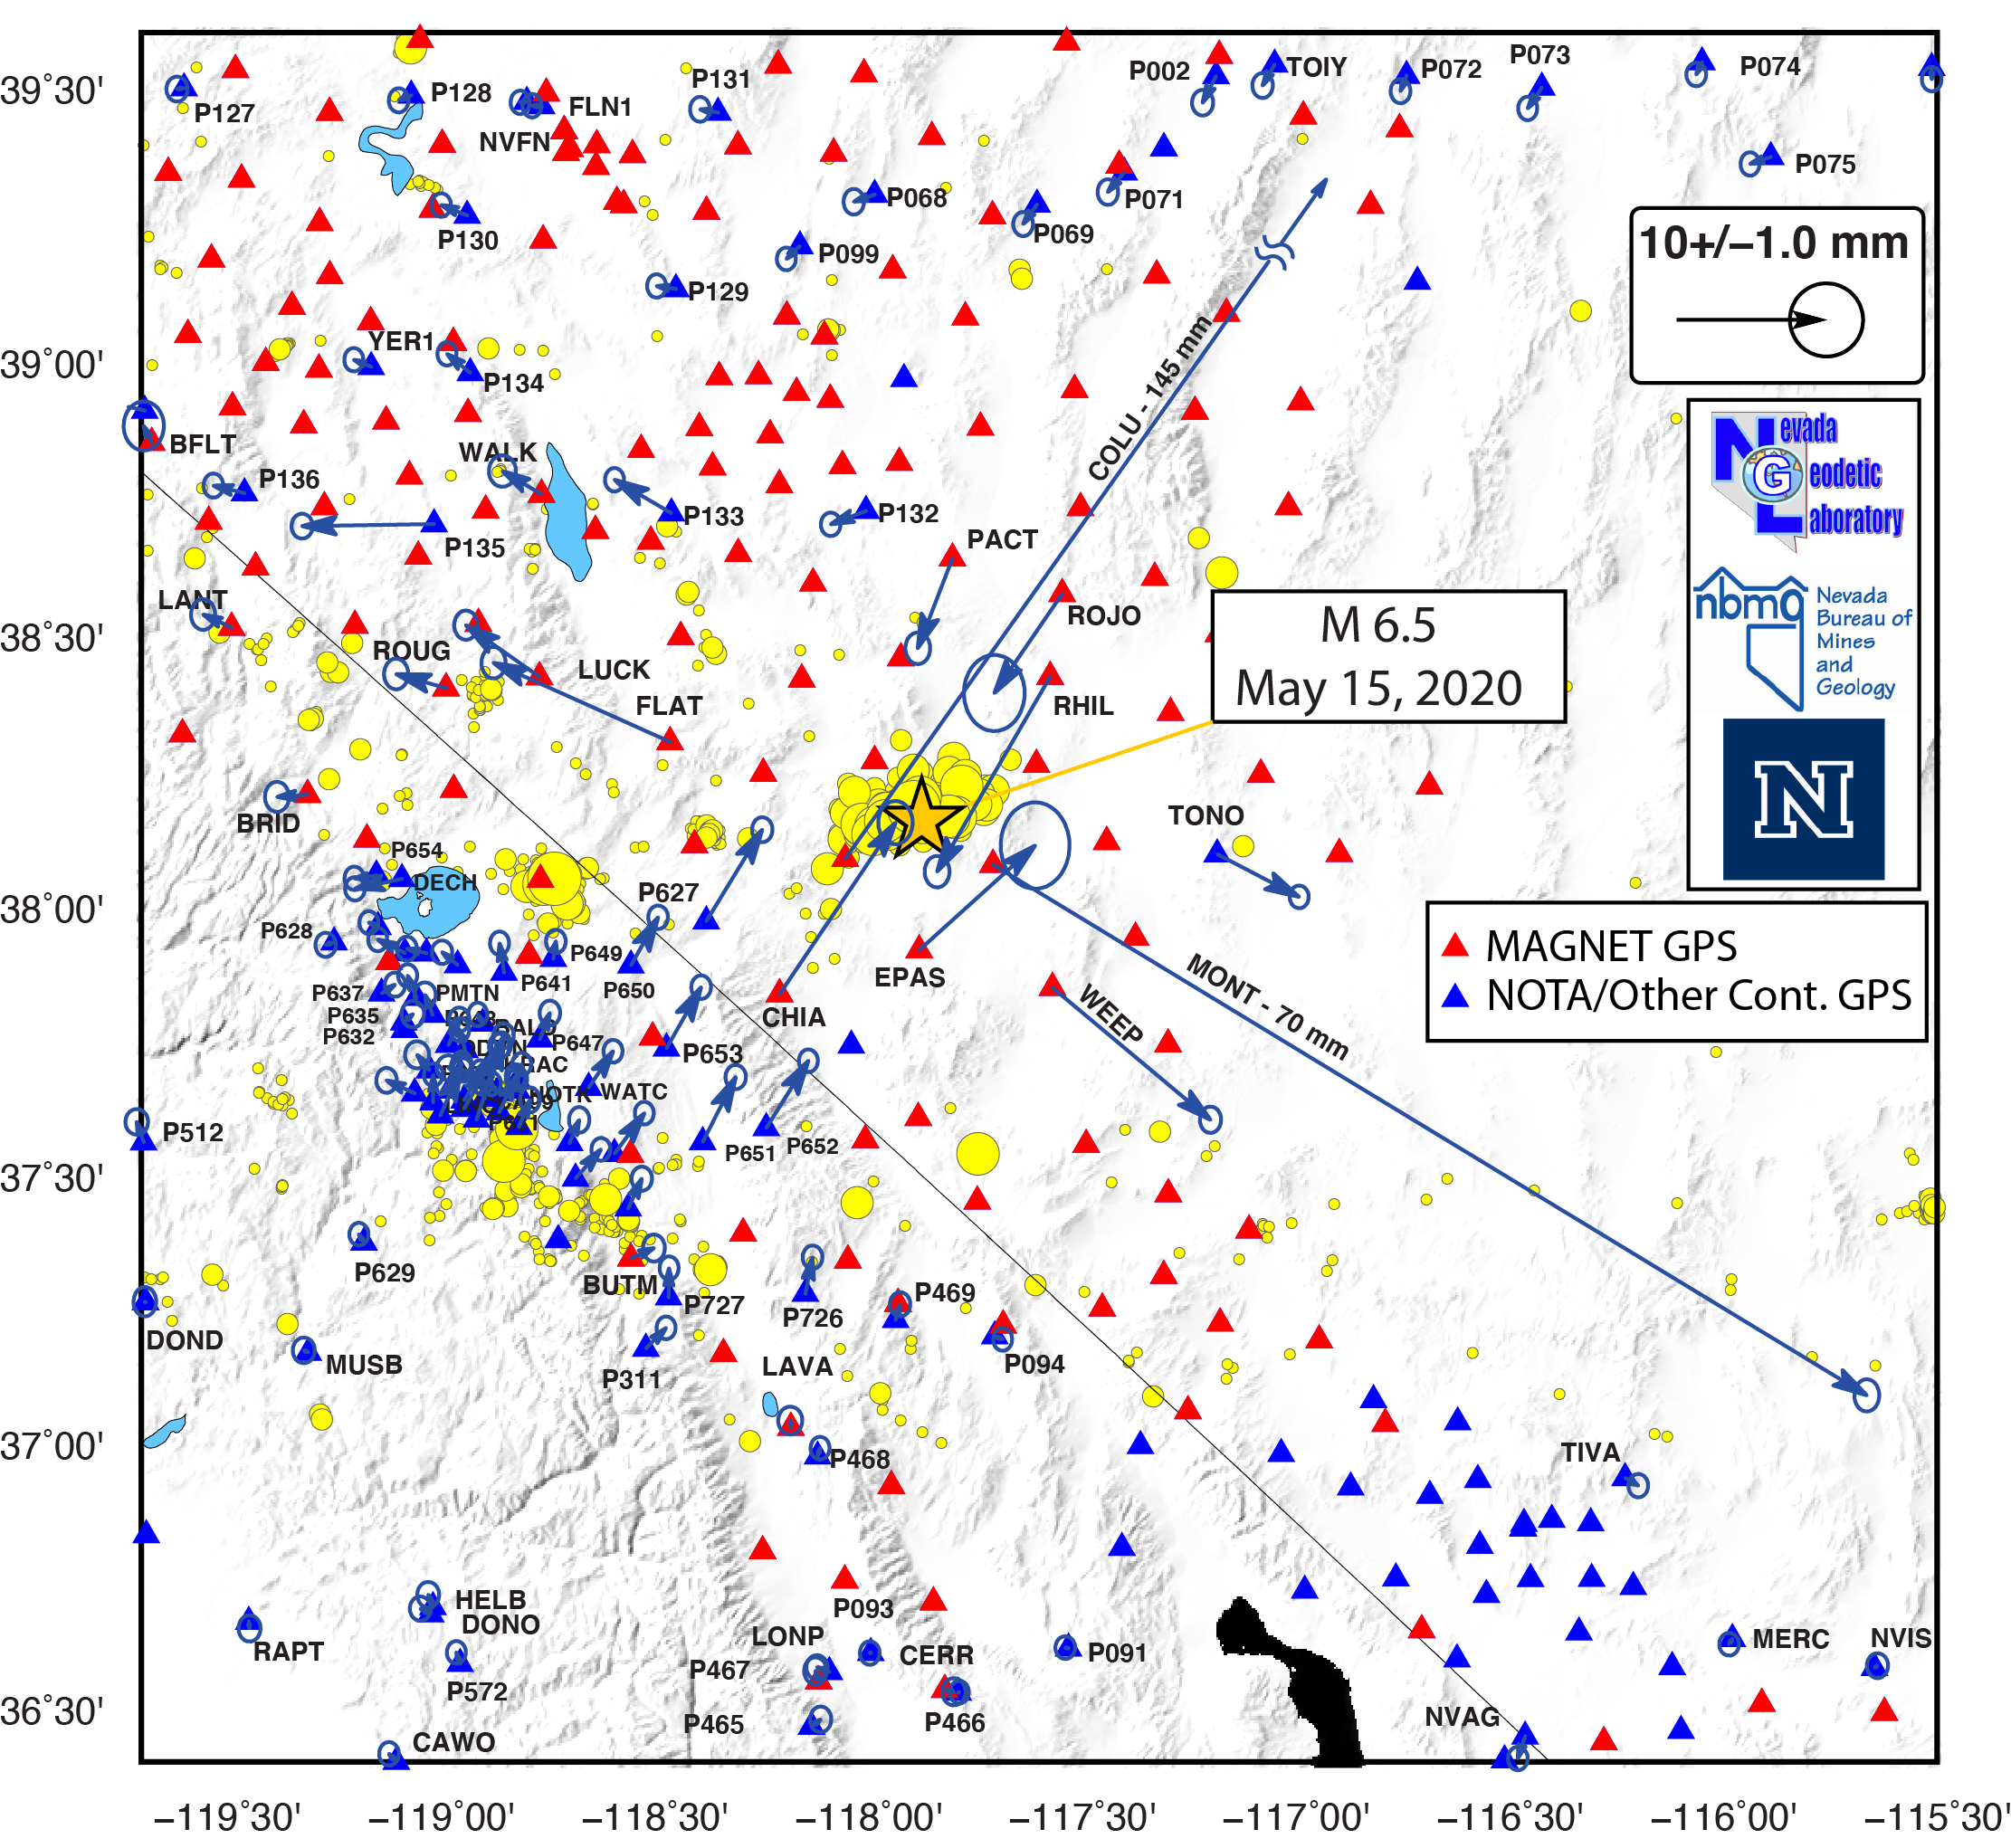
A table of preliminary coseismic offsets is available for download here.
[May 24, 2020] Update on Monte Cristo M6.5 Earthquake
Since the earthquake occurred on May 15, we have gotten some of the first data back from MAGNET stations to our laboratory and processsed. These data are beginning to provide constraint on the near- to medium-field coseismic displacement pattern. Among these were one of the closest stations to the epicenter MONT (17 km from epicenter), that moved 66 mm to the southwest in the event. We also have data back from MAGNET stations CHIA, ROJO, PACT, and RHIL. Data from these stations were used to compute offsets which are plotted below. Data collection in MAGNET continues and will be used to fill in the displacement pattern.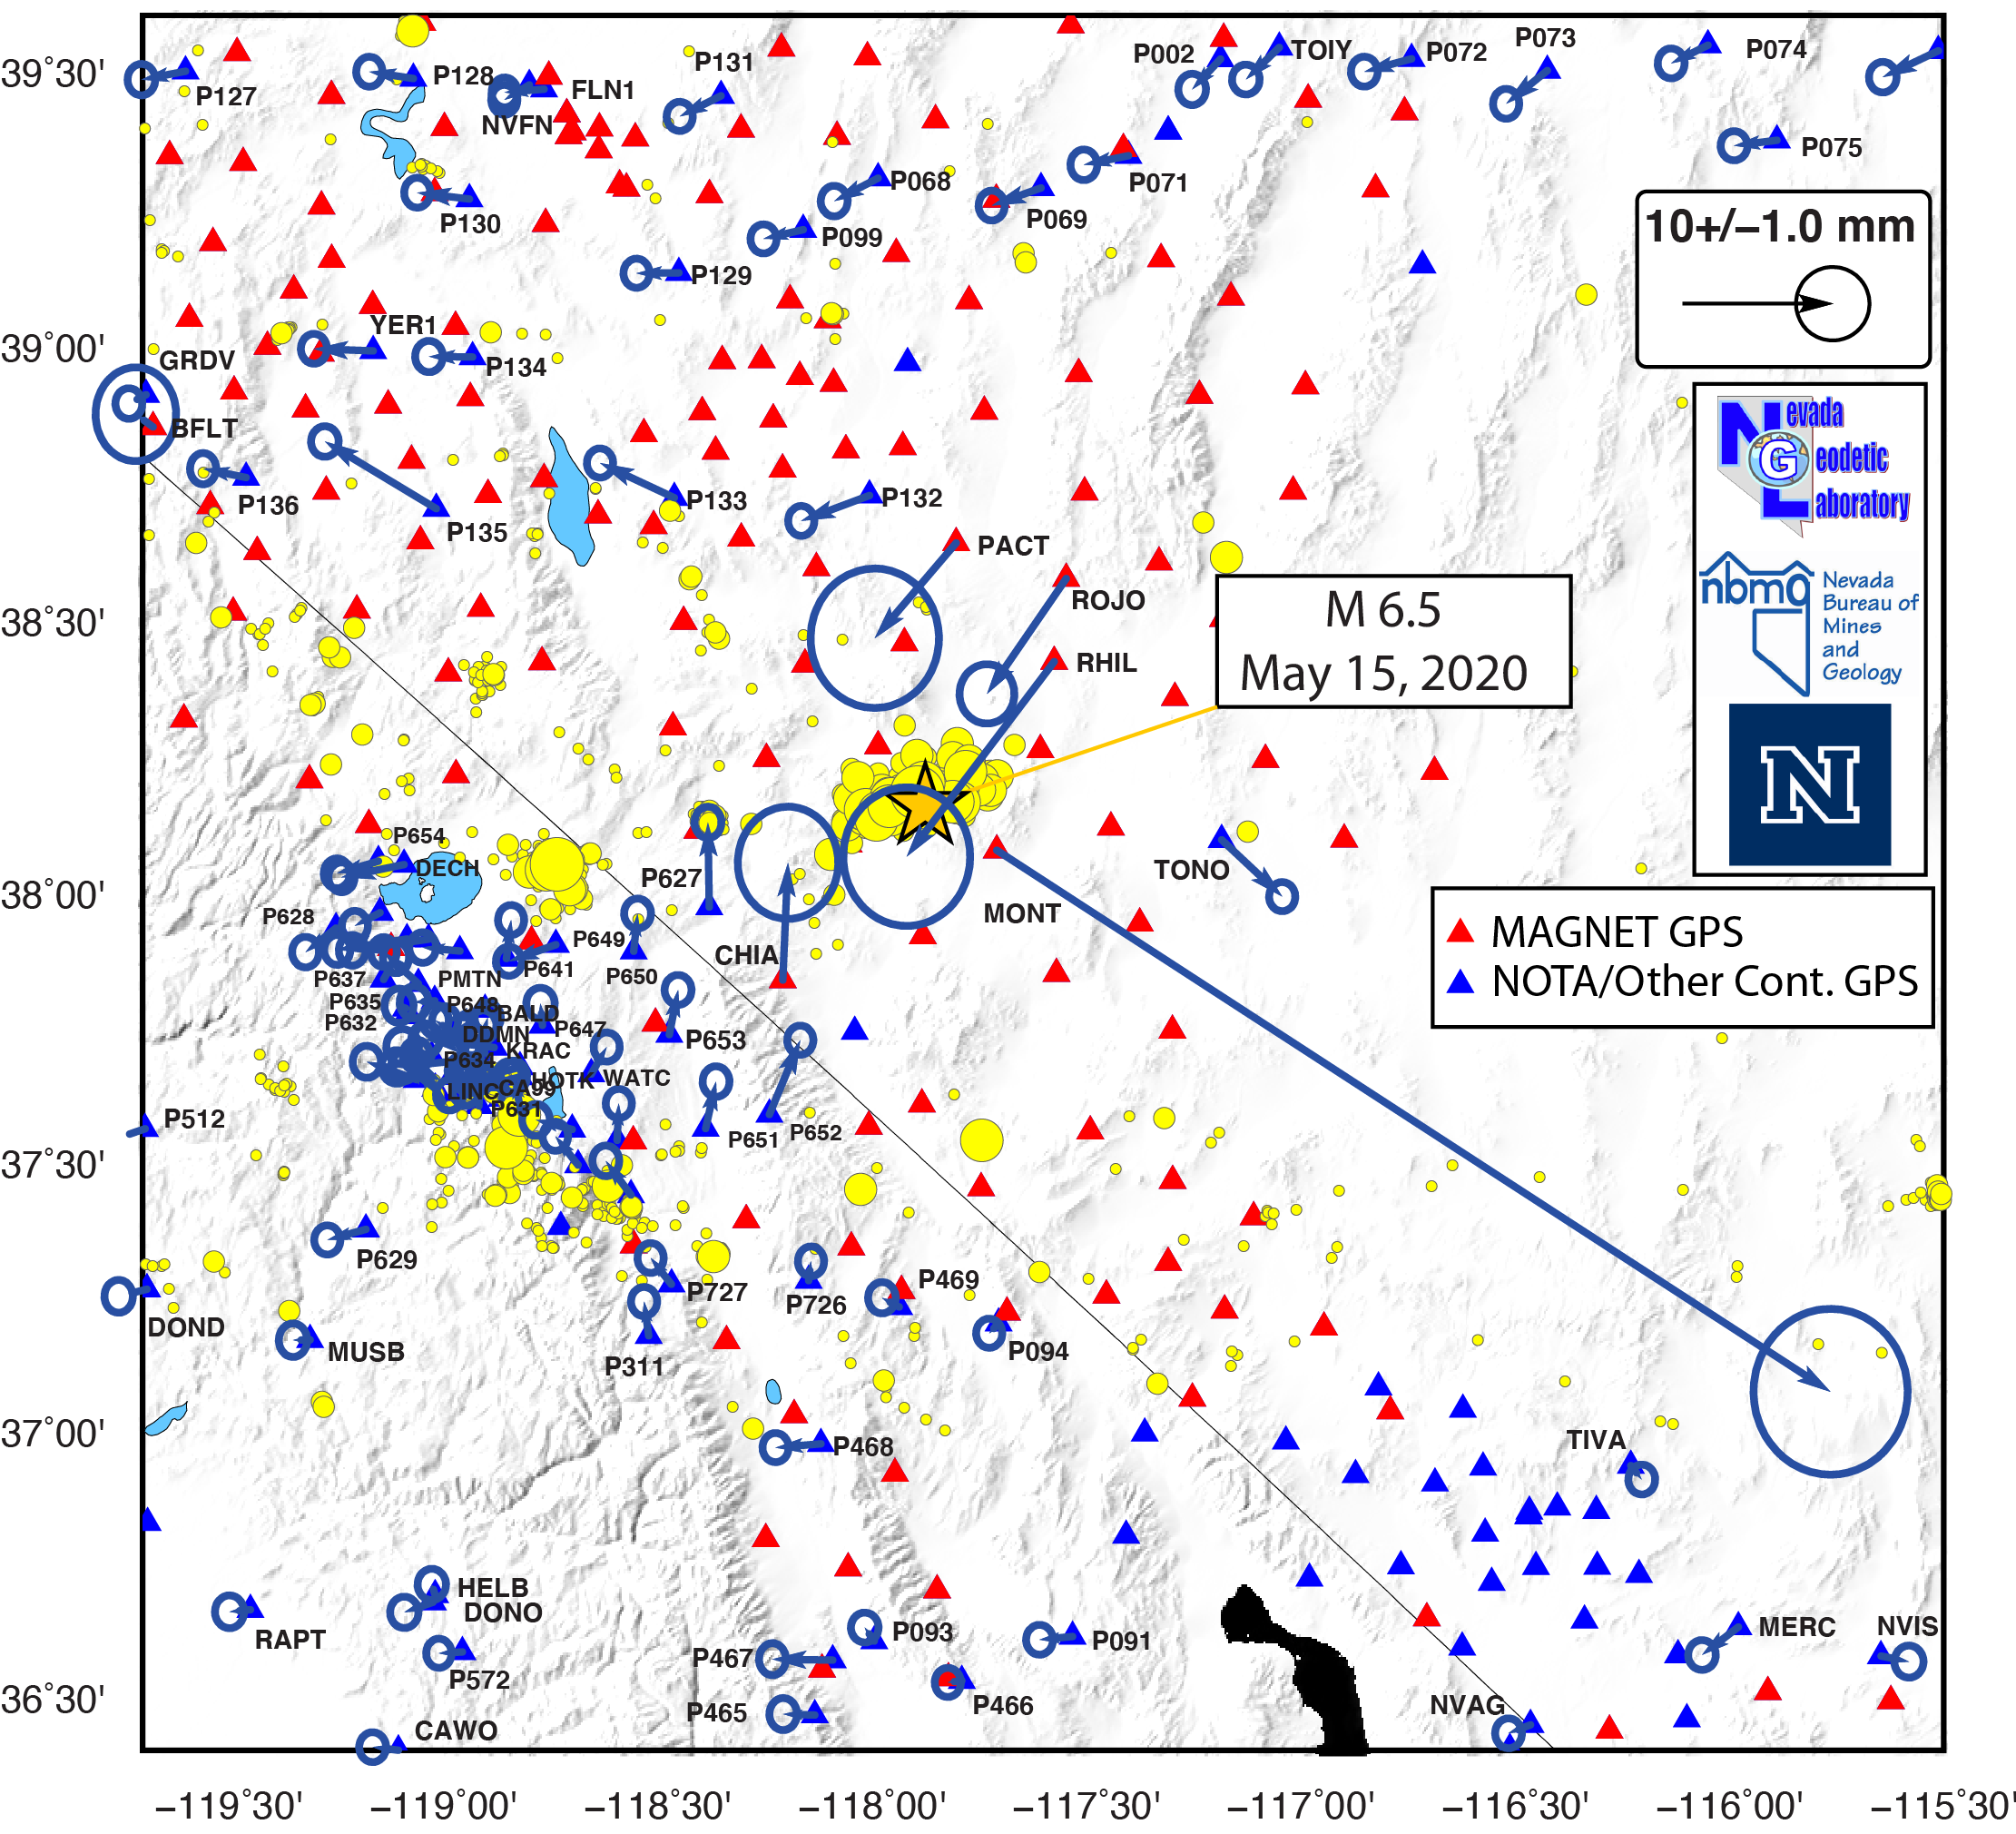
More information on the event can be found at UNAVCO's event response page.
[May 20, 2020] Preliminary Coseismic Displacements from 2020 Monte Cristo Range Earthquake
Data from regional continuous GPS stations of the NSF Network of the Americas (formerly the EarthScope Plate Boundary Observatory), and the USGS California Volcano Observatory are processed at NGL using rapid orbits and products from the Jet Propulsion Laboratory. From these rapidly generated position time series we can make preliminary estimates of the permament coseismic change in Earth shape from the Monte Cristo Range earthquake.Our first look at the pattern of horizontal displacement is shown in the figure below. It indicates horizontal shifts consisent with the seismic moment tensor and aftershock seismicity that suggest a left lateral slip on an east-northeast striking plane. The GPS station TONO at Tonopah, Nevada moved about 5 mm southeast, station P627 near the California/Nevada border moved about 6 mm north. Stations north of the epicenter (P132, P133) moved in the opposite sense, characteristic of coseismic displacement. These data show significant ground movements over 100 km from the epicenter.
NGL is currently gathering data in the part of the MAGNET GPS network (red triangles) nearest the epicenter. As new data roll in over the next days to weeks we will fill in the (likely larger) near-field displacements to complement those from the continuous stations (blue triangles). For one MAGNET station we have already brought data into our lab, processed and released solutions (site CHIA), more will follow.
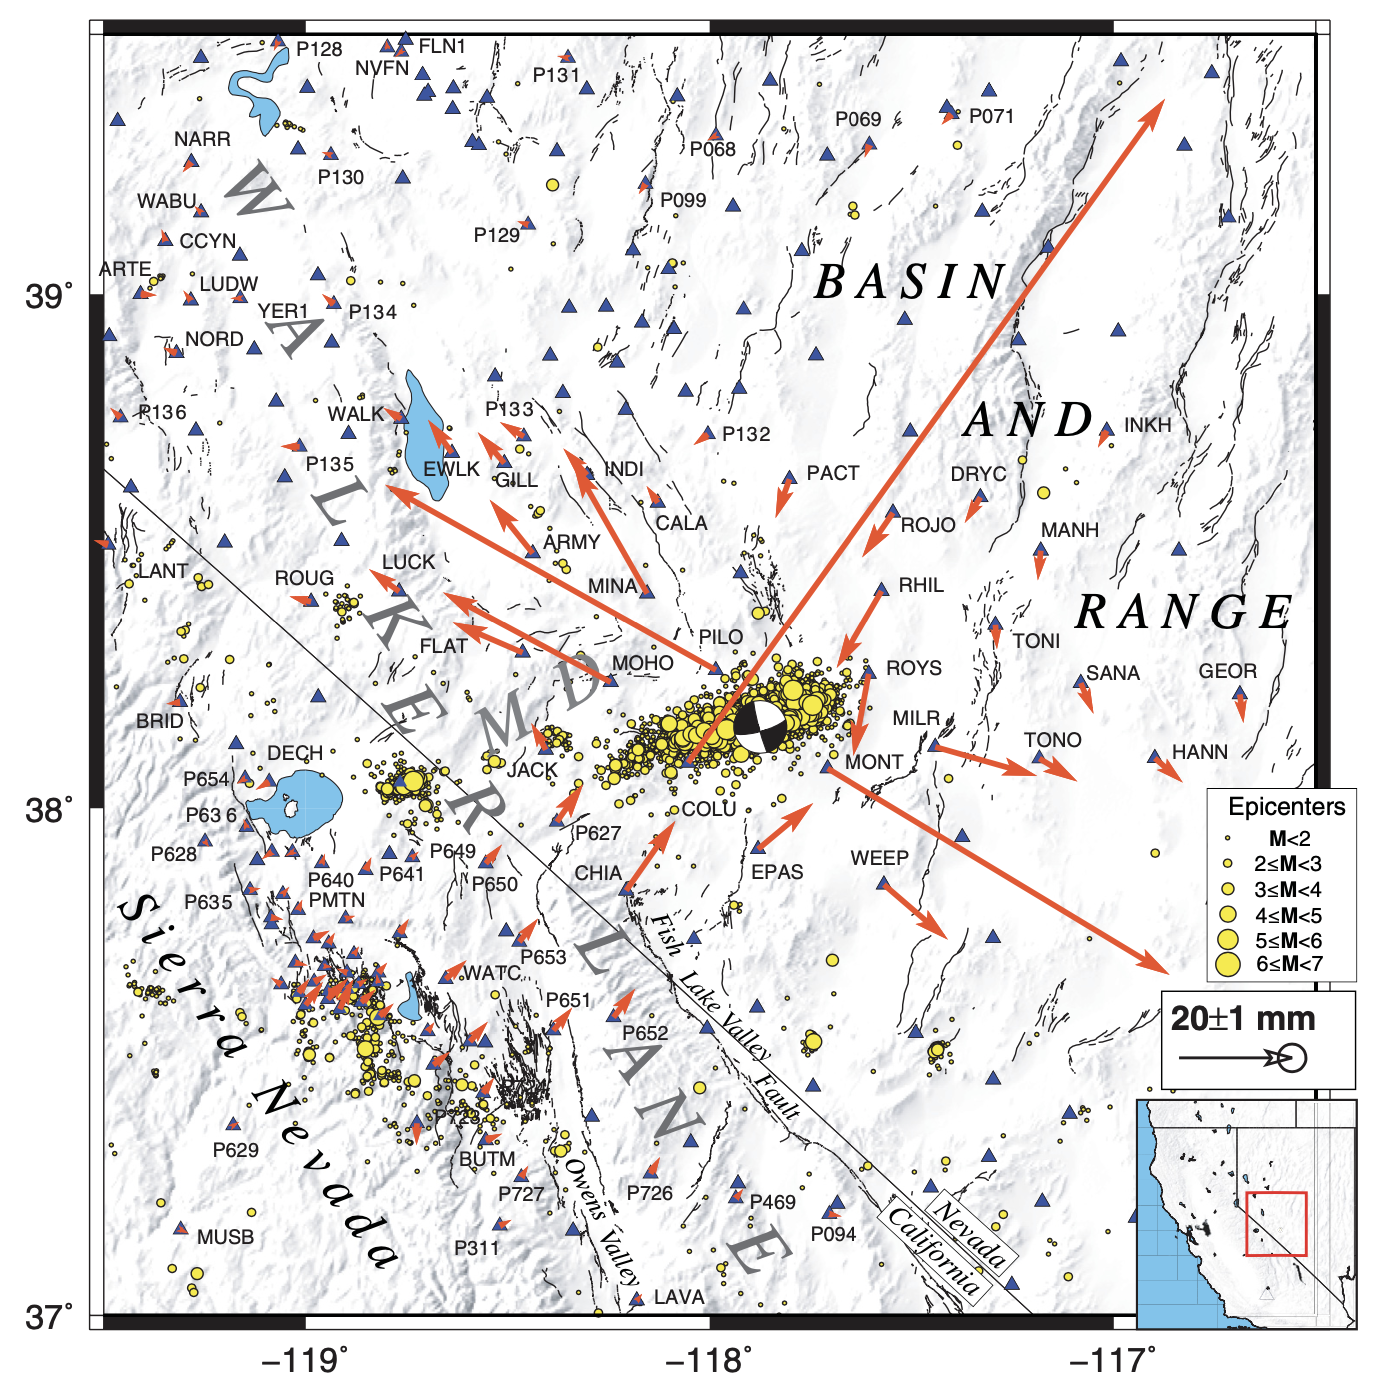
[May 15, 2020] M6.5 Earthquake in the Monte Cristo Range!
The Nevada Geodetic Laboratory is currently deploying GPS at ~30 stations around the epicenter and aftershock sequence of the May 15, 2020 Monte Cristo Range M6.5 earthquake. The map below shows the locations of MAGNET GPS stations, continuous GPS stations from other networks, and seismicity since January 1, 2020, mainshock is shown with a star. The nearest continuous station (P627) is about 50 km distant, whereas MAGNET has about a dozen stations within this radius. The legend indicates which MAGNET stations were already in place at the time of the event, and which stations NGL plans to occupy in the near future. These stations will be visited multiple times in the coming months to download continuous observations that constrain coseismic offset, potential postseismic displacement, and establish monitoring in the event of further earthquakes.The aftershocks of the M6.5 indicate it was likely a left-lateral event whose slip plane can be extrapolated WSW to intersect the swarm east of Mono Lake that has been ongoing for several weeks. The aftershocks also lie along the southern extrapolation of the Benton Springs, Petrified Springs and Gumdrop Hills right lateral strike-slip faults that accommodate northwest-southeast directed Walker Lane shear deformation. The Mina Deflection is a zone with left-lateral faulting similar to the strike described by the cloud of aftershocks.
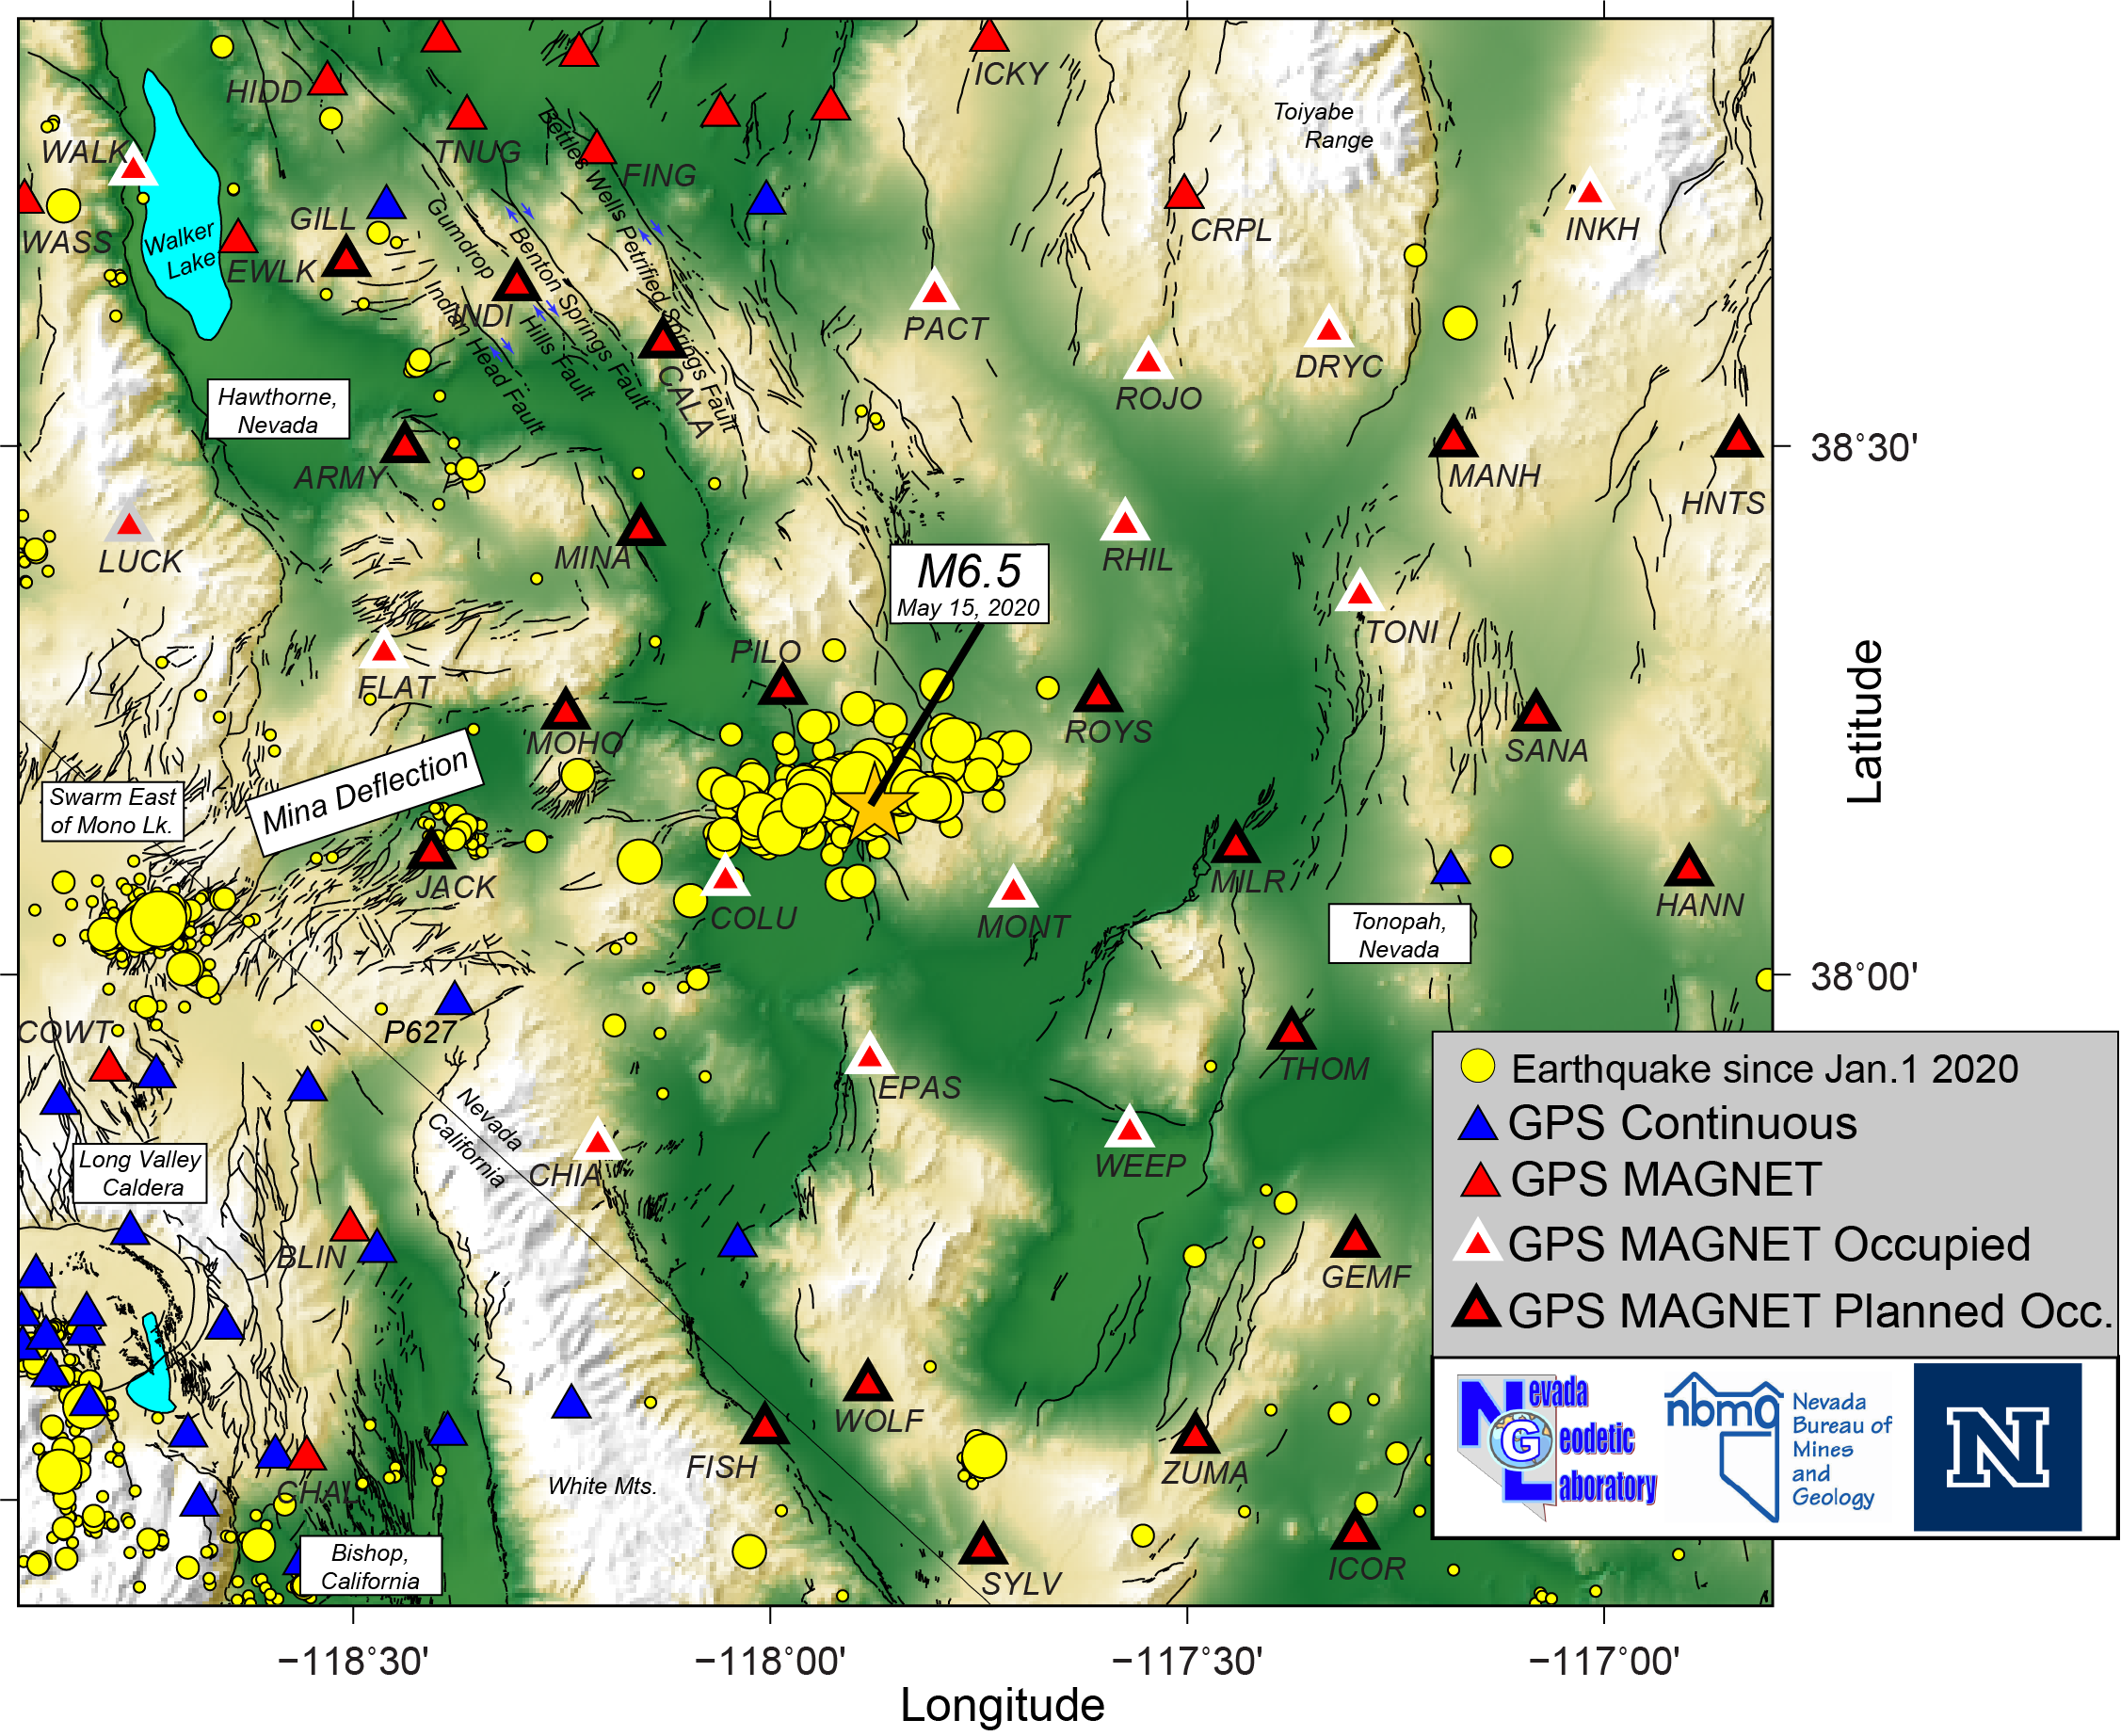
More information is available on the NBMG response page and on the USGS event page. The Nevada Seisloogical Laboratory is continuously posting earthquake updates and is gathering near field seismic recordings.
[February 18, 2020] New article on NBMG's studies of Walker Lane tectonics and earthquakes!
The Nevada Geodetic Laboratory/Nevada Bureau of Mines and Geology is engaged in new and ongoing work on the Walker Lane in the western Great Basin of the United States. Mike Wolterbeek (UNR) summarized these efforts in a new Nevada Today magazine piece on new efforts and technologies that are being used to read the signs of active crustal deformation in the Walker Lane, and the earthquakes it generates.[February 10, 2020] NGL Contributes to New Report from the National Academy of Science
Satellite remote sensing is a primary tool for measuring global changes in the land, ocean, biosphere, and atmosphere. Over the past three decades, active remote sensing technologies have enabled increasingly precise measurements of Earth processes, allowing new science questions to be asked and answered. As the demand for measurement precision increases, so does the need for a precise geodetic infrastructure.Geoffrey Blewitt is co-author on a new report from the National Academy of Science: "Evolving the Geodetic Infrastructure to Meet New Scientific Needs" which summarizes progress in maintaining and improving the geodetic infrastructure. The report identifies improvements to meet new science needs that were laid out in another Academy report "Thriving on Our Changing Planet: A Decadal Strategy for Earth Observation from Space". Focusing on sea-level change, the terrestrial water cycle, geological hazards, weather and climate, and ecosystems, this study examines the specific aspects of the geodetic infrastructure that need to be maintained or improved to help answer the science questions being considered.

[January 30, 2020] M7.7 Earthquake Near the Cayman Islands
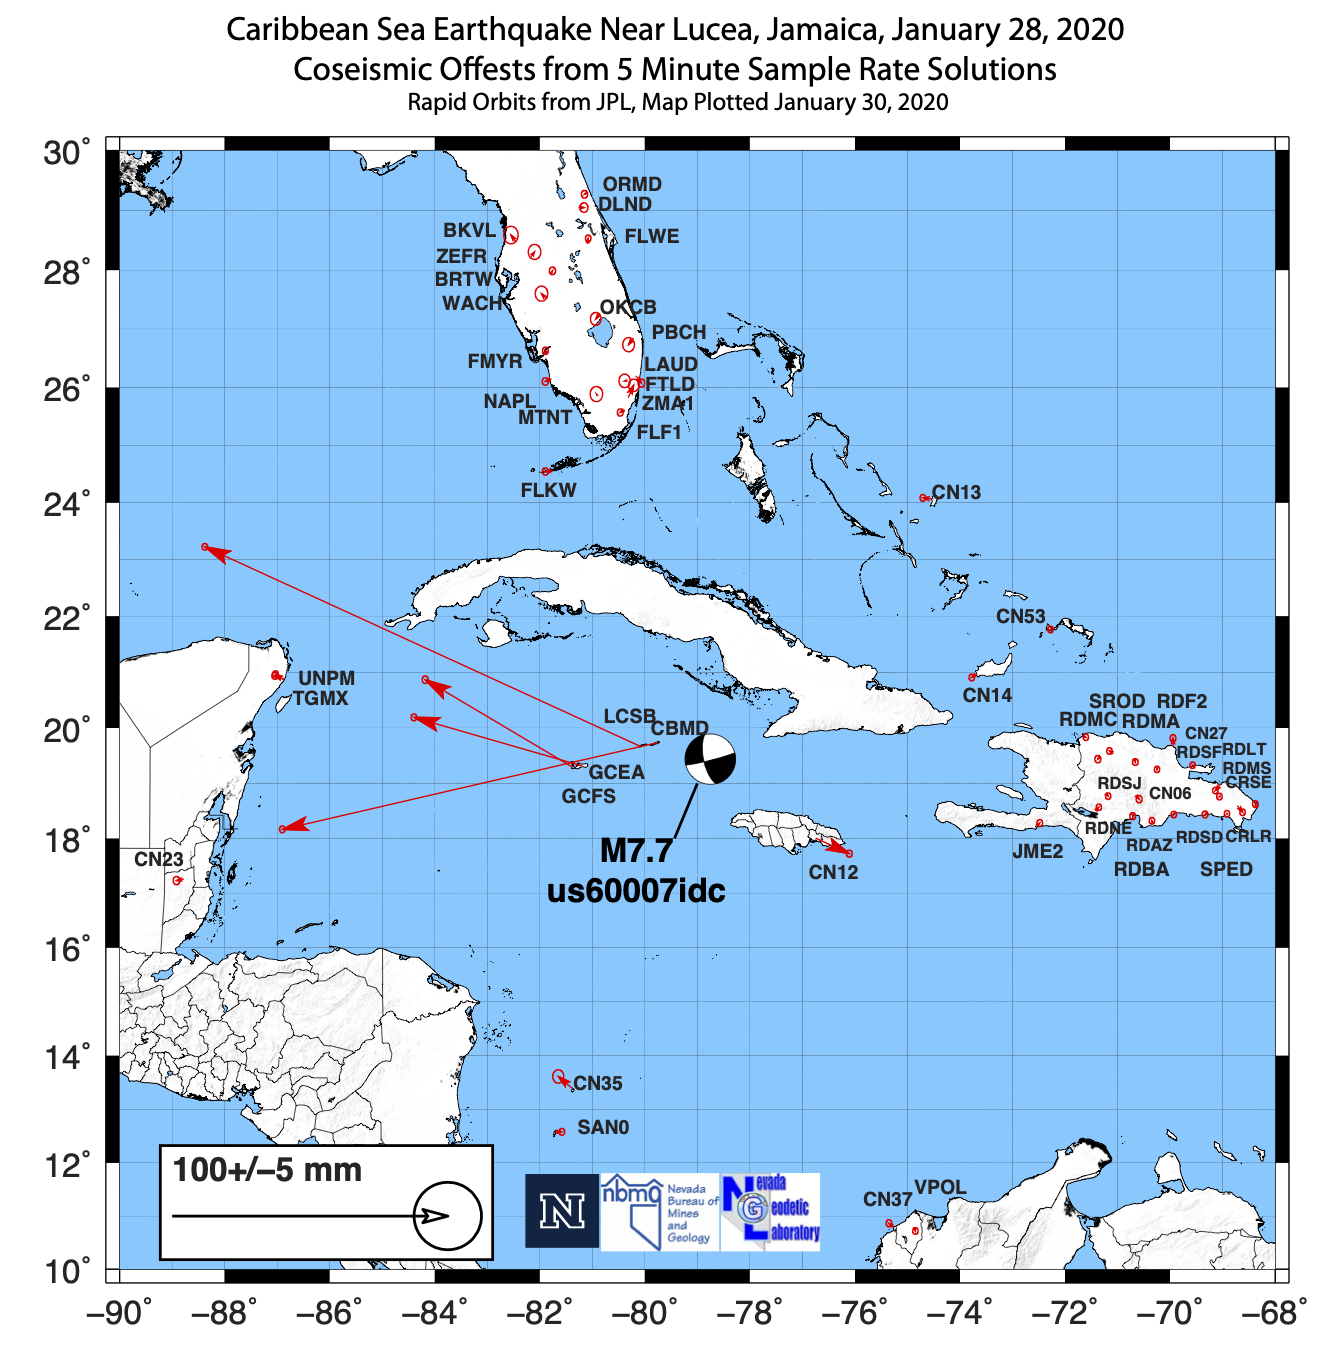
On January 28, 2020 a large and shallow strike-slip earthquake occurred at the northern boundary of the Cayman Trough on the Caribbean Sea floor. The event epicenter was between the Cayman Islands, Cuba, and Jamaica, with shaking felt as far away as Florida. GPS data show that stations on the Cayman Islands and Jamaica moved in a fashion consistent with left lateral slip on the fault. The maximum displacement observed was at the UNAVCO-operated COCONet station LCSB which moved over 170 mm to the northwest.We used rapid orbits from JPL and 5 minute sample rate time series to compute preliminary coseismic offsets. These displacements are depicted on the map below with red vectors for 52 stations. Below the map is an example 5 minute sample rate time series for station LCSB that shows with the red line segment the time interval used to select data to estimate the offsets.
[January 15, 2020] Damaging earthquake sequence in Puerto Rico
A sequence of earthquakes struck southwest Puerto Rico between January 6 and January 11, with at least 8 events over M 5.5 and a main shock with M 6.4. This event poses a challenge for earthquake geodesy because of the difficulty in separating multiple events per day while using precise 24 hour solutions. We simplified our coseismic displacement estimation by solving for a single offset per station on the day of the main shock, January 7, from 24 hour sample rate GNSS solutions using rapid orbit products from the Jet Propulsion Laboratory. The largest offsets observed were over 20 mm, at the NSF-supported Network of the America's station P780, operated by UNAVCO and processed by NGL (station page for P780).
The map was made using this a table of preliminary coseismic offsets.
[November 28, 2019] All NGL GPS Holdings Reprocessed and Available in IGS14!
Newly updated GPS data products are now available our online system. All data in the NGL holdings have been reprocessed with the new and improved GipsyX v1.0, software released this year. The new results use improved models including the VMF1 mapping function and nominal troposphere, elevation weighted observations, and higher order ionospheric calibrations, improved JPL Repro 3 orbits, and the latest global reference frame IGS14. Also, time series and MIDAS velocities are now available in 25 tectonic plate fixed reference frames which adjust the horizontal trends only. New station pages have been developed that present these solutions in IGS14, plate fixed reference frames and detrended time series.Thanks for your patience as we work out the few remaining issues with the web pages.
Happy surfing and Happy Thanksgiving!
[July 7, 2019] Update on M7.1 Ridgecrest Earthquake
Below is an image of the coseismic displacement of the Earth surface that occurred during the M7.1 earthquake near Ridgecrest on July 5, Pacific Time. The maximum movement of a GPS station was over 500 mm, or about half a meter at station P595, about 20 km east of the epicenter. Notably, most of southern California moved because of the event to some degree, though in most places this movement was small, under 10 mm. Similar to the previous M6.4 event on July 4, the movements are approximately east-west extensional, and north-south contractional. This is consistent with right lateral slip on a northwest striking fault plane.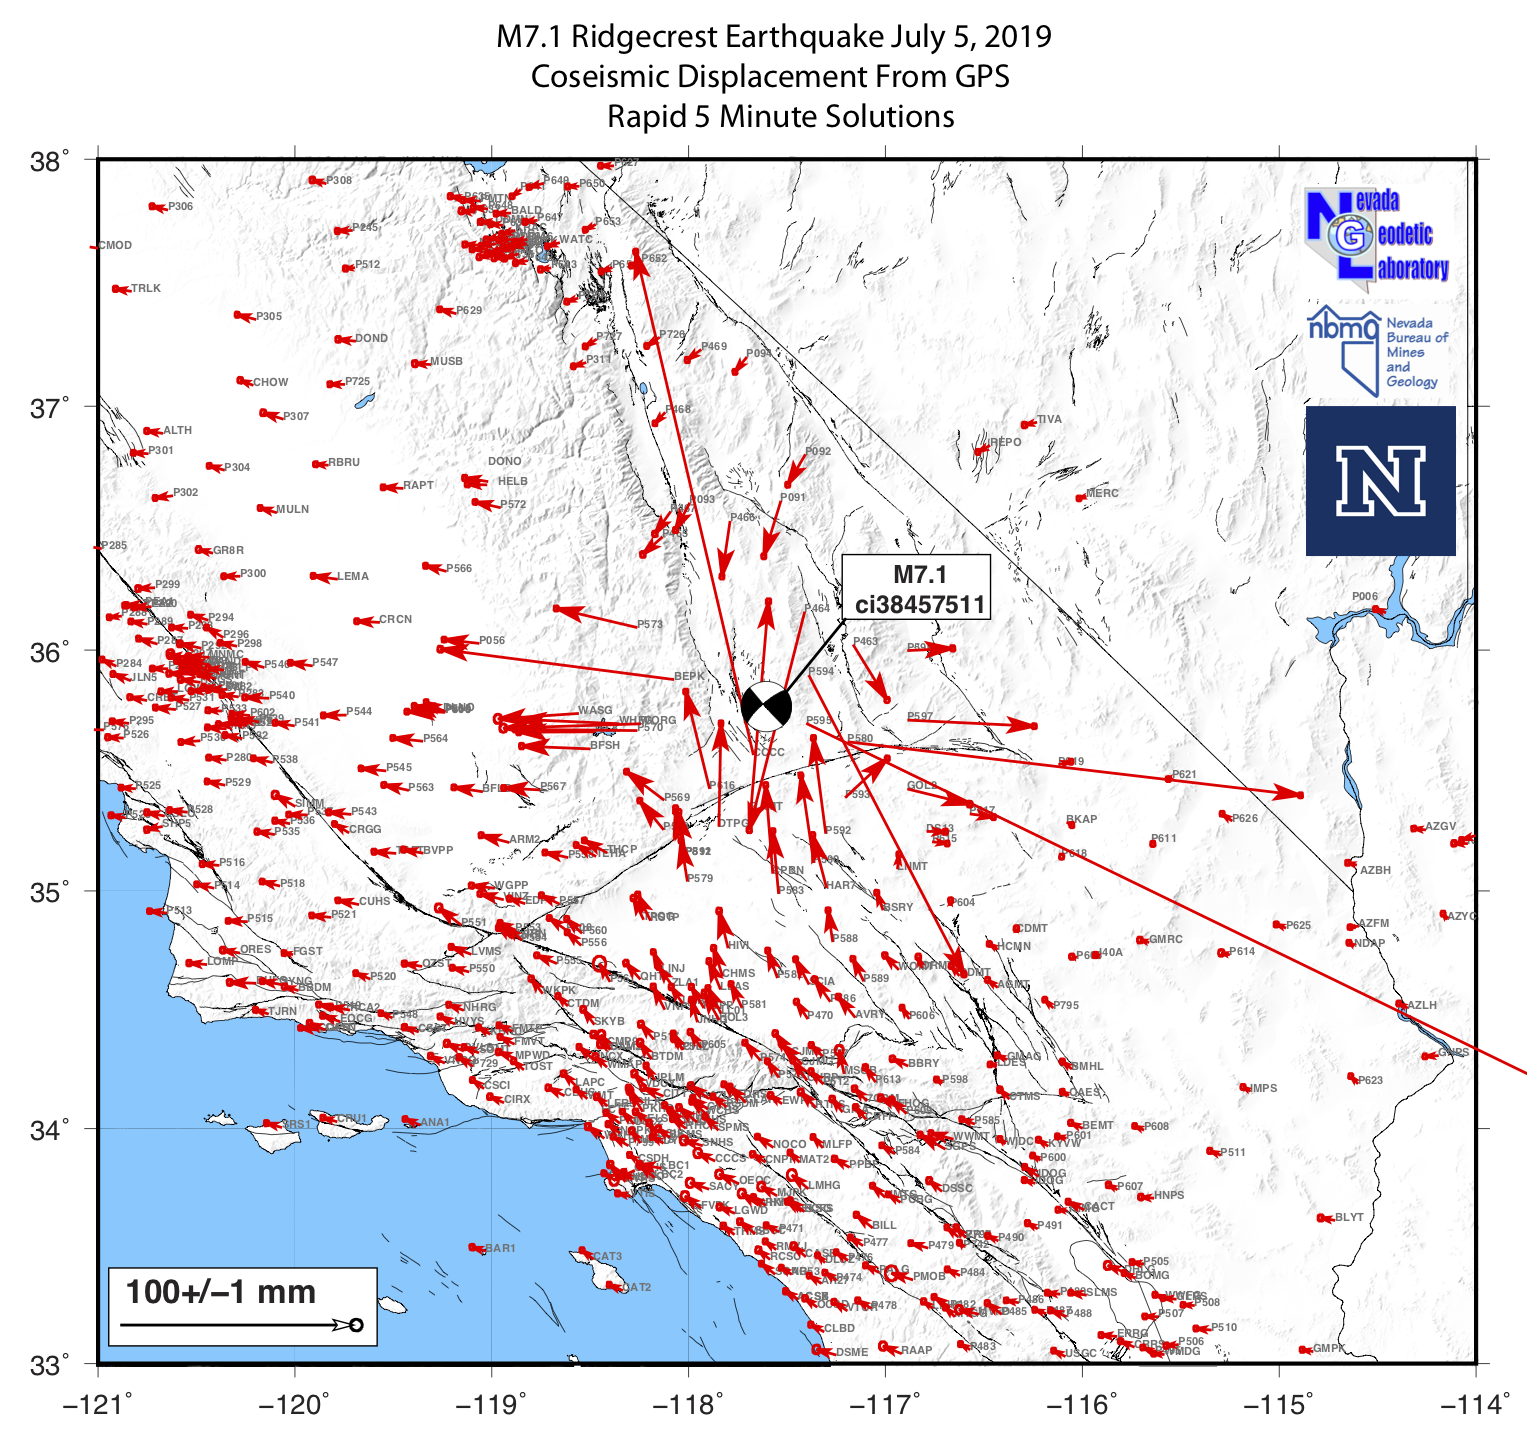
These data are from several geodetic networks, the largest of which is the Network of the Americas (NOTA), a core component of the NSF Geodetic Facility for the Advancement of Geoscience (GAGE).
The plot is made from this table of preliminary offsets.
[July 6, 2019] M7.1 Earthquake near Ridgecrest, CA
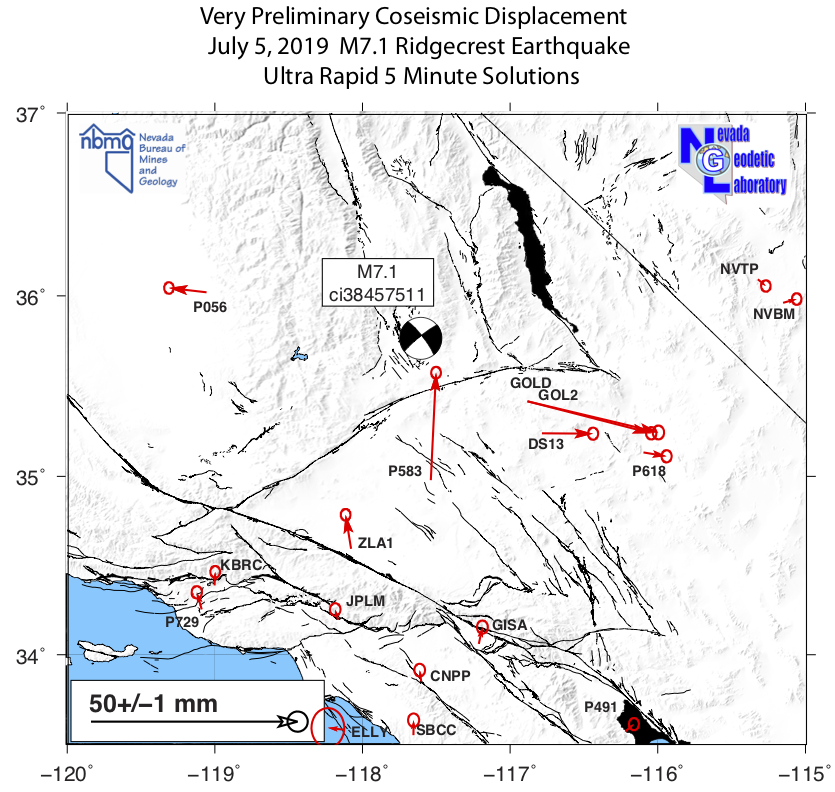
On July 5, one day after the July 4 M6.4 earthquake, an M7.1 event near Ridgecrest, CA generated much larger permanent movement of the Earth surface. For a subset of continuous GPS stations, NGL processes data using JPL's ultra-rapid orbit products, allowing us to calculate coseismic offsets for a few stations on the same day as the earthquake. Results of this ultra rapid analysis are shown below.We can already see from these early results that the movements are much larger and extend a greater distance than those from yesterday's event. For example, the GPS station GOLD (which is over 70 km southeast of the epicenter) moved ~31 mm, much greater than it moved during yesterday's earthquake (see previous post below). Today's result shows that significant movement extends at least 150 km from the epicenter, and may reach south of the San Andreas Fault. The pattern of the displacements gives us confidence that what we are seeing is from the earthquake. The movement was approximately east-west extensional, and north-south contractional, consistent with the active tectonic strain rate field. The movement is also consistent with the earthquake moment tensor, which along with seismic data, indicate a right lateral strike slip event on an approximately northwest striking plane.
We expect to have results for a much larger number of GPS stations soon.
[July 5, 2019] Fourth of July M6.4 Earthquake Near Ridgecrest, California
The map below shows preliminary coseismic horizontal vector displacements for the M6.4 earthquake that occurred near Ridgecrest, California yesterday. The 5 minute sample rate time series were obtained using rapid orbits from the Jet Propulsion Laboratory. Maximum displacements are approximately 10 cm, describing east-west extension and north-south contraction, consistent with a strike-slip event. Four character codes indicate GPS station names. Vectors have 95% confidence ellipses on their tips.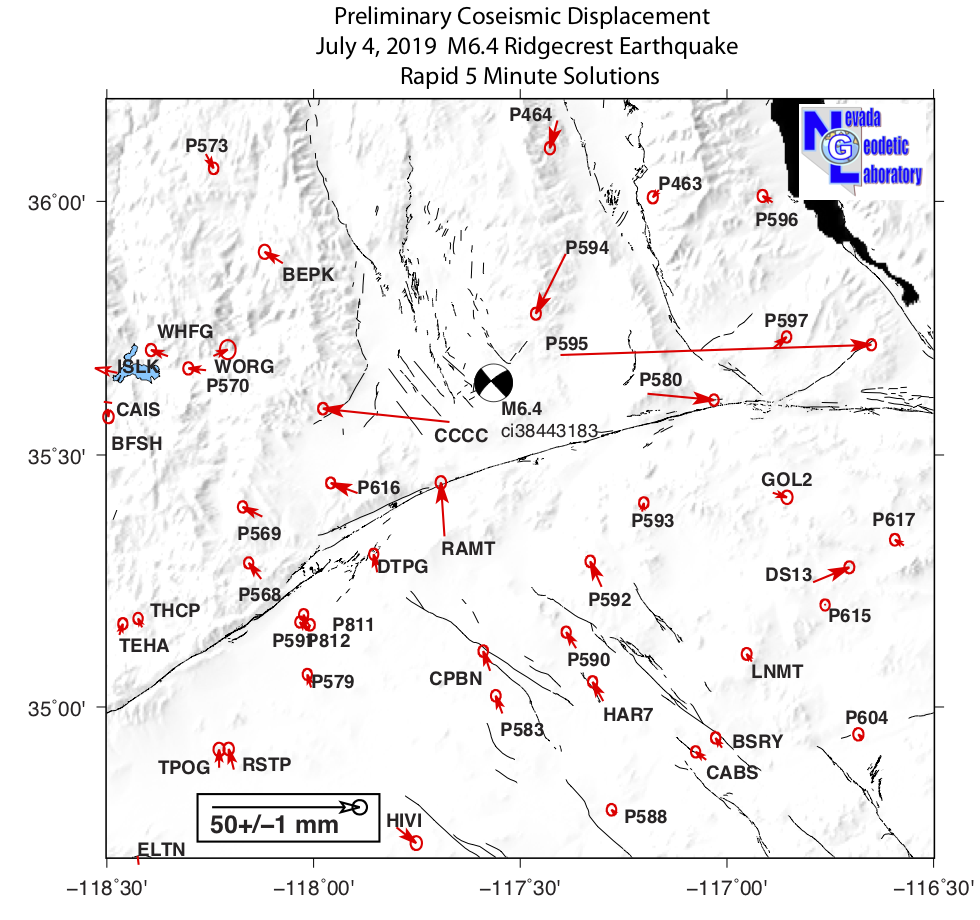
The plot was made using this table of preliminary coseismic offsets.
[June 3, 2019] Possible small displacements observed in the Peru M8.0 earthquake
On May 26 an M8.0 earthquake occurred beneath northern Peru. The USGS report on the event indicated the focus was very deep (>110 km) and thus less surface displacement is expected compared to a shallow event. We looked at GPS data from stations within 1585 km of the event and found that stations to the east of the epicenter have a systematic eastward movement, all under 4 mm. The individual offsets are near the uncertainties, but taken together the mean eastward motion may be significant. These results have been rapidly determined, and more more definitive results will be available when more data has been collected after the earthquake.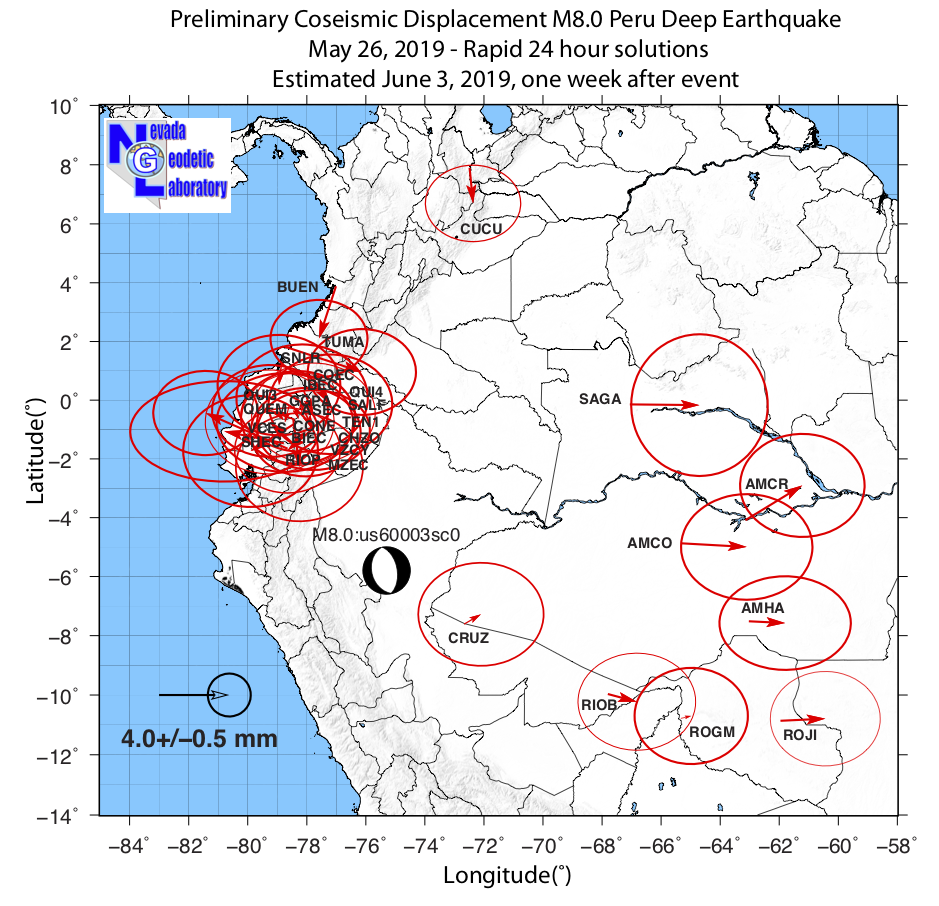
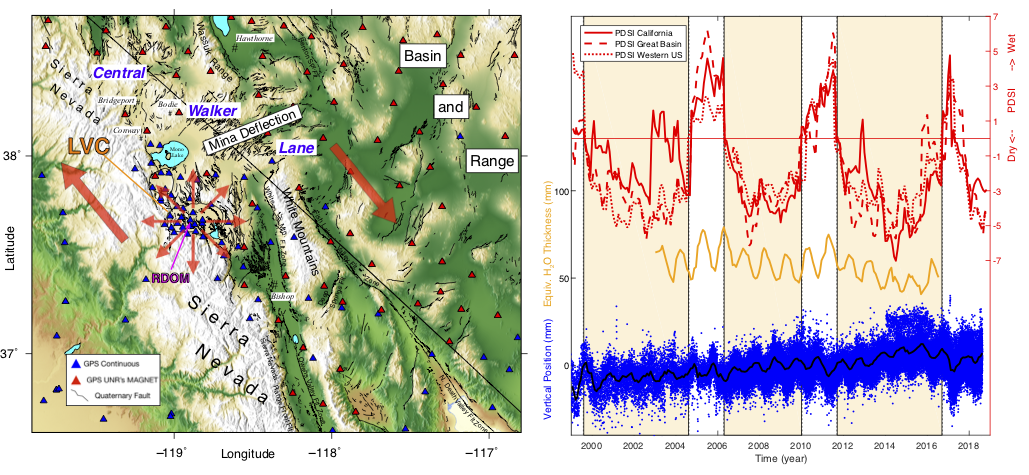
[May 24, 2019] New Paper! Drought-Triggered Inflation and Earthquakes at Long Valley Caldera
In a new study we have explored how recent drought periods in California influence the timing of Long Valley active caldera inflation near the city of Mammoth, California. The study uses GPS and seismic data to show how uplift of the Sierra Nevada and magmatic inflation at Long Valley accelerated when the drought initiated in late 2011. The subsequent inflation changed the distribution of active tectonic strain rates in the adjacent central Walker Lane, east of the Sierra Nevada, effecting seismicity rates. Earthquakes occurred more frequently in places where the geodetic strain rates increased, suggesting that hydrological surface loading (e.g. from changing levels of aquifers, snow and lakes) affects the magmatic system in ways that subsequently influence earthquake occurrence. The study captures in new detail the complex links between between climate, active volcanos and earthquakes in eastern California and Nevada.The work is a collaboration between the Nevada Bureau of Mines and Geology and Department of Mathematics and Statistics in the UNR College of Science. The study appears as a new accepted article in the Journal of Geophysical Research - Solid Earth.
Hammond, W.C., C. Kreemer, I. Zaliapin, G. Blewitt, 2019, Drought-triggered magmatic inflation, crustal strain and seismicity near the Long Valley Caldera, Central Walker Lane, Journal of Geophysical Research - Solid Earth, 124(6), p. 6072–6091, https://doi.org/10.1029/2019JB017354.