
NEWS ARCHIVE
[December 1, 2018] Anchorage Earthquake Coseismic Displacement
Yesterday morning, November 30, 2018, an M 7.0 earthquake struck directly beneath Anchorage, AK causing landslides and widespread shaking. The event was over 40 km deep with a normal slip style mechanism causing some to suggest it was result of a tensional earthquake in the subducting oceanic lithosphere of the Pacific Plate. Here we show that coseismic horizontal displacements were about 2 cm in Anchorage. We obtained these offsets from 5 minute sample rate solutions calculated with JPL rapid orbit products. The horizontal vectors (Figure below) show ESE displacement both east of, and west of, the epicenter. The distance from Anchorage over which displacements are significant extends further east than west. They also show north-south contraction, with stations north of the epicenter moving south, and stations south of the epicenter moving north. Together these observations suggest that the slip occurred on the shallower, down to the east, nodal plane obtained from the seismic data and presented by the USGS.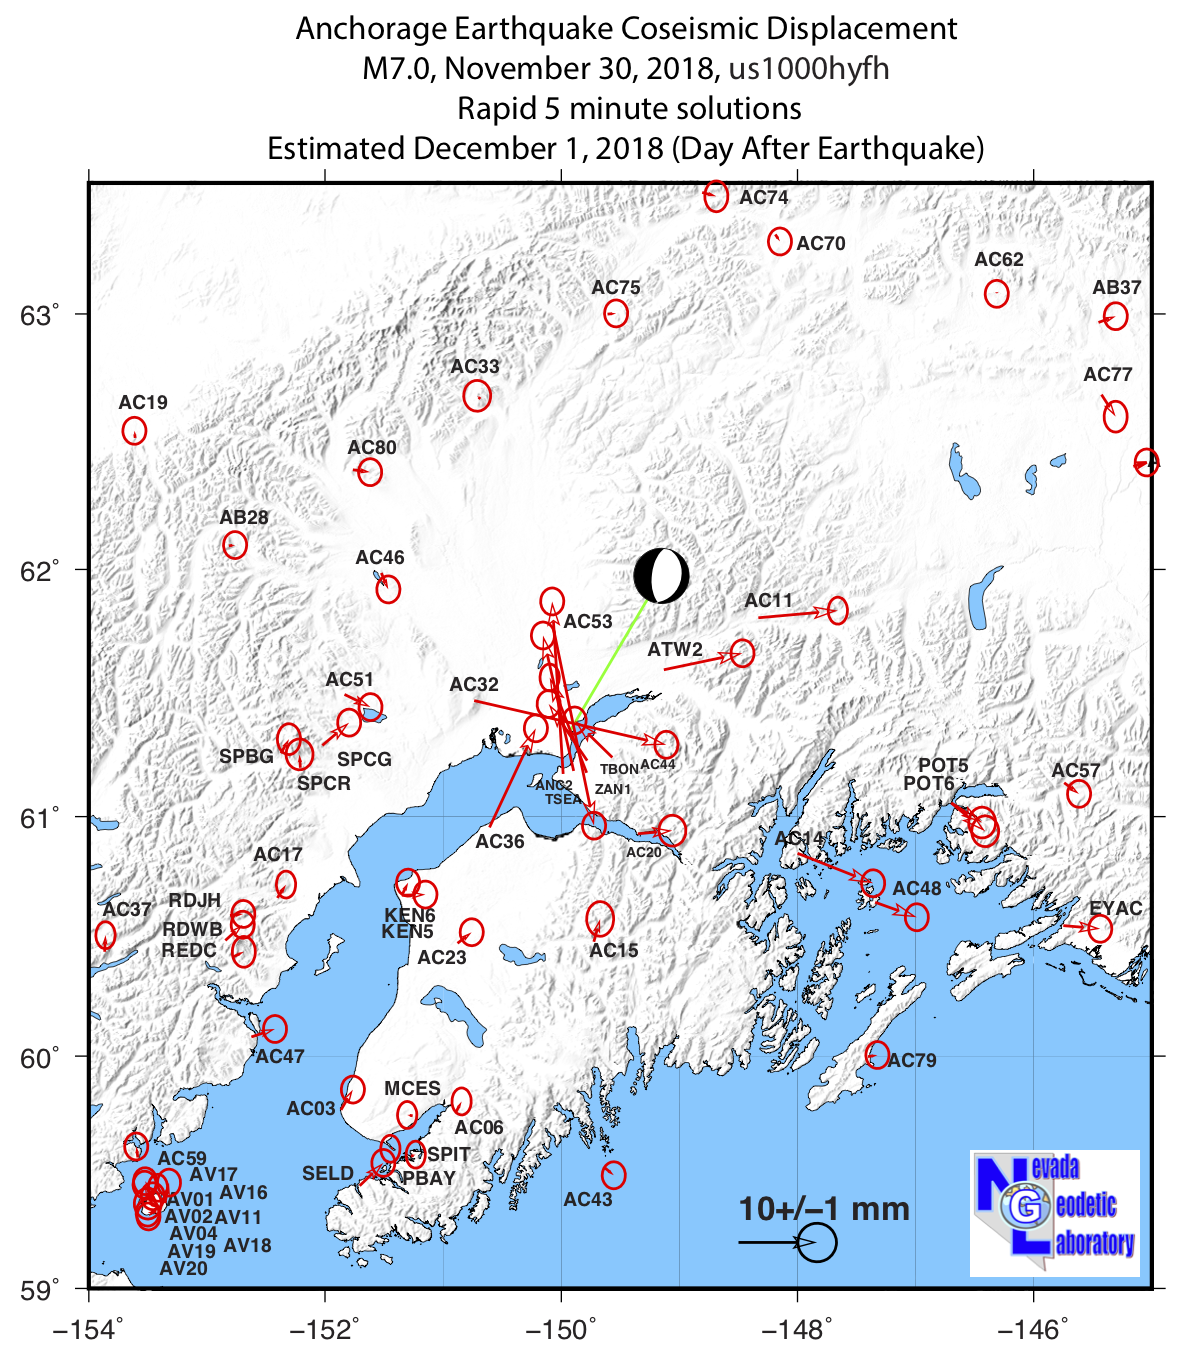
The rapidly derived coseismic displacents were used to make the figure.
[October 19, 2018] New paper on seasonal strain and seismicity in California and Nevada
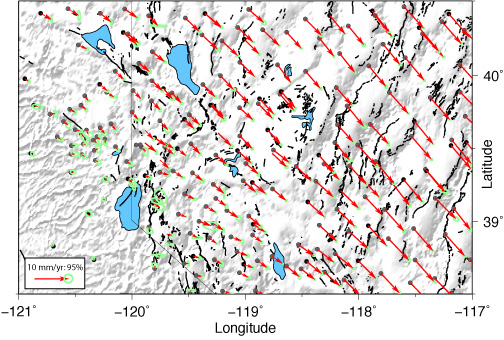
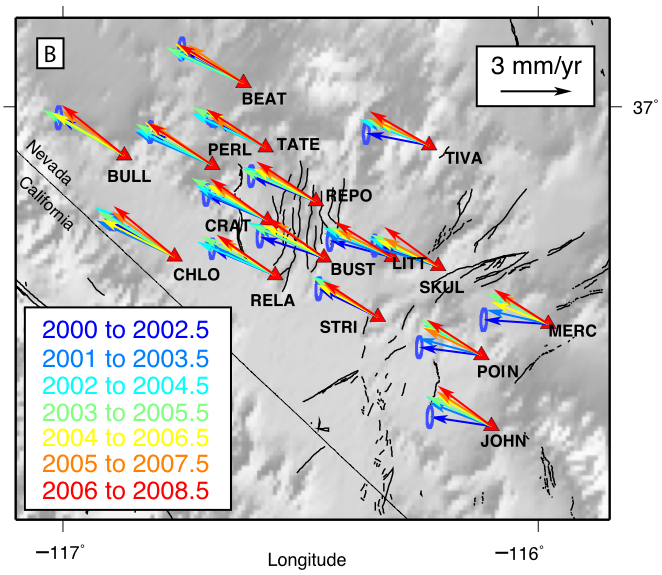
The changing amount of water and snow mass that lays on top of the Earth's surface is one possible explanation for observed seasonal variations in seismicity. This hydrological loading would change the state of stress inside the crust minutely with the seasons. We image the seasonal stress variation by using the horizontal seasonal displacements of GPS monuments in the southwestern United States. This reveals large‐scale seasonal patterns of the crust contracting and extending in‐phase with the Earth's surface going down and up, respectively, particularly in northern California which experiences a large excess of water and snow in late winter. The seasonal variations in horizontal deformation there correspond to variations in the number of mainshocks, with more earthquakes occurring when the crust is under extension. In southern California, we see no correlation with the number of mainshocks. In both regions, seasonal deformation correlates with the proportion of large earthquakes and shows an anticorrelation with the aftershock production. So even though seasonal deformation may not directly trigger earthquakes, if an earthquake happens during the right season, it seems to be able to grow a little larger, releasing a little more stress than it otherwise would and reducing the need for (more) aftershocks.Kreemer, C., and I. Zaliapin, 2018, Spatio-temporal correlation between seasonal variations in seismicity and horizontal dilatational strain in California, Geophysical Research Letters, 45. (18), p. 9559-9568, https://doi.org/10.1029/2018GL079536.
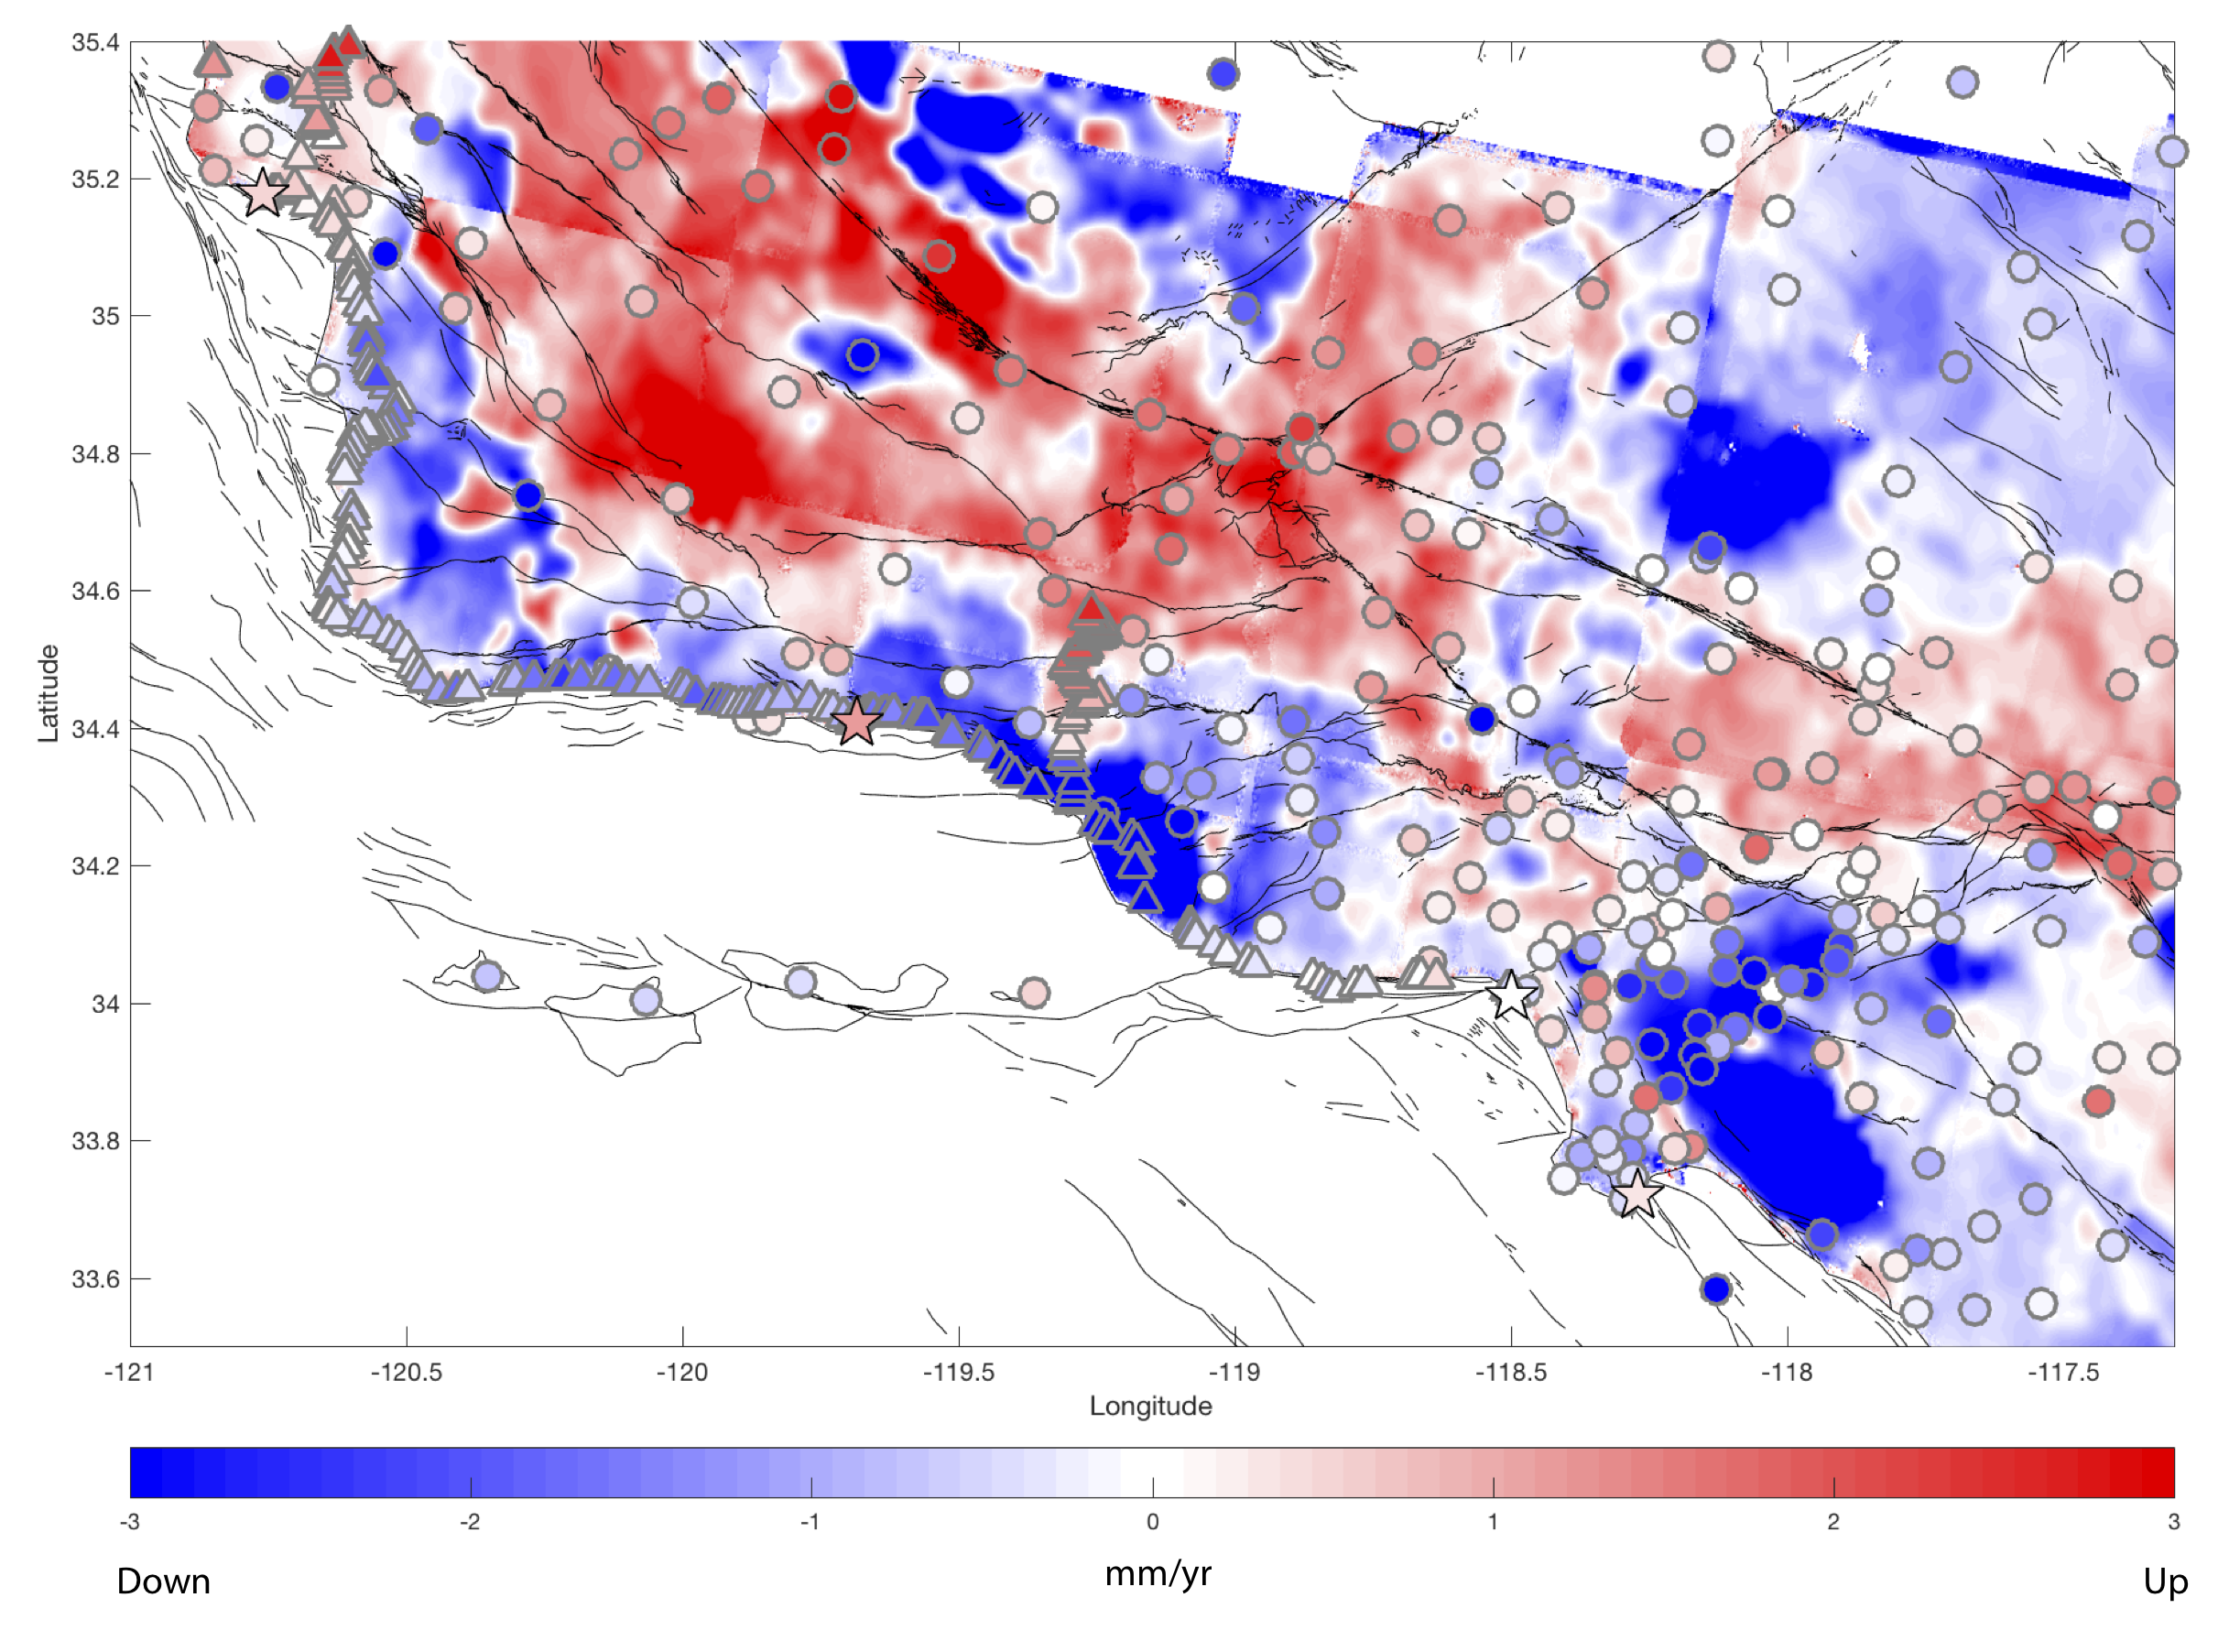
Left panel: Dilatational strain (positive is extension, negative is contraction). Superimposed are the orientations and relative size of the principal axes: white vectors are positive (extensional) and black are negative (contractional). Principal axes reflect spatial averages and for each set the largest axis is normalized to unity. Grey lines are major faults (i.e., with Quaternary slip rate ≡2.5 mm yr-1). Right panel: Vertical displacements inferred from the GPS Imaging technique (Hammond et al., 2016). Superimposed are horizontal displacements (spatially down-sampled) derived from MELD (Kreemer et al., 2018). Numerical results are provided in the paper's Supplemental Information.
[September 24, 2018] NGL publishes new paper in Eos!
Harnessing the GPS Data Explosion for Interdisciplinary ScienceMore GPS stations, faster data delivery, and better data processing provide an abundance of information benefitting many kinds of Earth science. At NGL we make our data products for over 17,000 stations available online, including metadata, lists of stations, plots of position coordinates, tables of data holdings, and descriptions of new items relating to the products. The service and philosophy, known as Plug and Play GPS , has been documented in a new paper published today in Eos.
NGL is committed to continuing to provide this long-running service to the scientific community, and we encourage researchers to explore these data sets and apply their creative skills to scientific investigations that have yet to be conceived.
Henceforth we request that citation of the data processing and products presented on our website should be:
Blewitt, G., W. C. Hammond, and C. Kreemer (2018), Harnessing the GPS data explosion for interdisciplinary science, Eos, 99, https://doi.org/10.1029/2018EO104623.
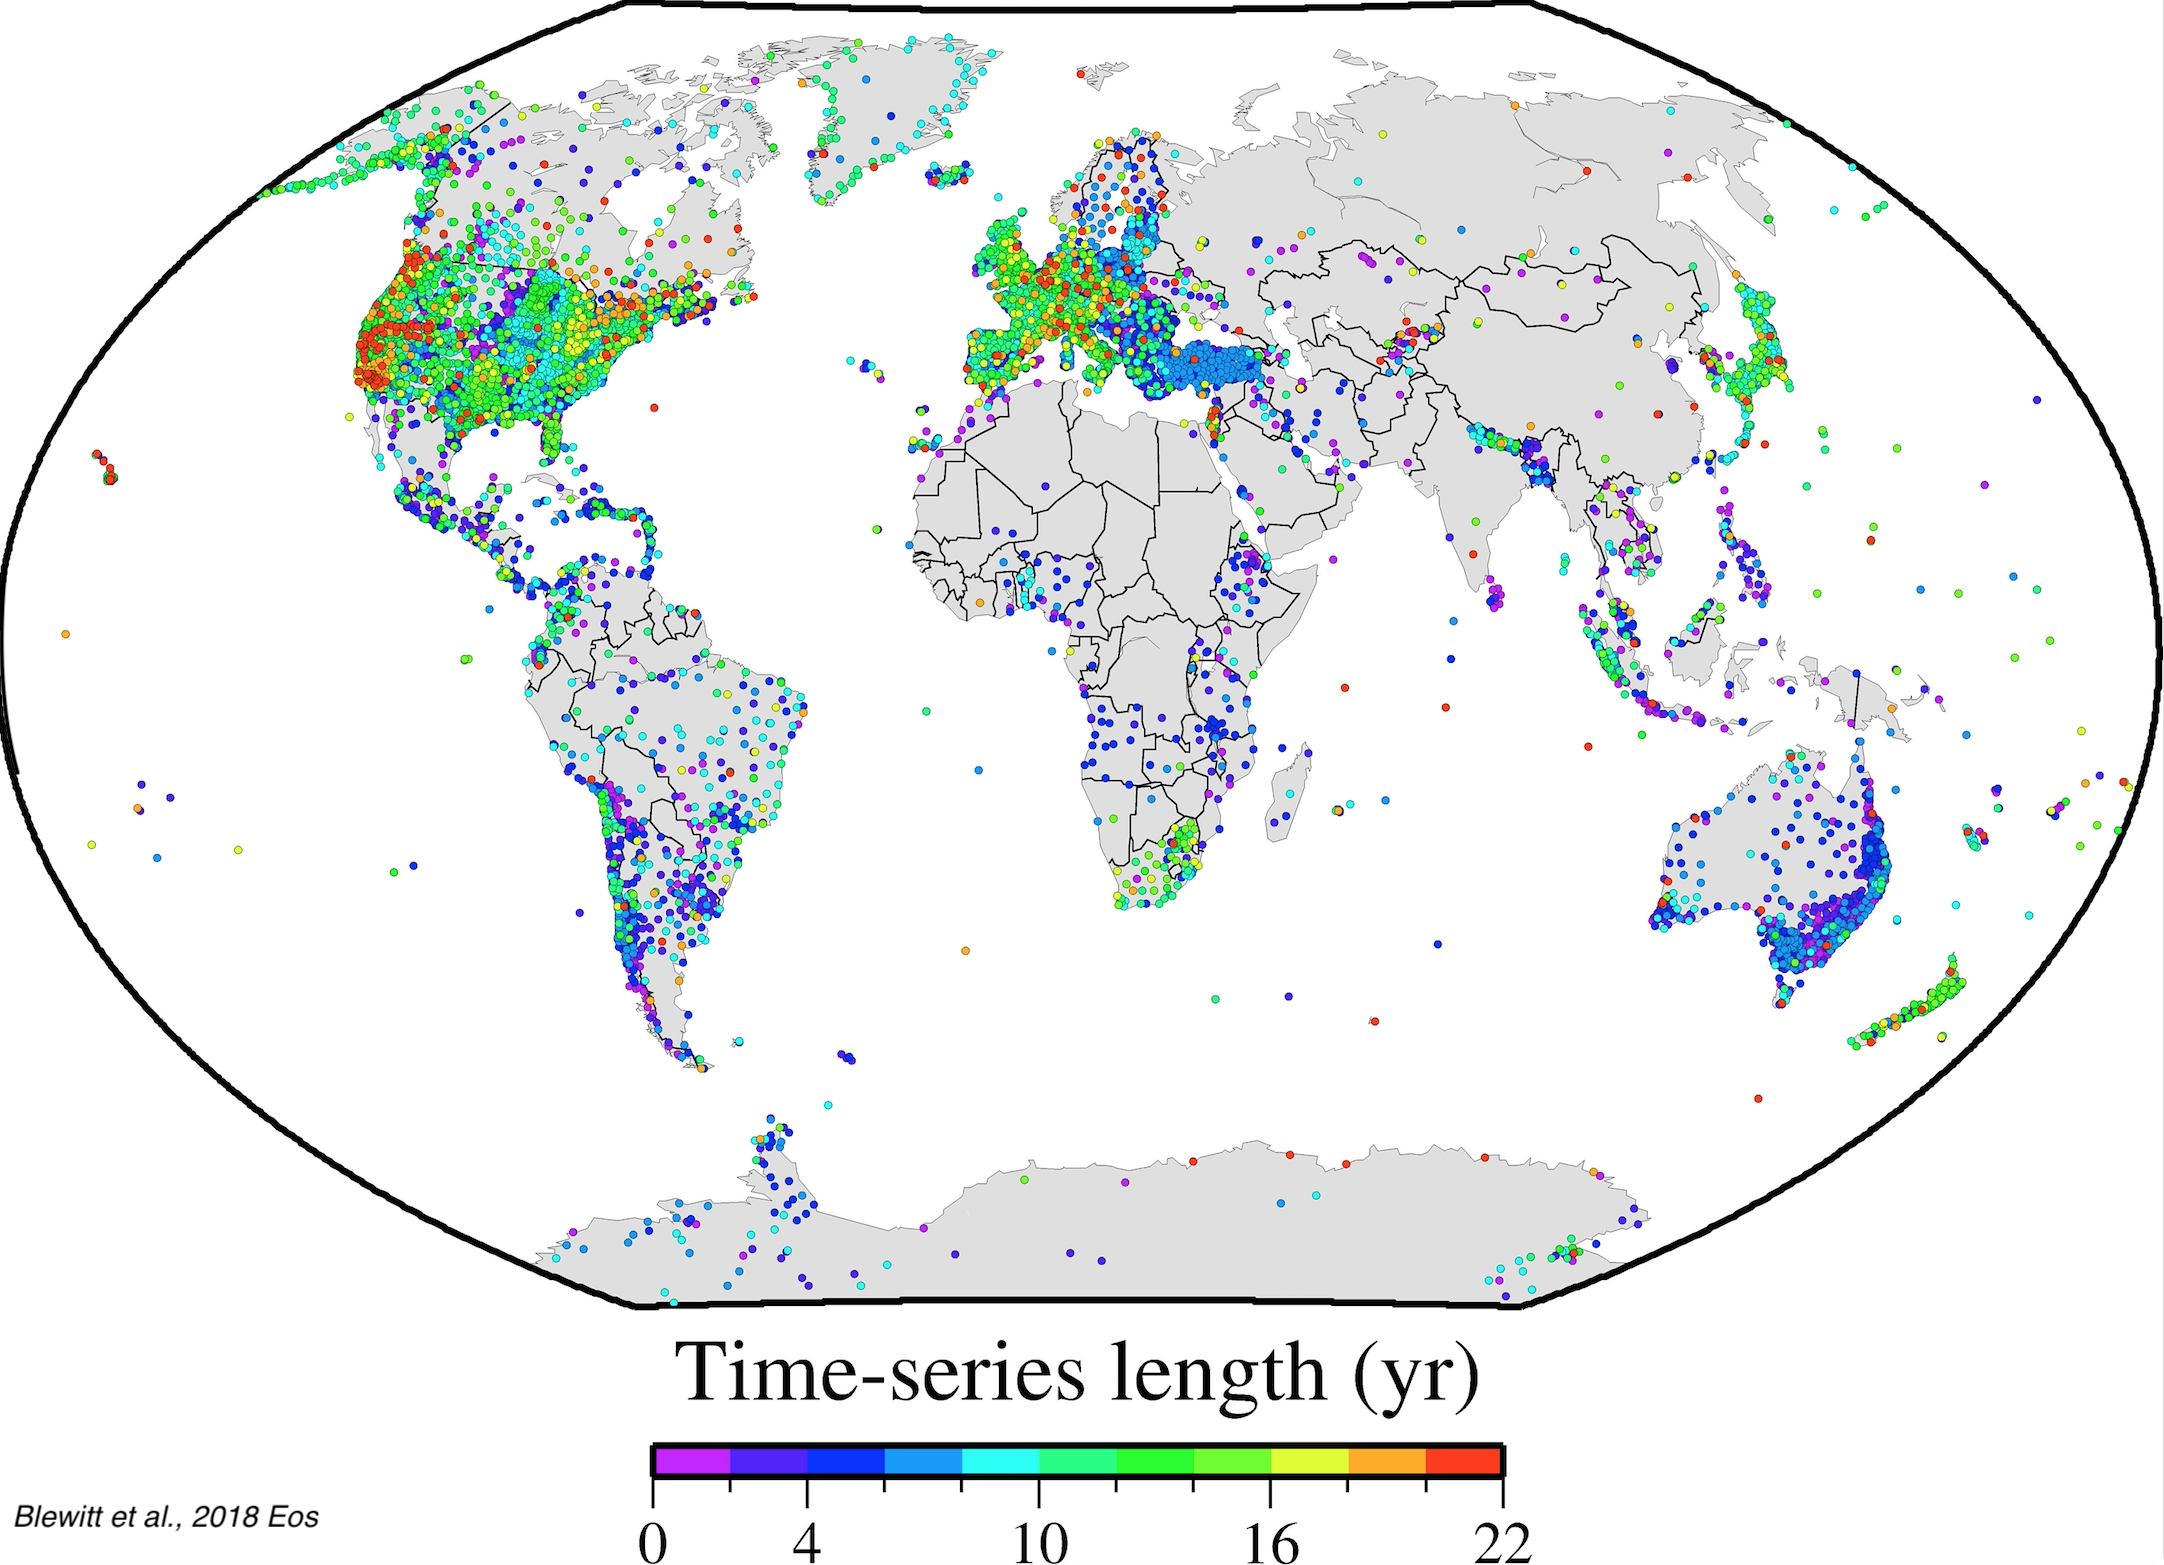
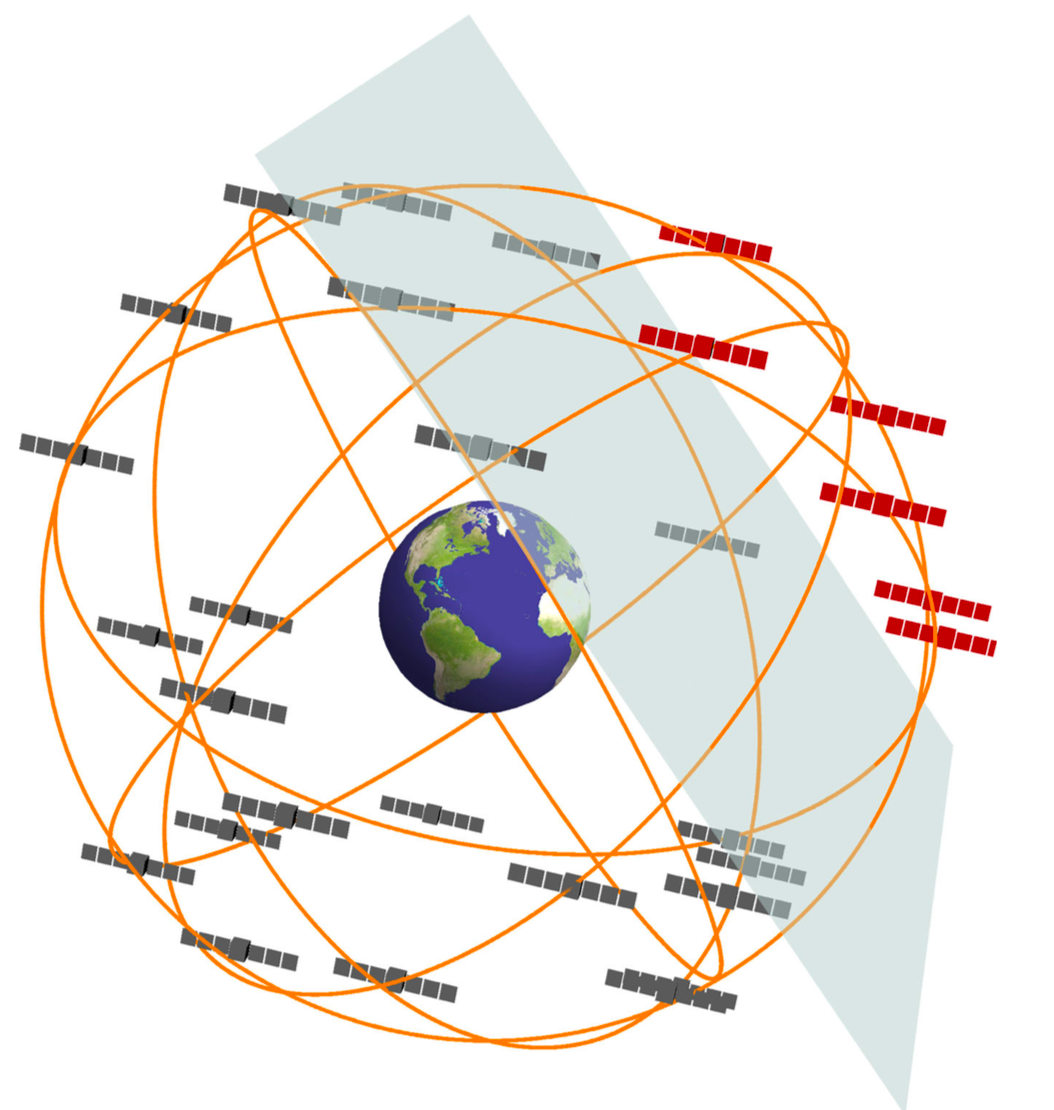
Fig. 1. The Nevada Geodetic Laboratory processes data from a global network of about 17,000 geodetic GPS stations.
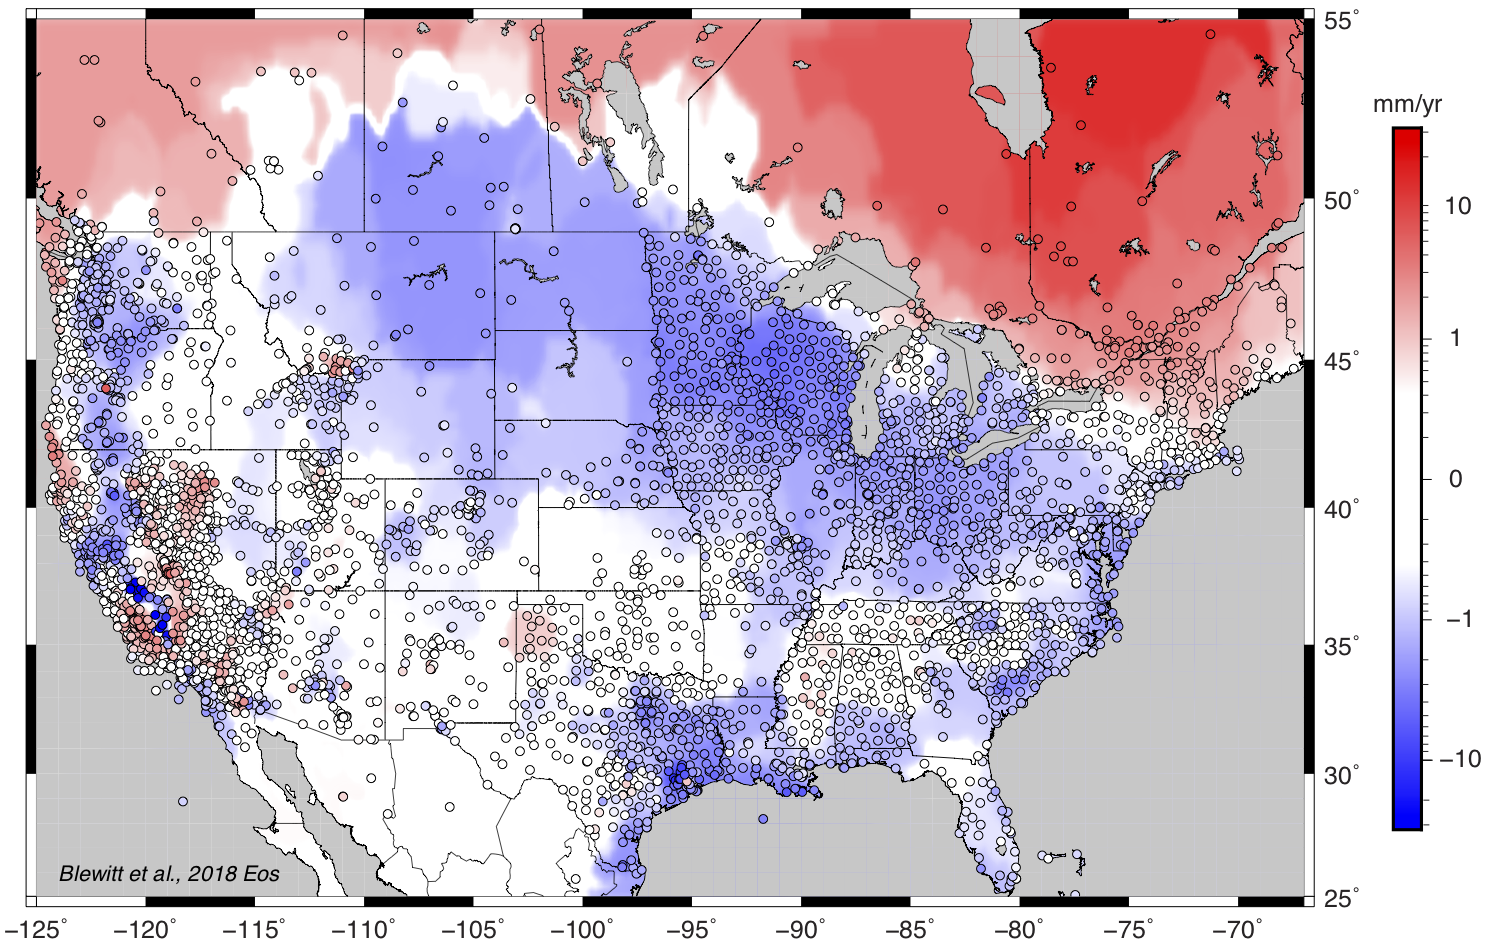
Fig 2. GPS stations (circles) and observed rate of vertical velocity of continental North America. Glacial isostatic adjustment dominates the field: uplift (red) in Canada and subsidence (blue) in the United States. California’s Central Valley and the Gulf Coast of Texas and Louisiana exhibit rapid subsidence. White regions are statistically consistent with zero motion with respect to Earth’s center of mass. Rates are plotted on a log scale and interpolated using the GPS imaging method of Hammond et al. [2016].
[June 18, 2018] New paper published on the August 24, 2014 M6.0 South Napa Earthquake
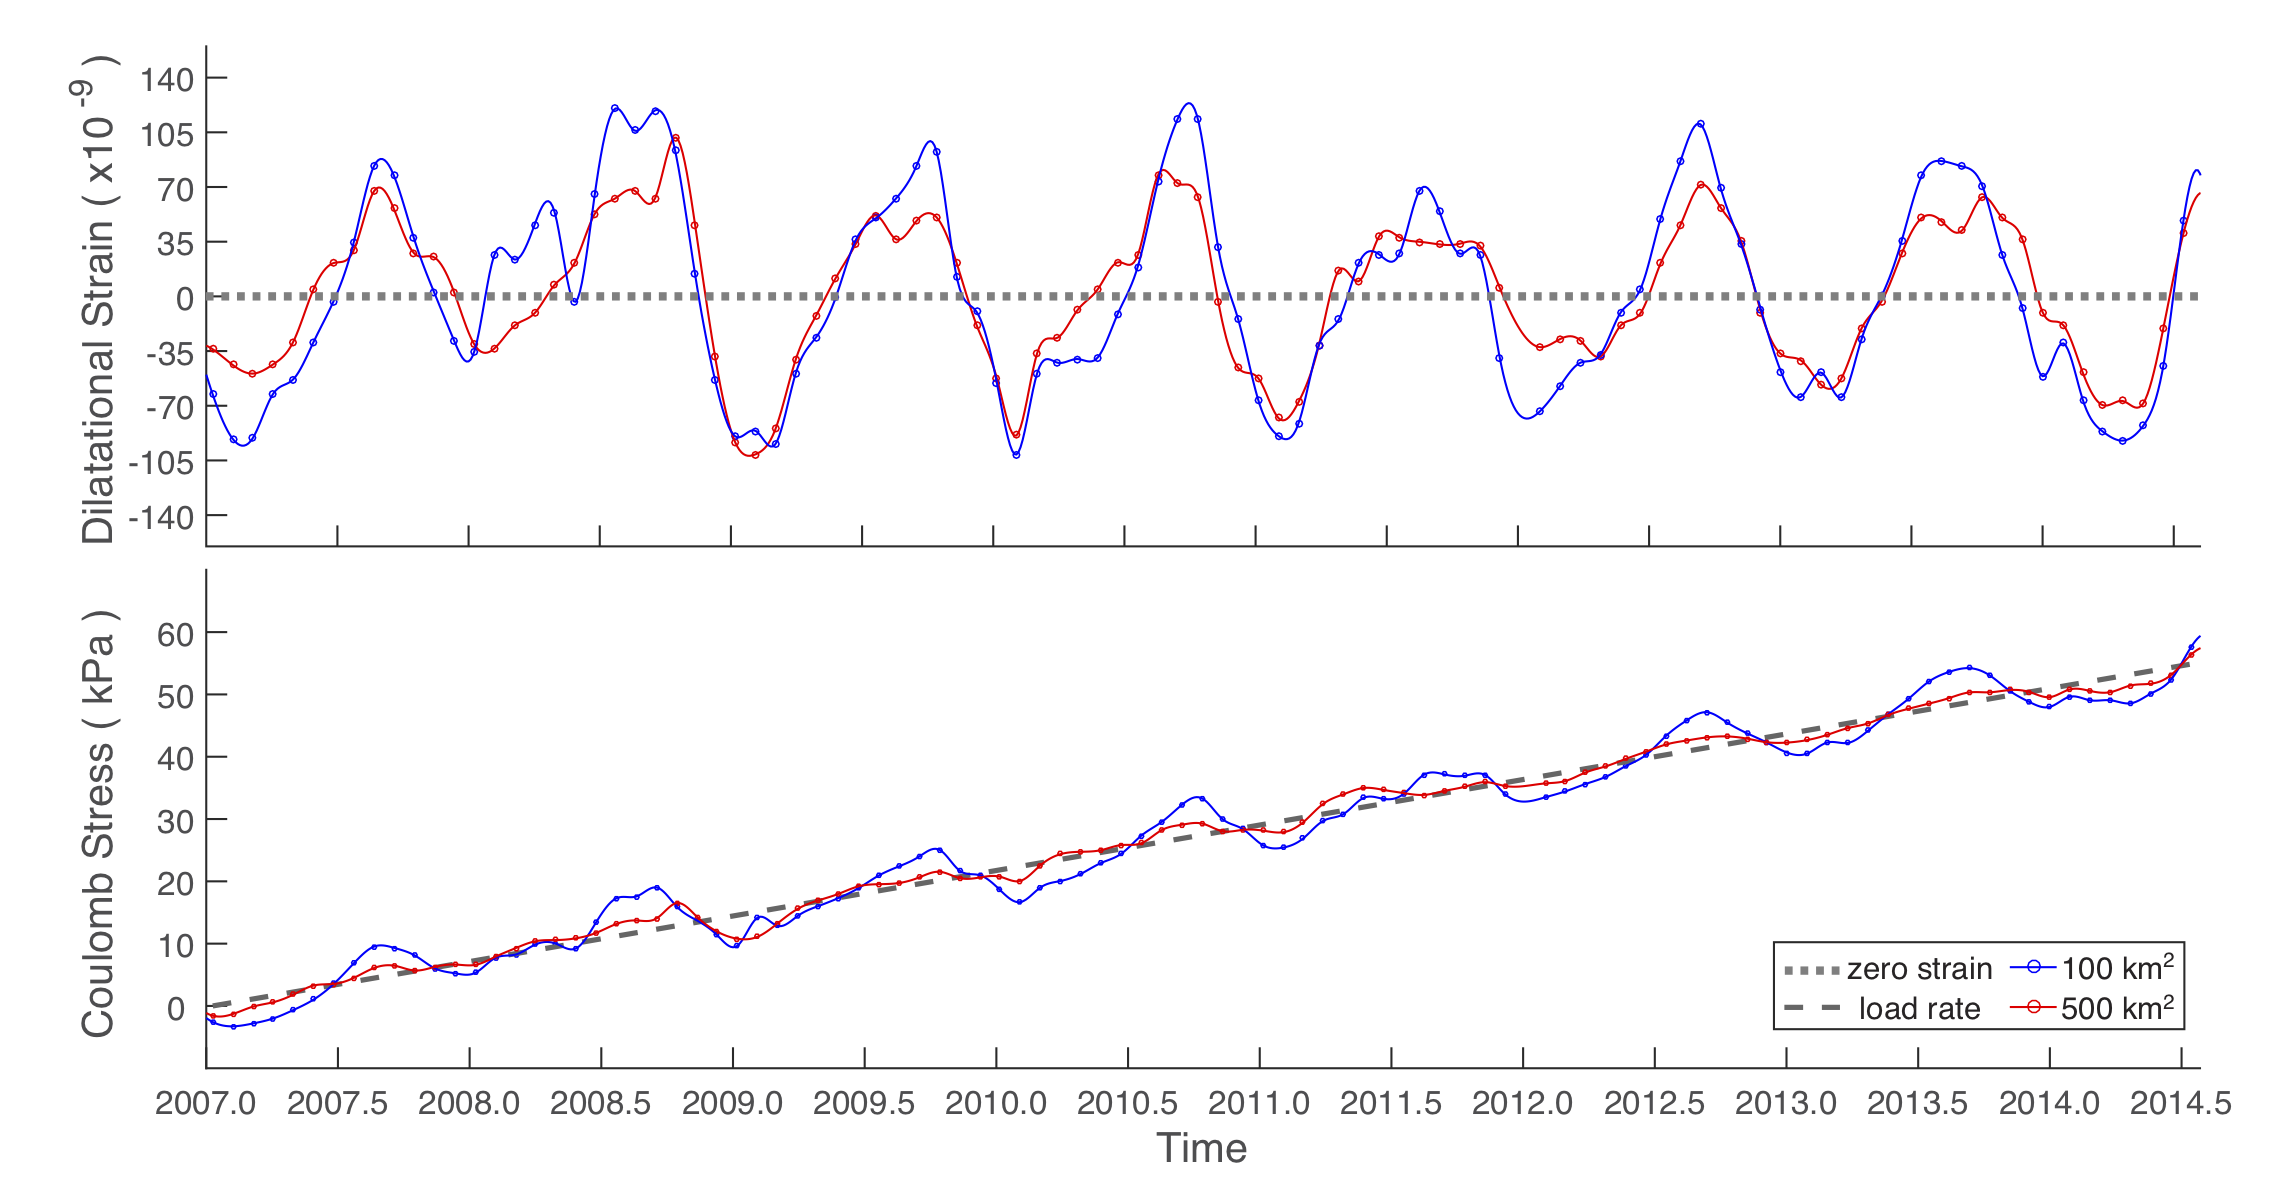
A new paper published by Nevada Geodetic Laboratory Graduate Student Meredith Kraner uses data from high‐precision continuous GPS stations to observe a 3 mm horizontal expansion of the Earth's crust prior to and in the vicinity of the August 2014 M6.0 South Napa earthquake. The study is a collaboration with William Holt from Stony Brook University, and Adrian Borsa from Scripps Institution of Oceanography at UC San Diego. The analysis looks at eight years of continuous GPS data leading up to the earthquake and finds that this pattern of horizontal crustal extension repeats every summer. The effect releases pressure on faults in the West Napa fault system, making them more likely to slip during the summer months. We speculate that large seasonal variability in the amount of groundwater in the Sonoma and Napa Valley subbasins may contribute to the observed changes.Read more in the paper, which has been published in the Journal of Geophysical Research, Solid Earth and is available online
Also see features from the AGU, AP news, KCBS radio, and Live Science.
[June 14, 2018] Pause in NGL Solutions For IGS14 Upgrade
Owing to the need to transition to IGS14 products as mandated by JPL, our final solutions will cease to be updated with new data until hardware, software, processing and data products systems are updated by sometime later this summer. NGL rapid and ultra-rapid solutions are already in IGS14 and will continue to be available. We are sorry for the inconvenience.[May 8, 2018] New paper published on glacial isostatic adjustment across North America
The theory of plate tectonics says that tectonic plates move as rigid blocks along the Earth’s surface and that the Earth’s crust should only deform at the boundary between plates. However, the recent explosion in the number of high-precision Global Positioning System stations has allowed us to capture some subtle deformation patterns inside the North American plate that only became apparent by a very careful analysis of the relative motions between thousands of stations. We found that most of the plate is moving at 1-2 mm/yr towards central Canada. Consequently, around most of Canada there is a zone where the crust is contracting. Within Canada, the crust is extending outward and is moving upward rapidly. These patterns can be explained by the process of the crust and mantle still rebounding from a time when it was covered by a thick ice-sheet about 16,000 years ago. The fact that this causes the land to move towards the former ice sheet is an unexpected result that will be useful in understanding the relaxation properties of the underlying mantle. Moreover, we found that earthquakes inside the North American plate do not occur where we see the crust deform, which leaves these events still enigmatic.The paper is available with open access.
See the UNAVCO Science Snapshot
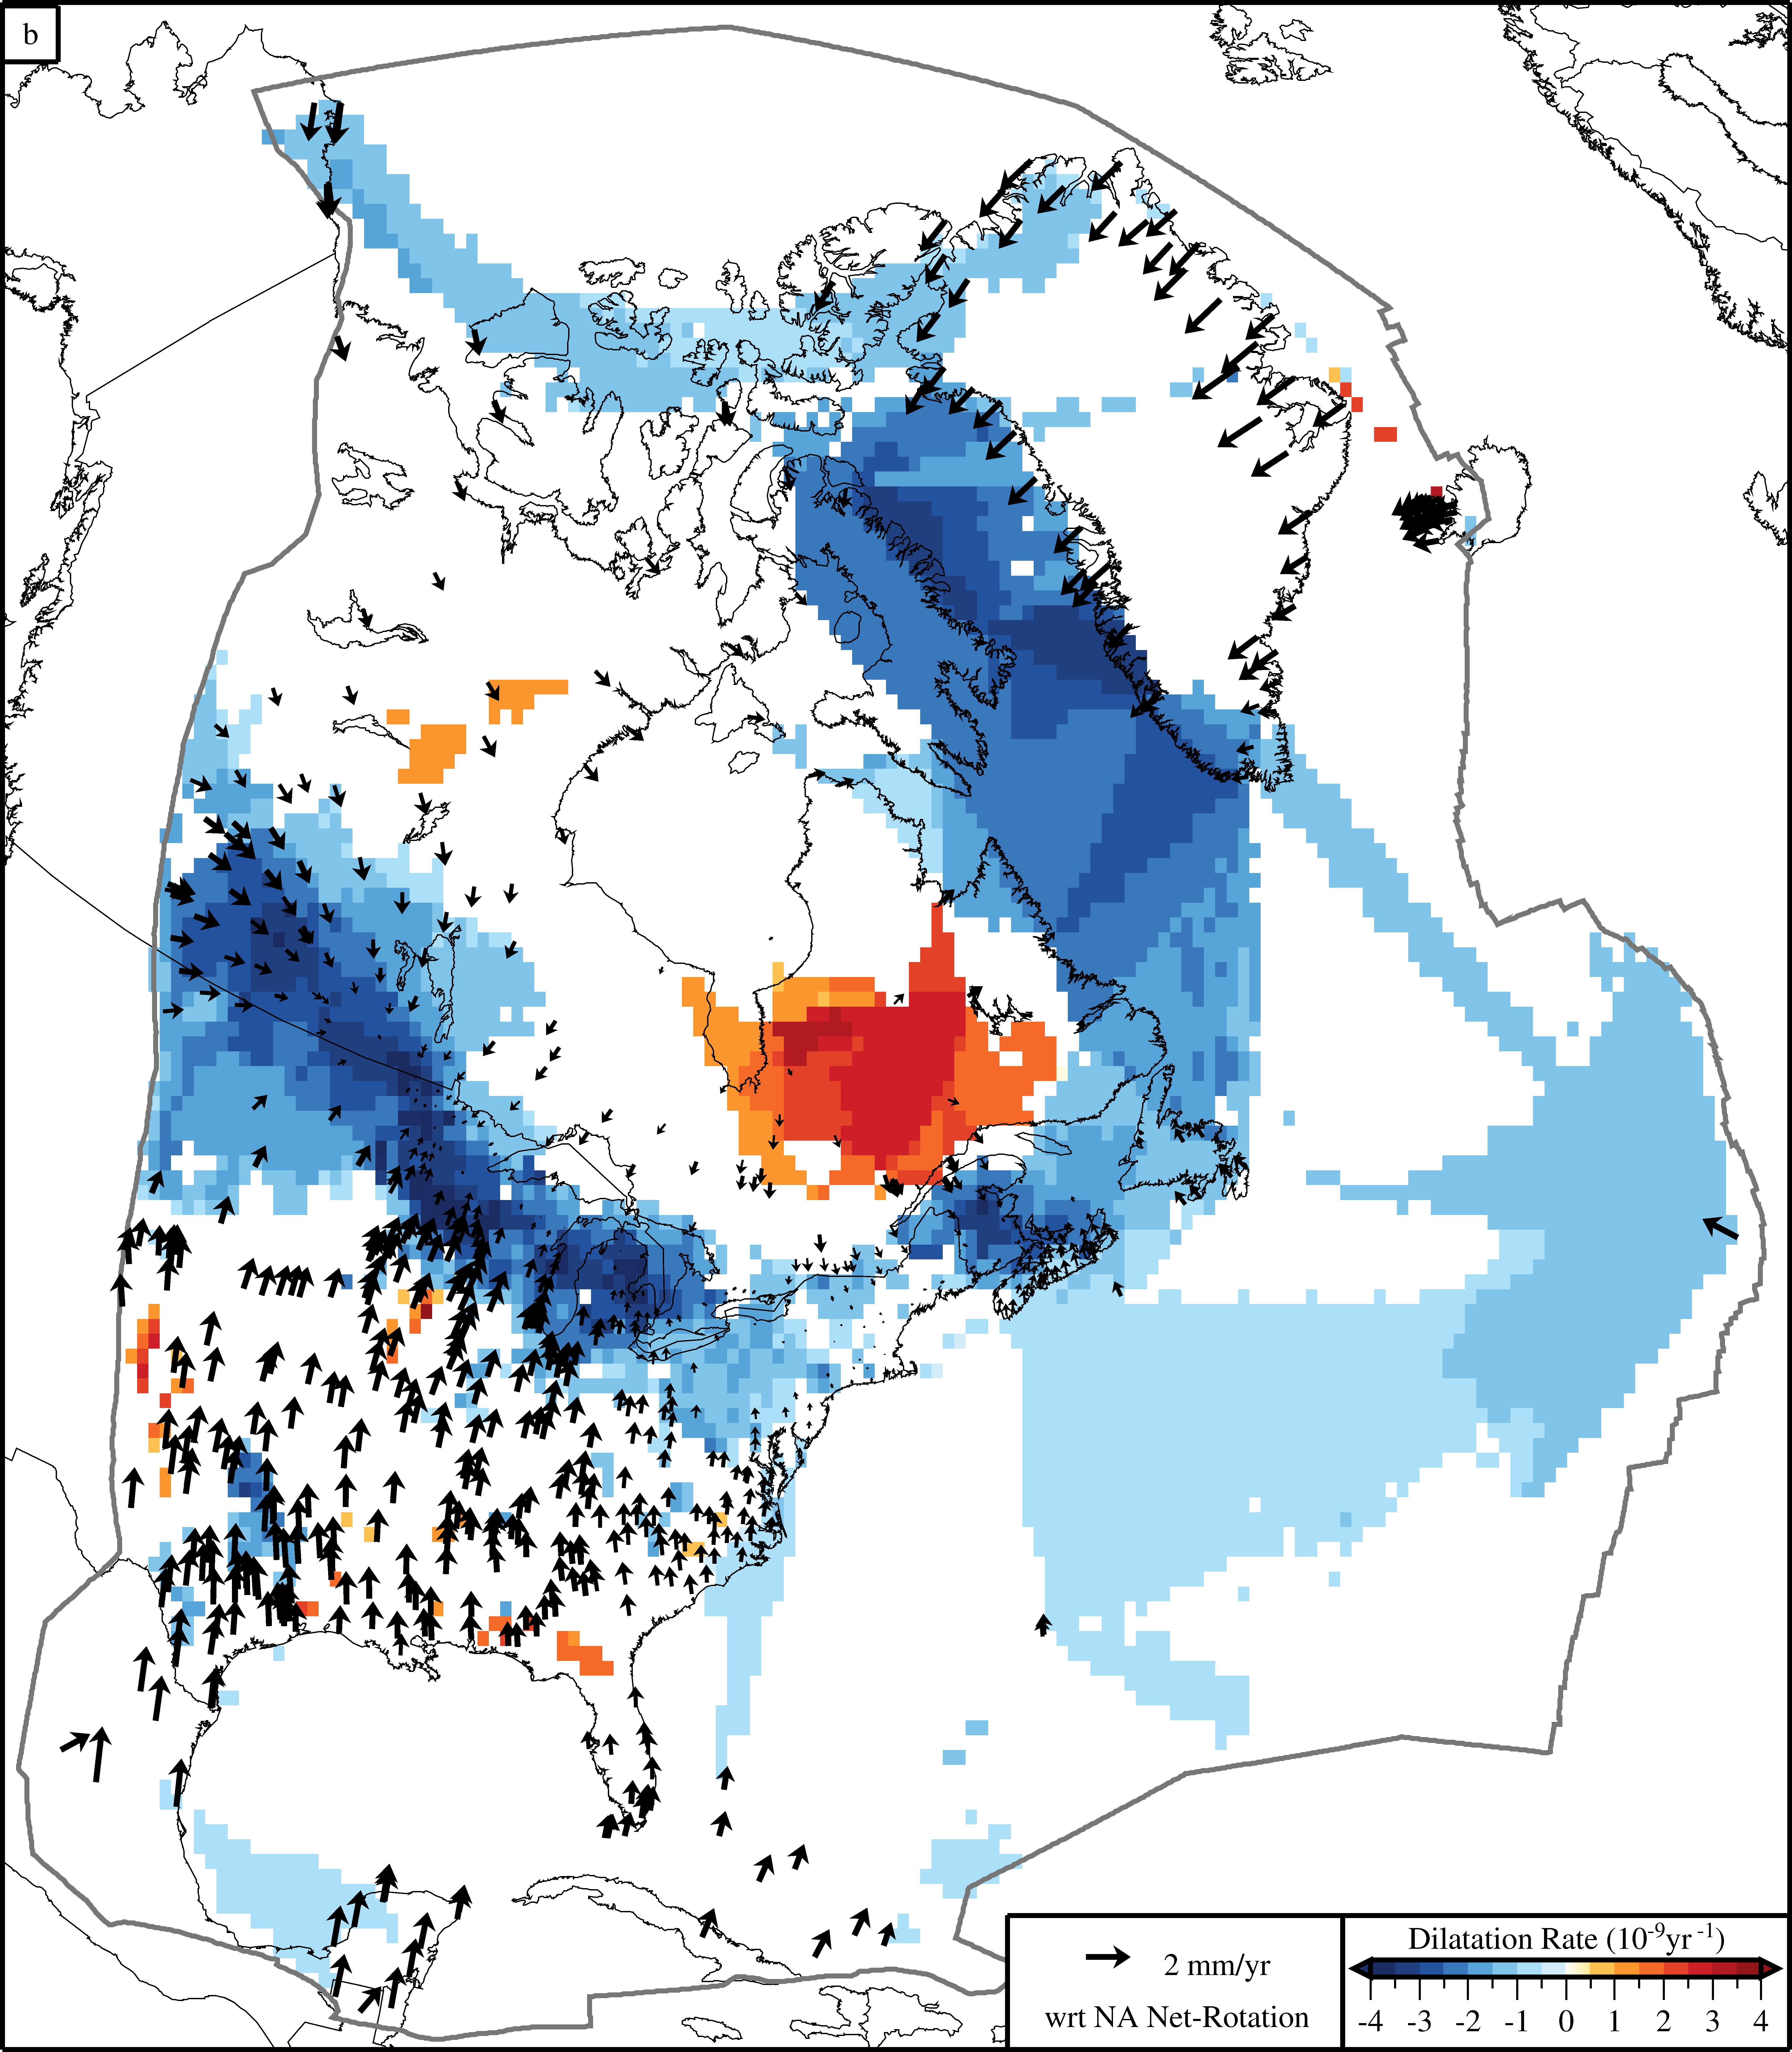
In the above figure dilatational strain rate with blue and red colors are contractional and extensional, respectively. Results are only shown for dilatation rates that are larger than twice their standard deviation. Superimposed are selected velocities in a reference frame which has the area-weighted mean rotation for the entire plate (i.e., the plate’s net rotation) subtracted from the velocities in the original IGS08 reference frame.
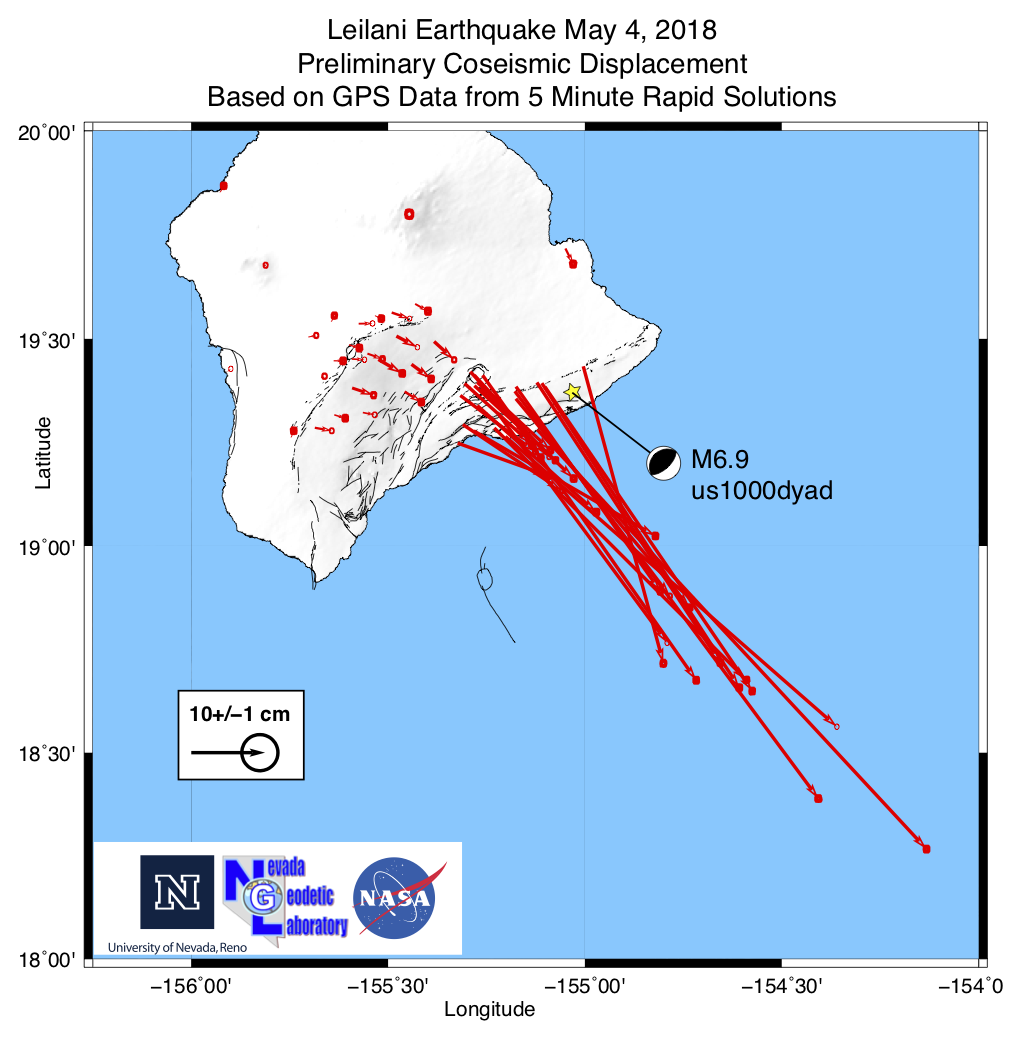
[May 5, 2018] M6.9 Earthquake during volcanic eruptions near Leilani, HI
Yesterday, while volcanic eruptions occurred near the Kilauea East Rift Zone and Leilani, HI, a magnitude 6.9 earthquake occurred in the shallow crust. NGL processes openly available GPS data from continuously operating stations in the area using JPL's GIPSY software and rapid orbit products. Using 5 minute position time series that are automatically produced in our system we were able to estimate coseismic offsets from 57 stations near the epicenter. Many of these stations are near the Kilauea rift zone. We produced a a table of preliminary displacements from these time series.A figure of these offsets below shows the difference in positions of stations before and after the earthquake, with larger offsets near the event, getting smaller with distance from the epicenter (yellow star). The maximum displacement was 0.77 meters. Gradients in the displacements indicate general extensional strain across the volcanic rift zones.
Data were obtained from continuously operating GPS stations operated by the USGS Hawaiian Volcano Observatory, University of Hawaii, Stanford University, the Jet Propulsion Lab, U.S. Coast Guard, and Federal Aviation Authority.
[February 15, 2018] "GPS Imaging" One of the Most Downloaded JGR Papers in 2017
We were recently notified that our article "GPS Imaging of vertical land motion in California and Nevada: Implications for Sierra Nevada uplift" published in October 2016 was one of the top 10 most downloaded papers in the Journal of Geophysical Research - Solid Earth in 2017! As of year-end 2017 the article received 1456 downloads.The article is available with open access here: link to JGR.
[January 24, 2018] Update on the M7.9 Alaska Earthquake (see previous story below)
Data from many GPS stations have arrived since the earthquake and these have been processed at NGL using rapid orbits from JPL. We used these data to make 24 hour sample rate time series and estimate coseismic offsets from the difference between the new position and the median position from 10 days before the event. The figure shows that the displacement pattern is consistent with what was found earlier using ultra-rapid orbits. The data now are more numerous and have much smaller uncertaintes. We find that measurable displacement consistent with earthquake deformation is noticeable at many stations over a great distance. For example, INVK which is over 1500 km northeast of the epicenter in Canada's Northwest Territories, appears to have moved several mm to the southwest. Selected station names are given in the figure, offsets with large uncertainites were omitted.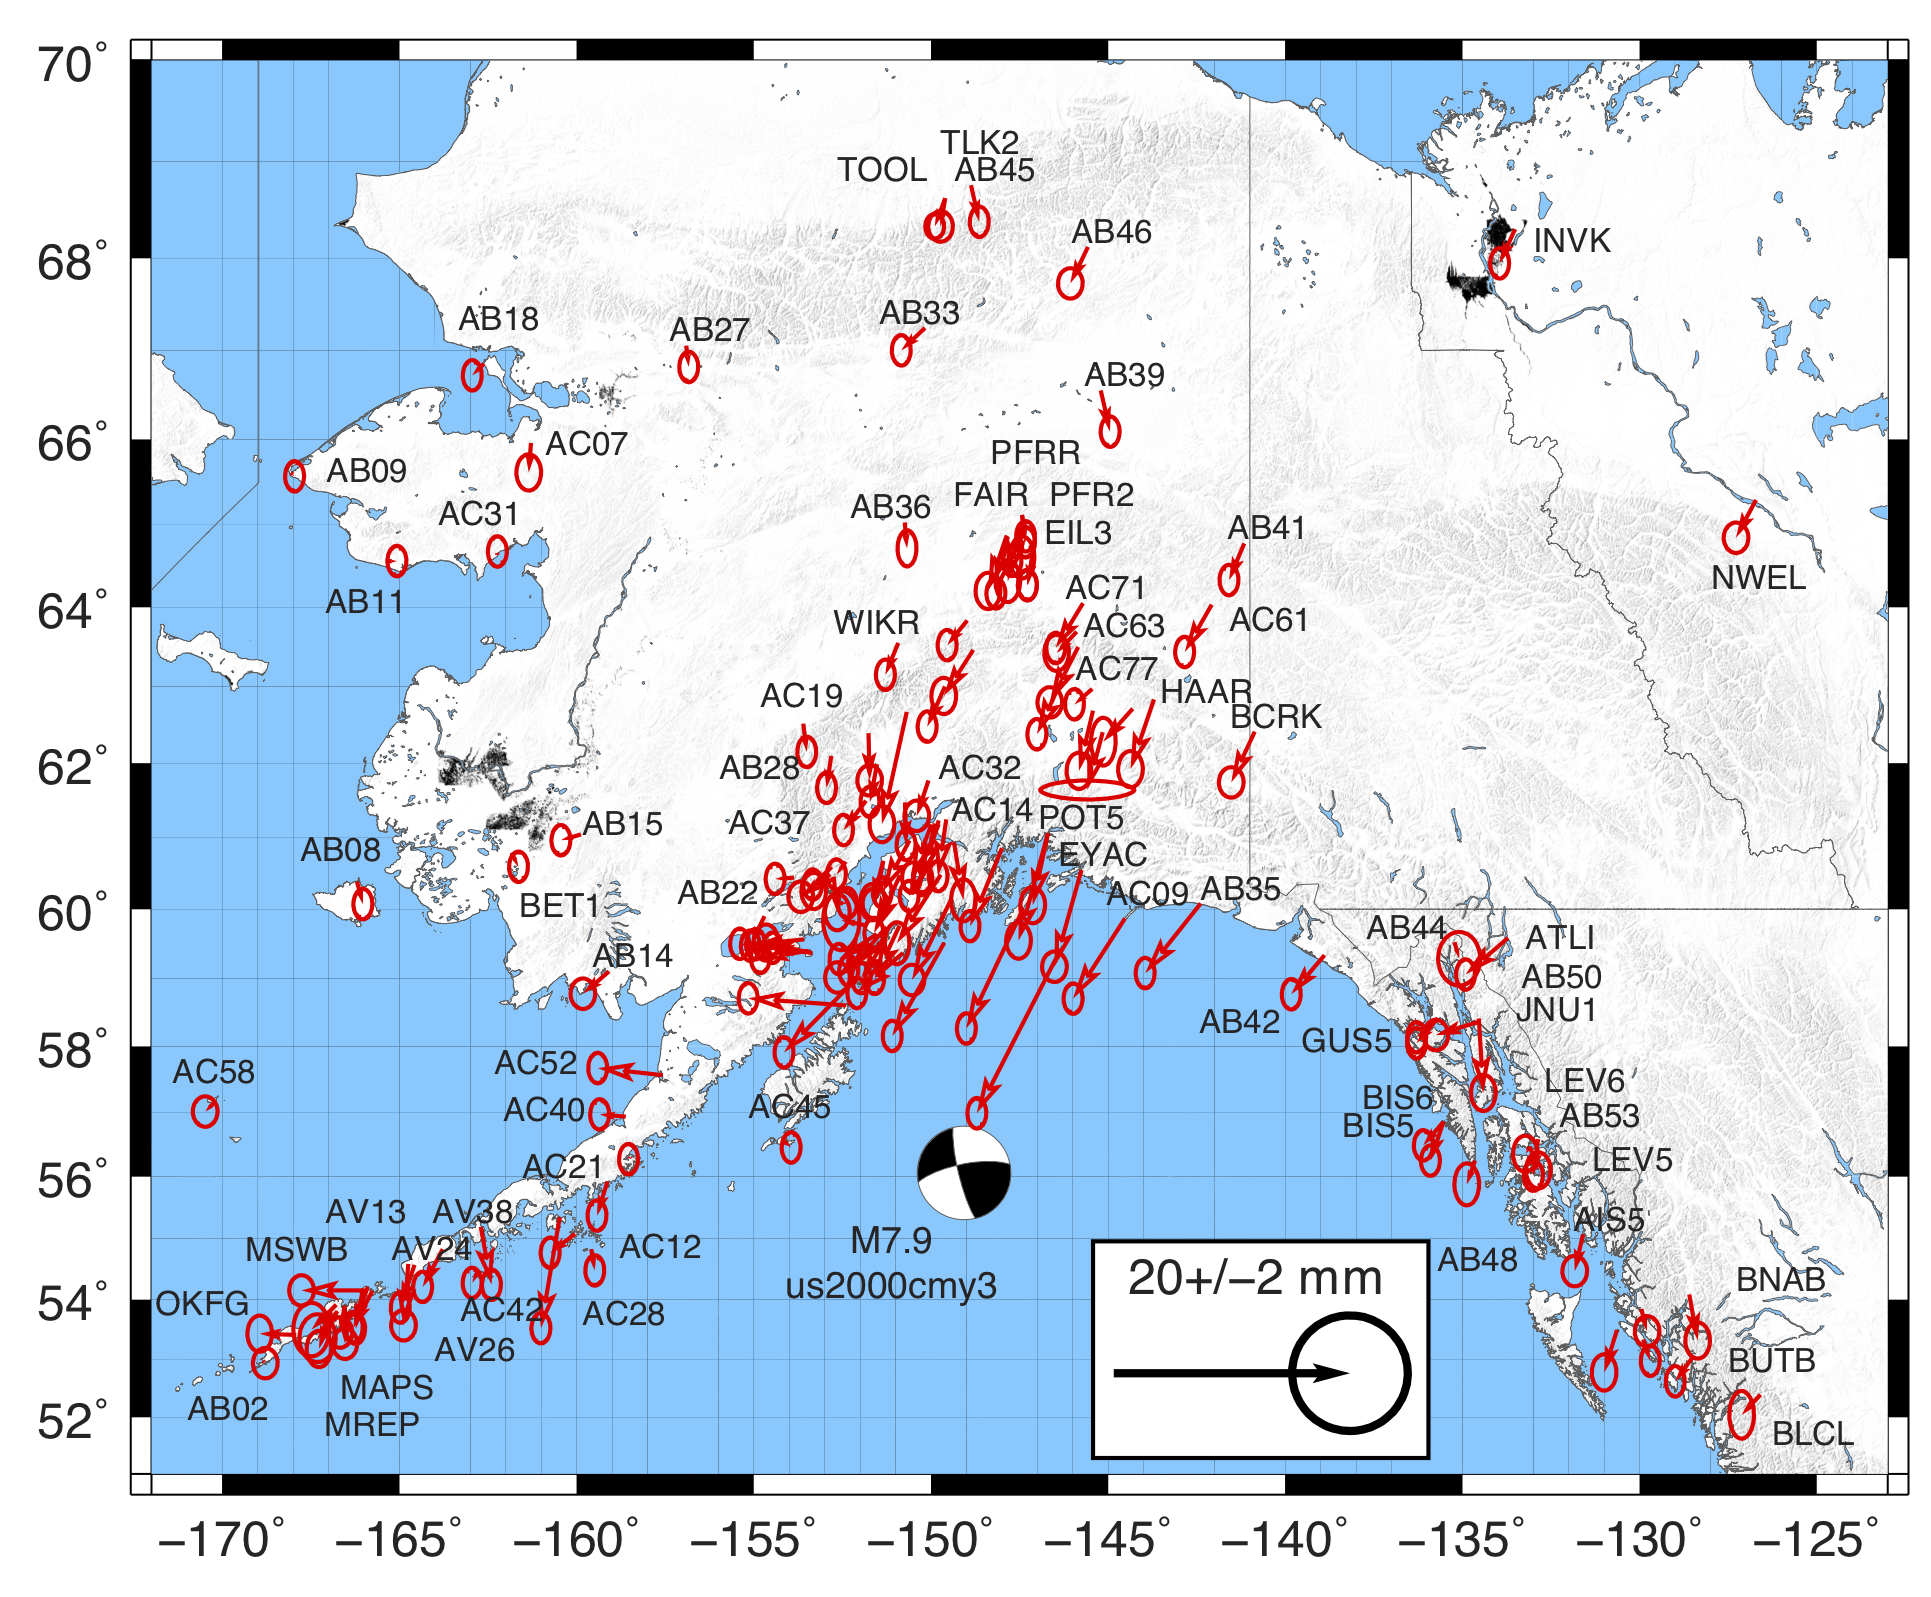
The plot was made using this table of preliminary coseismic offsets.
[January 23, 2018] Massive earthquake offshore southern Alaska
The figure below shows very preliminary coseismic offsets from the January 23, 2018 M7.9 earthquake offshore southern Alaska. These are estimated from 5 minute sample rate GPS time series obtained using ultra-rapid orbit products from the Jet Propulsion Lab, obtained within 15 hours of the event. Only offsets with uncertainties (not shown) less than or equal to 10 mm are included. All resulting offsets are less than 13 mm and so are on the edge of significance. However, the pattern of horizontal motion is consistent with predictions of shallow strike slip event, with southwest displacement in the event’s northeast quadrant and west-northwest displacement in its northwest quadrant.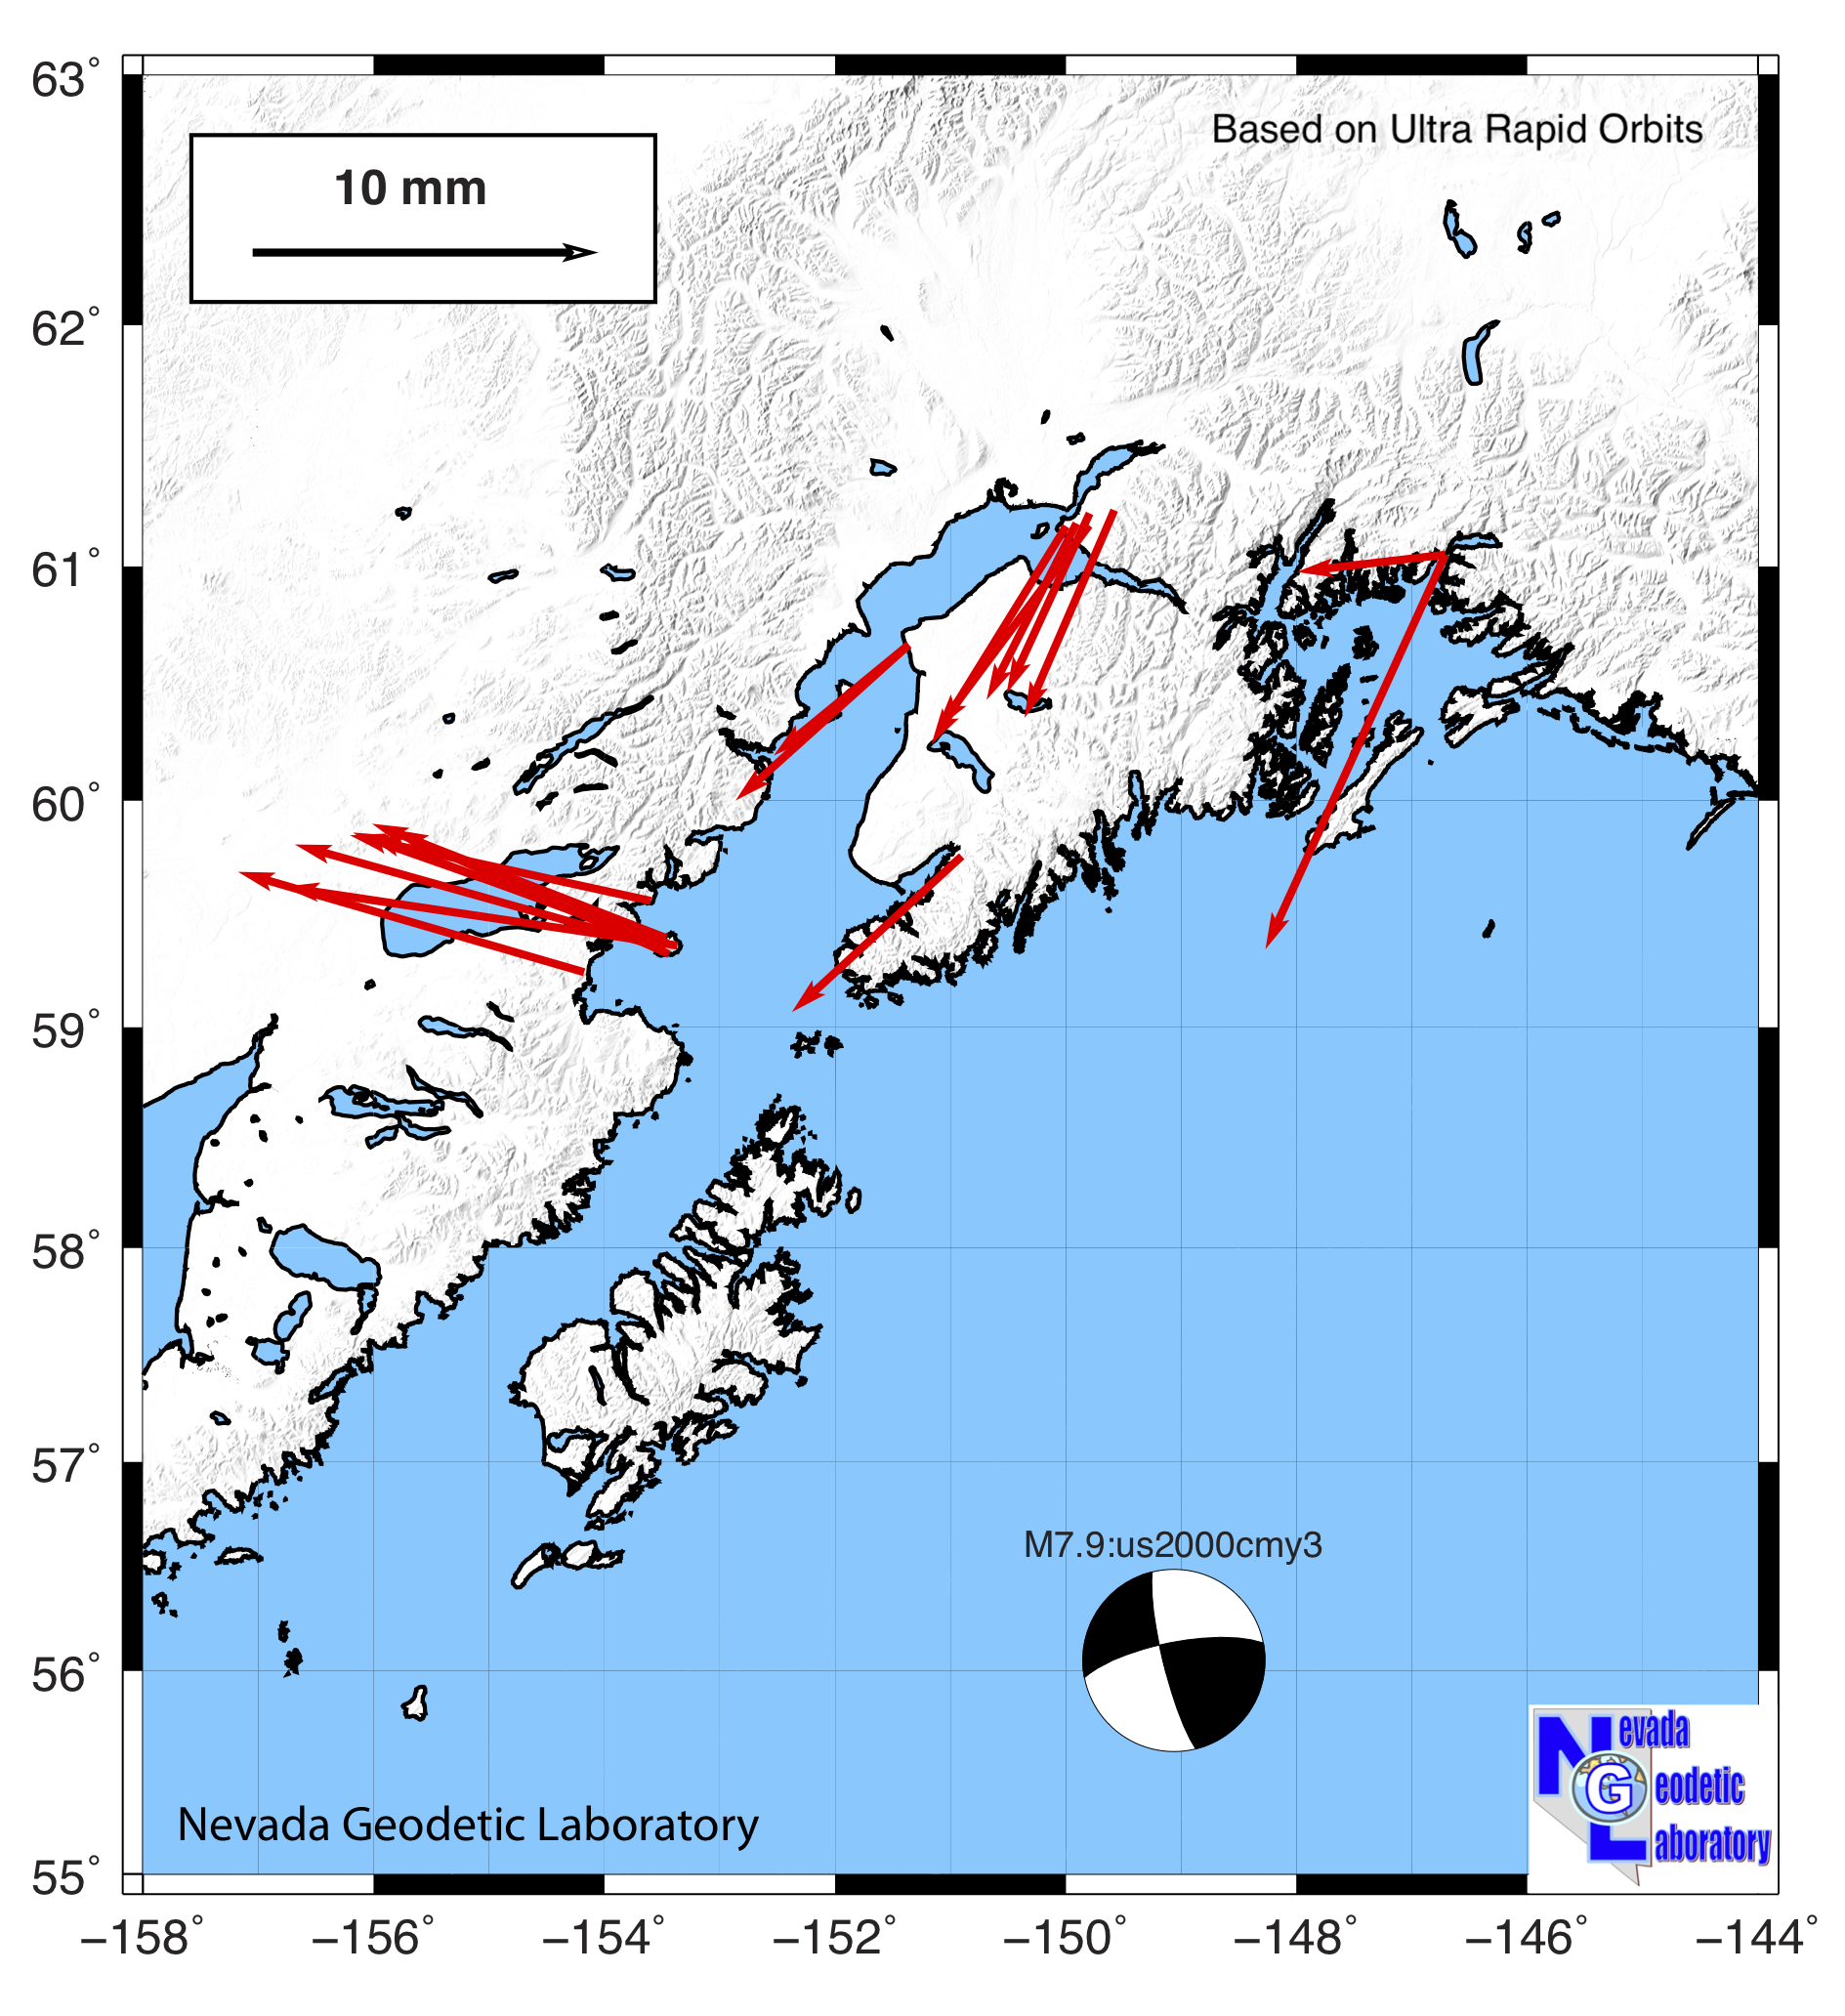
[December 28, 2017] New paper published on uplift of the Western Transverse Ranges
How fast do mountains grow? What mechanism drives their growth?
In Southern California the Western Transverse Ranges experience active tectonic uplift of ~2 mm/yr
in response to plate boundary forces contracting the Earth's crust near the Big Bend of the San Andreas Fault.
We integrated data from four geodetic techniques (GPS, InSAR, leveling and tide gauges) to map the pattern and rates of uplift and subsidence.
The analysis reveals the complexity of vertical land motion, with both tectonic uplift and groundwater aquifer related subsidence contributing the imaged motions.
Between the San Andreas fault and Pacific coast, mountain uplift is spatially coherent and consistent with elastic strain accumulation on the region's thrust faults.
Consistency between the space geodetic observations (GPS and InSAR collected over <2 decades) with the
terrestrial techniques (leveling and tide gauges which have have been collected over many decades)
further suggest that the Western Transverse Ranges uplift signal is tectonic in origin.
Read more in the paper published in the
Journal of Geophysical Research - Solid Earth.
[November 5, 2017] - New Data Products Available from the Nevada Geodetic Laboratory!
Nevada Geodetic Lab would like to announce new public availability of over 34,000,000 station-days of tropospheric products (total zenith delay, north gradient, east gradient, every 5 minutes since 1996.0) from over 16,000 stations.The files have been integrated into our data product system and are available here: ftp://gneiss.nbmg.unr.edu/trop
Those of you familiar with our products already will know we have for many years produced position solutions for a variety of latencies and averaging intervals, from near real-time 5-minute solutions to final 24-hour solutions. These tropospheric products were generated in response to several user requests, and as an unplanned "deliverable of opportunity" for our Plug and Play Project in collaboration with UNAVCO which just came to an end.
Thanks to JPL/Caltech for providing the GIPSY software and orbit and clock products used to generate these solutions, and to the NASA ACCESS Program for support!
[October 30, 2017] - GPS Dark Matter Research Published in Nature Communications
GPS research embraces its dark side! A new paper, published today by a team of researchers from the Nevada Geodetic Laboratory and UNR Physics Department,
explores the utility of the GPS system of orbiting satellites to
contrain the properties of some of the most enigmatic constituents of the universe. While its existence
has been demonstrated, dark matter is incredibly difficult to detect and has never been seen directly with instruments on Earth.
Though no actual dark matter was detected, the new paper shows how the atomic clocks on the GPS satellites
are being used to place new constraints on dark matter's physical properties.
The authorship includes seven UNR co-authors, which include 2 faculty, a post doc, and students.
The manuscript is fully open access,
See also the
Nevada Today article,
and Geodetic Science Snapshot at UNAVCO.
[September 19, 2017] - Another large earthquake in Mexico!
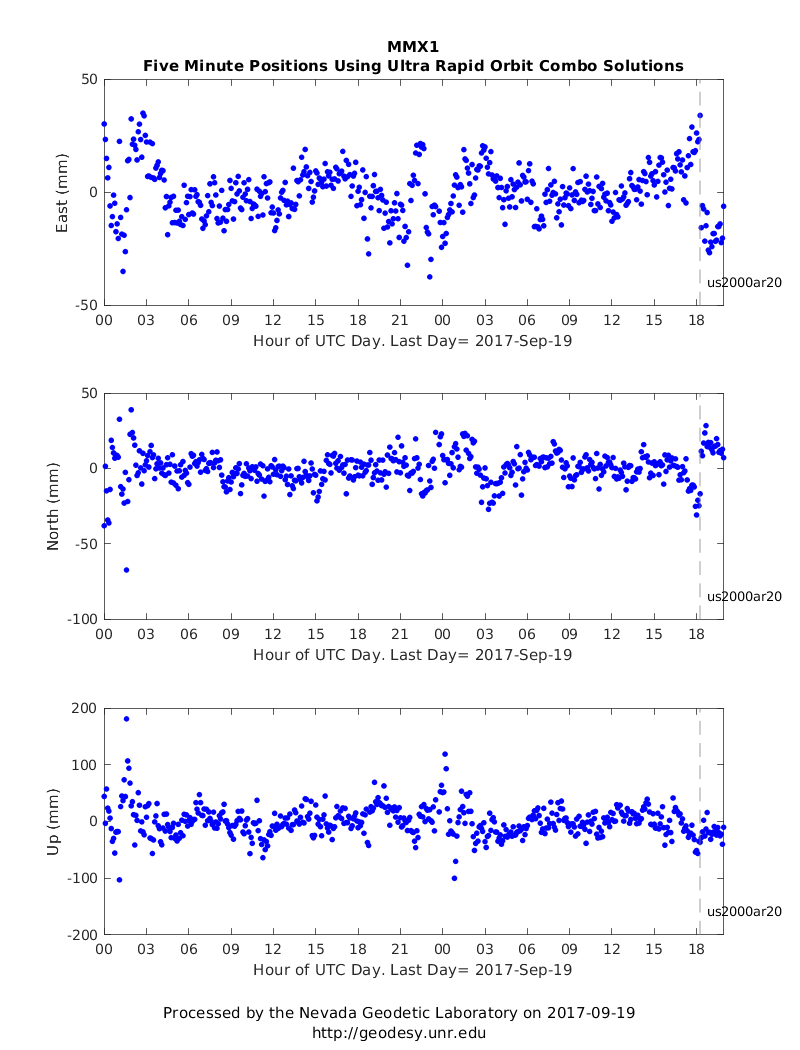
Today’s magnitude 7.1 event with epicenter near Raboso, Mexico caused serious shaking, destruction to buildings, and killed over 100 people. The earthquake also permanently shifted the Earth surface enough to offset GPS stations as far away from the epicenter as Mexico City. The plot below, for station MMX1 at the Mexico City airport, was generated using Ultra Rapid orbits from the Jet Propulsion Laboratory. It shows the station moved ~2.2 cm west and 1.6 cm north. These results used less than 2 hours of data after the earthquake as were available on our station webpages shortly thereafter.
Click on the figure for an up to date version of the time series plot. The vertical gray dashed line indicates the time of the event according to the USGS evenet page.
[September 10, 2017] Update on Pijijiapan Earthquake
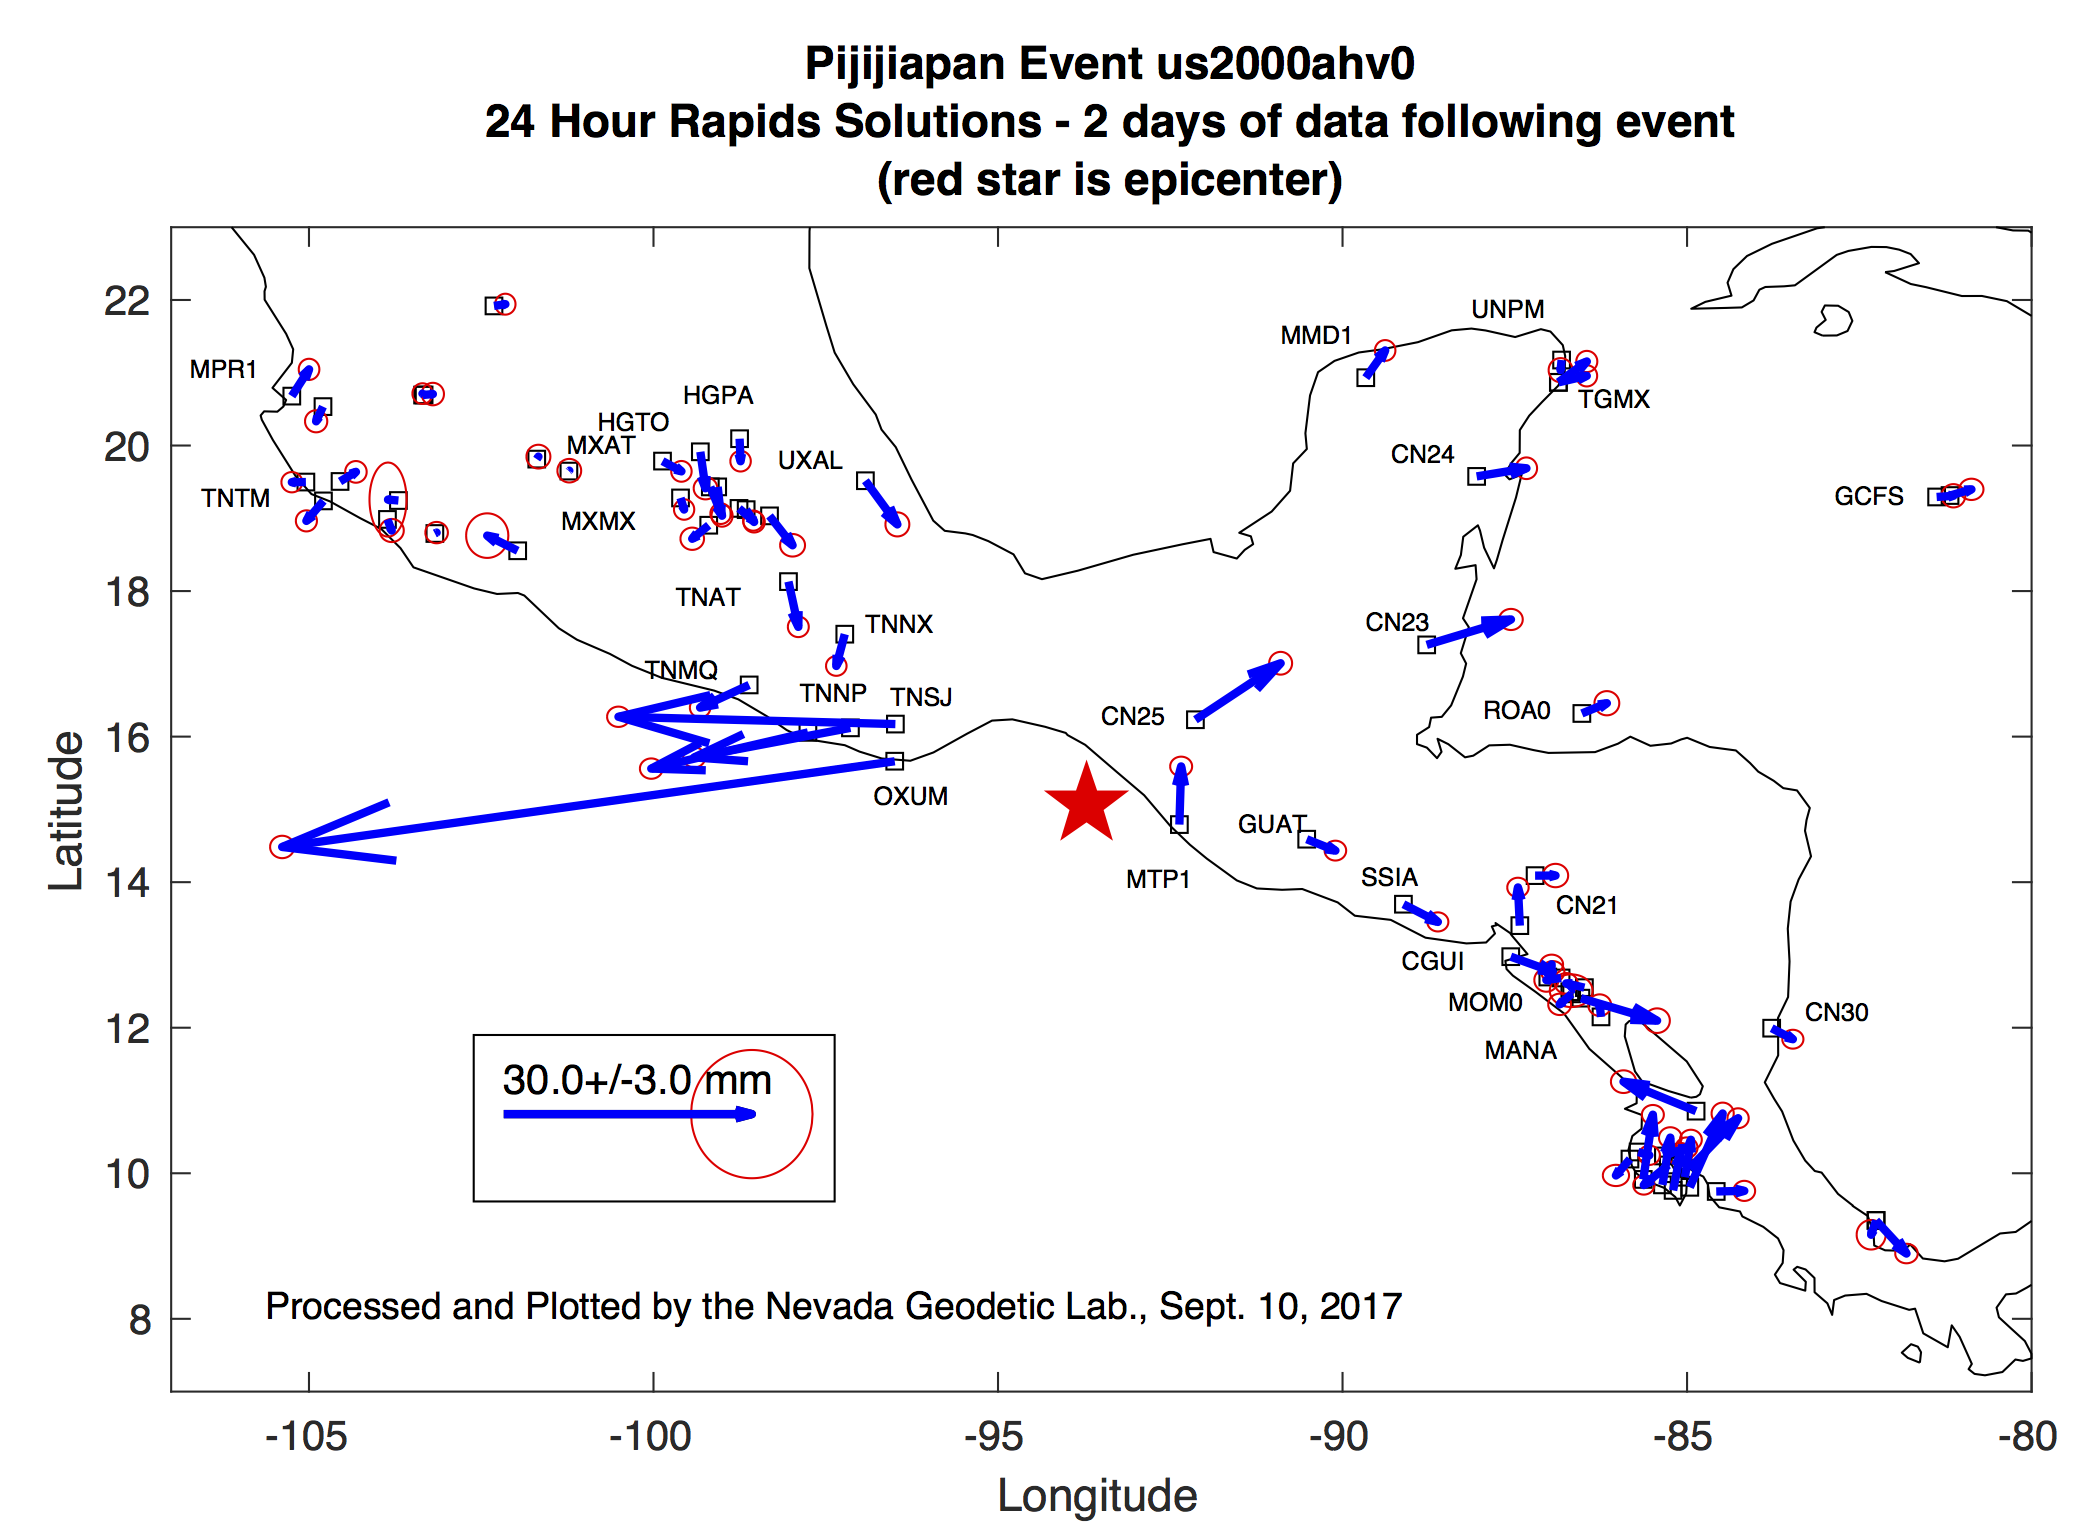
Since our post yesterday (see below) on the Earthquake in southern Mexico nearly two days of data have been acquired and processed at NGL using rapid orbits from JPL. Time series of 24 hour sample rate positions are providing a greater number of coseismic offsets with greater precision across southern Mexico, and northern Central America. The map below shows vector displacements of GPS stations based on two days of data after the event, compared to the median position of the station from the previous 10 days.
Significant offsets are observed as far east as the Yucatan Peninsula ~1000 km from the epicenter. The offsets show a clear pattern of east-west extension and north-south contraction consistent with the event having a normal-type slip mechanism. Selected station names are given. We used the data to generate a preliminary table of coseismic offsets.
Data used to generate this image were contributed by at least 15 different groups who operate networks and provide open access to GPS data. See this file for a list of data contributors.
[September 9, 2017] Great Earthquake and Tsunami Strike Chiapas and Oaxaca, Mexico
On September 7, 2017 23:49 local time (Sept. 8, 4:49 UTC) a magnitude 8.1 earthquake occurred offshore of the southern Mexican town of Pijijiapan. The event generated a tsunami with waves as high as 1.75 m that were recorded in Chiapas by the Pacific Tsunami Warning Center.
NGL performs daily processing of GPS data from over 8500 stations using rapid orbits from the Jet Propulsion Laboratory, with solutions generally available the following day. Ten stations within several hundred kilometers of the Pijijiapan epicenter provided data for which we were able to generate 5 minute sample rate displacement time series.
Several of these stations recorded significant coseismic offsets from the event. In southern Oaxaca west of the epicenter stations moved westward. The largest movement among these stations was OXUM which moved 7.0+/-0.6 cm westward.
Significant displacement northwest of the epicenter is consistent with
what appears from the USGS solutions to be a rupture that propagated northwest from the epicenter.
As more data comes in from GPS stations throughout the region, and processing continues, we will likely be able to obtain a greater number of displacement time series to constrain the slip that occurred in this event.
[May 15, 2017]
New Publication! In a collaboration between the Nevada Geodetic Laboratory and the UNR Mathematics and Statistics Department, Ilya Zaliapin and Corné Kreemer have revisited recent changes in global seismic moment release. Their analysis suggests that the energy released in great earthquaks varies significantly over decades of time, and is not time independent as suggested by some statistical models of earthquake recurrence. Their paper is called "Systematic fluctuations in the global seismic moment release" and has been accepted for Geophysical Research Letters.
[January 18, 2017]
Somewhere around January 4, 2017 our web server went read-only and files were static from that time forward. Upon reboot on January 17, 2017 the disk failed and maintenance was required that continued until January 18, 2017. The system is now restored, time series and plot files are now being refreshed. Thank you for your patience.
[November 13, 2016] Massive Earthquake in New Zealand.
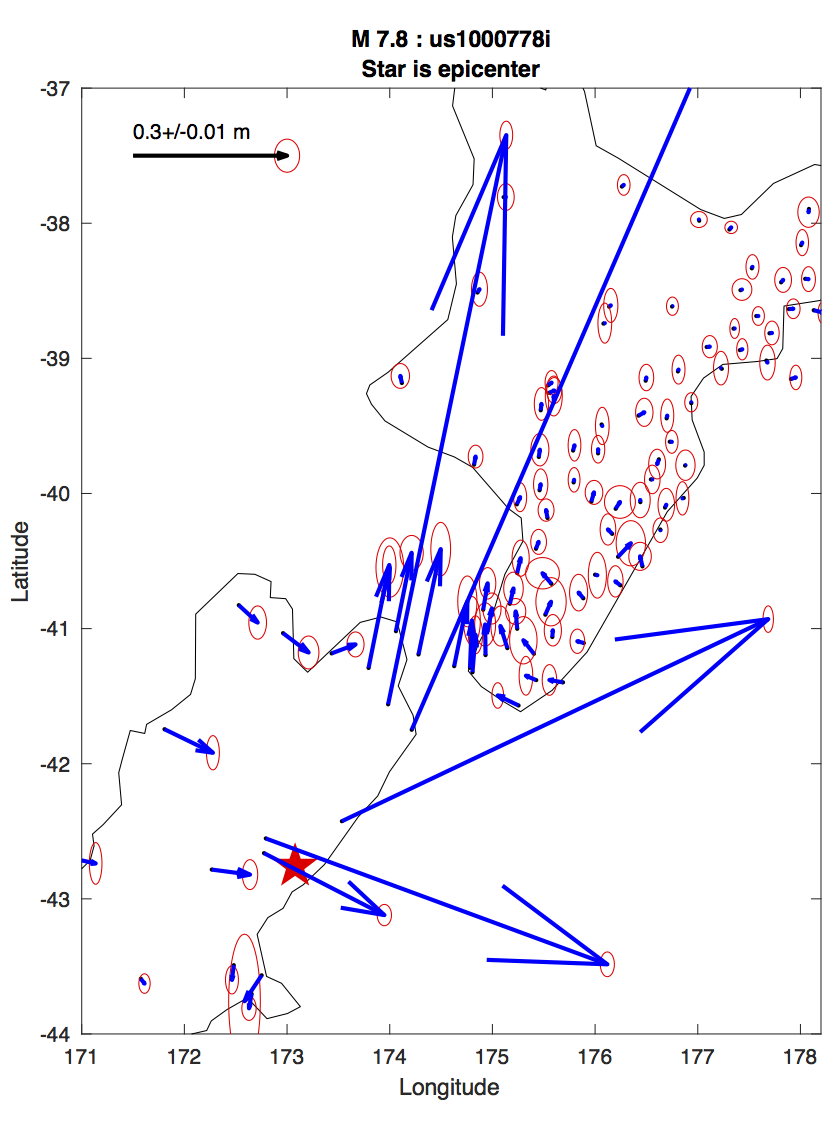
Earlier today,13 November 2016 at 11:02:57 UTC (23:02:57 their local time), a very powerful magnitude 7.8 earthquake rocked New Zealand, south of Wellington. The Nevada Geodetic Laboratory was able to access data from 118 continuously recording GPS stations on the island and estimate coseismic displacements within hours after the event using ultra-rapid orbits from the Jet Propulsion Laboratory. A figure showing a sample of the offsets is given below. The maximum displacements we found with GPS are at station CMBL near Clifford Bay, 1.3 meters east, 2.3 meters north, and 0.9 meters upward. We used the GPS data to make a table of rapidly produced offsets.
While the displacements are very large, they continue to grow as we get more data hour by hour. This likely indicates that a slow but active afterslip on the fault plane, and/or possibly other physical relaxation mechanisms, continue to progress. These observations, along with a continuing sequence of aftershocks, indicates that the crust is still adjusting and evolving as part of this earthquake deformation event. Only GPS stations north of the rupture were strongly affected, which supports seismological evidence that the earthquake ruptured the crust north of the epicenter, where most of the ground shaking occured.
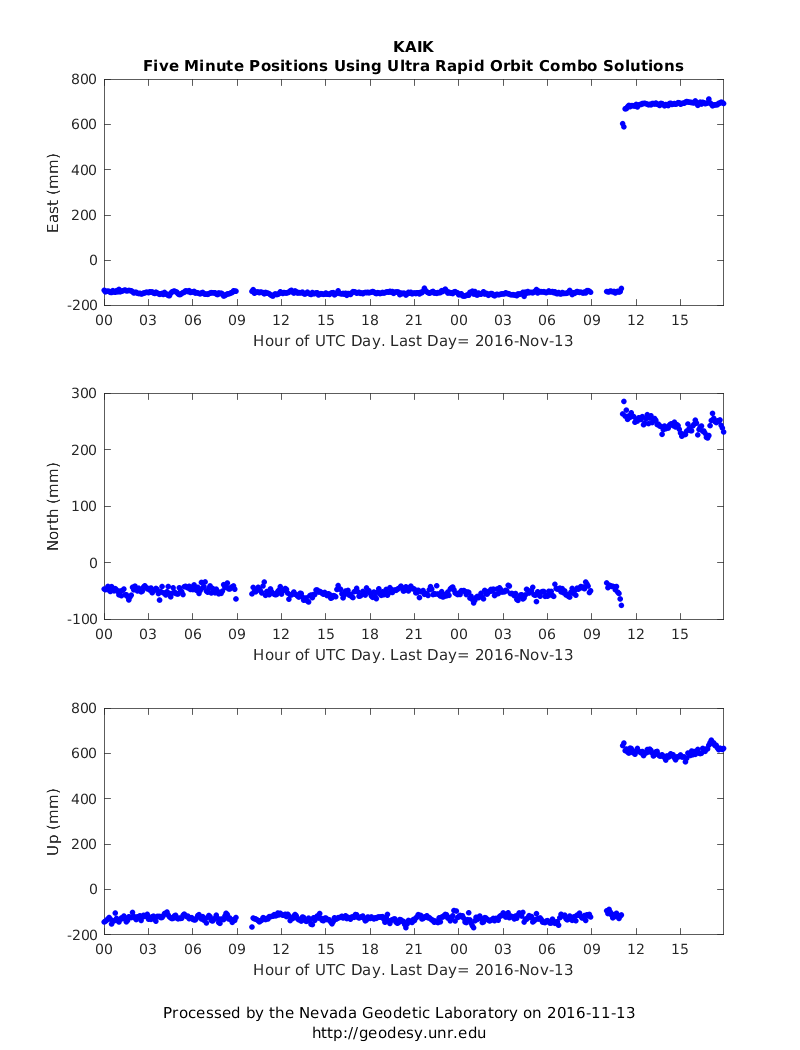
The figure below shows a time series of 5 minute solutions for station KAIK, which had some of the largest displacements.
[October 12, 2016] New Paper: GPS Imaging of Sierra Nevada Uplift
Our new paper in JGR Solid Earth shows how our new analysis technique called "GPS Imaging" clarifies
the signal of vertical land motion in Nevada and California.
Using data from high precision GPS networks we resolve rates and patterns of uplift and subsidence in unprecedented detail.
The technique filters the data to enhance underlying signals of vertical movement of the deep solid Earth, which have significance for processes such as mountain growth, earthquake cycle deformation, mantle flow, hydrological mass loading and magmatic systems.
A draft of the Hammond et al., 2016 manuscript is now available online with open access here:
JGR. Figure 6D from the article below shows the patterns of vertical motion superimposed on the topography. The colors represent vertical rate of the crust (in mm/yr), red up, blue down.

This article was given an Editors’ Highlight at JGR:
"This is the first paper to present such a comprehensive and precise vertical velocity field for a major section of the western United States (Lower 48). It highlights an exciting new method and presents an enormous data set along with its implications. There is a huge amount of data shown in the paper, and there are very interesting implications related to climate change and anthropogenic activity."
[August 29, 2016] M6.2 Earthquake in Central Italy
On August 24, 2016 an M6.2 earthquake hit central Italy near the towns of Norcia and Amatrice causing destruction and loss of ~300 lives. NGL has been routinely processing GPS data from many stations surrounding the effected area. Precise displacements of the solid Earth attributeable to this earthquake have been estimated using rapid orbits from JPL. The plot below shows the differenece in median station position 6 days before and up to 4 days after then event.
The largest offsets are seen at stations NRCI and LNSS which were nearest to the epicenter and moved to the southwest. The pattern of displacement is consistent with a normal faulting event with extension in a SW-NE direction. We used the GPS time series to calculate a preliminary table of coseismic offsets.
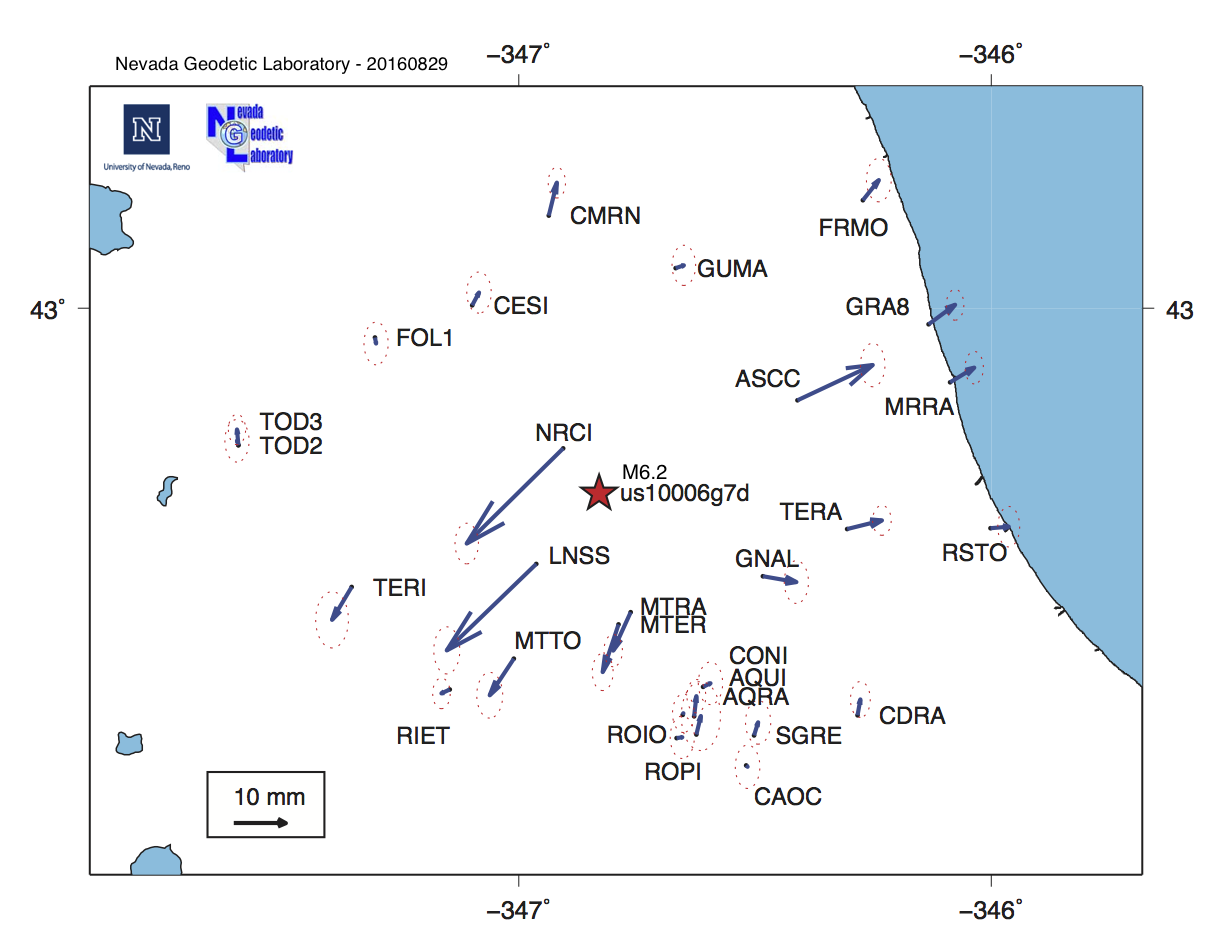
We obtained data from stations CAOC, CESI, CONI, GNAL, GUMA, LNSS, MTER, MTTO, ROPI, RSTO, SGRE from the RING network INGV Rome, Italy. Station AQUI from the Euref network. AQRA, CDRA, MRRA, MTRA are from S.I.T.T. Regione Abruzzo. Stations ASCC, CMRN, FOL1, FRMO, GRA8, NRCI, ROIO, TOD2, and TOD3 are from ItalPOS. Stations RIET, TERA, TERI are from the Rete Dinamica Nazionale.
[June 25, 2016] New Publication: Assessing the impact of vertical land motion on 20th century global mean sea level rise
Our new paper in The Journal of Geophysical Research - Oceans [Hamlington et al., 2016] documents the effect of vertical land motion (VLM) as seen throgh the global GPS network has on estimates of global mean sea level (GMSL) rise.
We applied our new GPS Imaging technique to assess the impact of VLM not associated with glacial isostaic adjustment (GIA) on GMSL. Non-GIA VLM results from plate tectonic interactions, matle flow and other processes that change surface elevation slowly over time. We use GPS Imaging to estimate VLM at over 1400 tide gauges, and compare it to estimates from GIA models.
We found that after correcting for GIA effects the tide gauges are on average experiencing positive uplift resulting in an net increase of the GMSL rise estimate by 0.24 +/- 0.08 mm per year. While this result is likely dependent on the subset of tide gauges used and other factors in the corrections, it suggests that non-GIA VLM plays a significant role in 20th century estimates of GMSL.
[June 21, 2016] New Publication: Pre- and post-seismic deformation related to the 2015, Mw7.8 Gorkha earthquake, Nepal
A new paper in Tectonophysics [Gualandi et al., 2016] details an analysis that separates the signals of hydrological loading and tectonics, and solves for the deep alfterslip that occurred following the Gorkha earthquake in Nepal. The results show that in the first 7 months after the event ~15% of the total deformation moment was afterslip, and about 77% of the afterslip moment was silent (not seen in the aftershocks). The paper is open access.[February 23, 2016] New Publication on Deformation and Faulting in the Central Walker Lane
We have published a new study that clarifies how normal faulting, strike slip faulting, and crustal block rotations work together to accommmodate tectonic deformation within the Central Walker Lane. The manuscript by Jayne Bormann et al. was published in the Earth and Planetary Science Letters, and is now available at the EPSL website.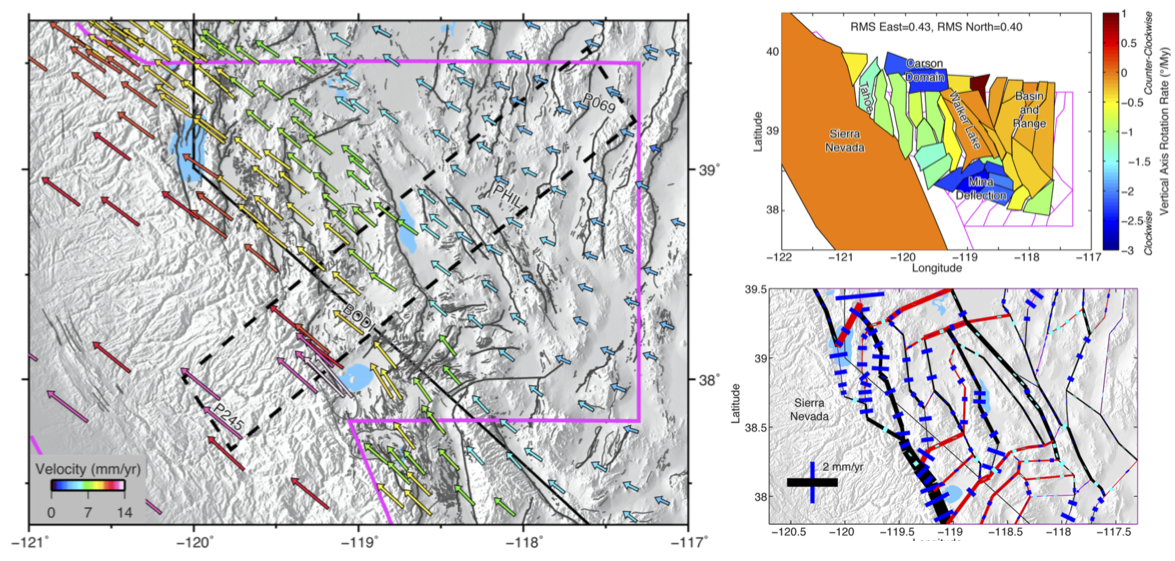
[February 18, 2016] New Publication and Velocity Fields Available!
We have published a new manuscript in the Journal of Geophysical Research on the MIDAS robust trend estimator. The paper by Blewitt, Kreemer, Hammond, and Gazeaux documents the algorithm used to generate our new online velocity fields. These velocity fields are updated weekly and are available in our data products area (see right side of this page). The manuscript is open access.[December 14, 2015] New Steps Database Product Available!
We have released an online database of potential step discontinuities in GPS time series. Information from IGS site logs is used to generate lists of equipment discontinuities. Earthquake data from the USGS is used to mark times of possible earthquake-related steps down to magnitude 5.0. Hyperlinked text tables are now at the bottom of every station page. See the master list and a README file for more information.[October, 2015] A wave of new papers published by the Nevada Geodetic Lab!
A new set of peer-reviewed publications with authors from NGL have recently become available:- Donnellan, A., L. Grant Ludwig, J.W. Parker, J. B. Rundle, J. Wang, M. Pierce, G. Blewitt, and S. Hensley, 2015, Potential for a large earthquake near Los Angeles inferred from the 2014 La Habra earthquake, Earth and Space Science, 2, doi:10.1002/2015EA000113.
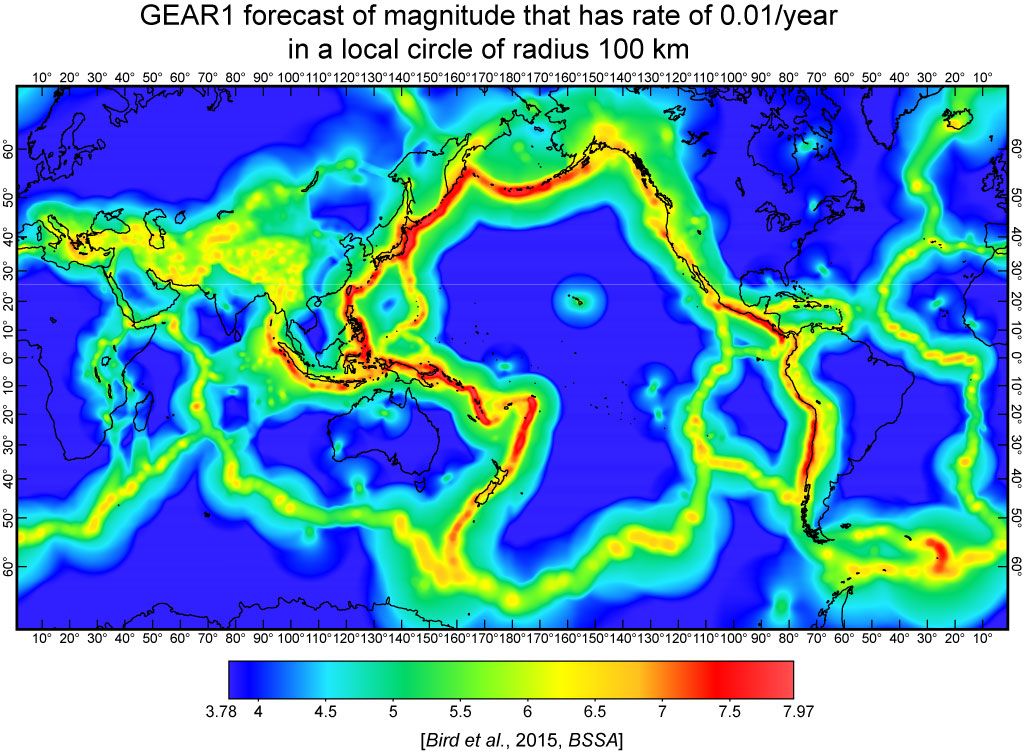
- Bird, P., D.D. Jackson, Y.Y. Kagan, C. Kreemer, and R.S. Stein, 2015. GEAR1: A Global Earthquake Activity Rate model constructed from geodetic strain rates and smoothed seismicity,
Bulletin of the Seismological Society of America, 105, 2538-2554.
-
Keiding, M., C. Kreemer, C.D. Lindholm, S. Gradmann, O. Olesen and H.P. Kierulf, 2015. A comparison of strain rates and seismicity for Fennoscandia: depth dependency of deformation from glacial isostatic adjustment
Geophysical Journal International, 202, 1021-1028.
- Aster, R, M. Simons, R. Burgmann, N. Gomez, W.C. Hammond, S. Holbrook, E. Chaussard, L. Stearns, G. Egbert, J. Hole, T. Lay, S. McNutt, M. Oskin, B. Schmandt, D. Schmidt, J. Vidale, L. Wagner, P. Winberry, 2015,
Future geophysical facilities required to address grand challenges in the Earth sciences, A Community report to the National Science Foundation.
- Blewitt, 2015, GPS and space-based geodetic methods, in
Treatise in Geophysics, ed. G. Schubert, 307-333, Elsevier,doi:10.1016/B978-0-444-53802-4.00060-9.
- Blewitt, 2015, Terrestrial reference frame requirements for studies of geodynamics and climate change,
International Association of Geodesy Symposia, 1-8, doi:10.1007/1345_2015_142.
- Bird, P., and C. Kreemer, 2015. Revised tectonic forecast of global shallow seismicity based on version 2.1 of the Global Strain Rate Map.
Bulletin of the Seismological Society of America, 105, 152-166.
- Melgar, D., J. Geng, B.W. Crowell, J.S. Haase, W.C. Hammond, Y. Bock, R.M. Allen, 2015, Seismogeodesy of the 2014 Mw6.1 Napa, California, Earthquake: Rapid response and modeling of fast rupture on a dipping strike-slip fault,
Journal of Geophysical Research - Solid Earth, 120, doi:10.1029/2015JB011921.
See, for example new results in Bird et al., 2015 . Here the GEAR1 forecast is for years 2014 and after, representing the magnitude forecast rate of 1% per year within a local circle of radius 100 km about each point.
[May 30, 2015] Geoff Blewitt elected President of IAG Commission 1: Reference Frames
The National Delegates of the International Association of Geodesy have voted Geoff to be President of Commission 1: Reference Frames. This organization defines and redefines longitude, latitude, and height that are of primary importance for much Earth science based research and applications, satelite navigation as well as for practical applications in geo-information. For more information on the commission see this link.Congratulations, Geoff!
[November 18, 2014] New Global Strain Rate Model published in G-cubed.
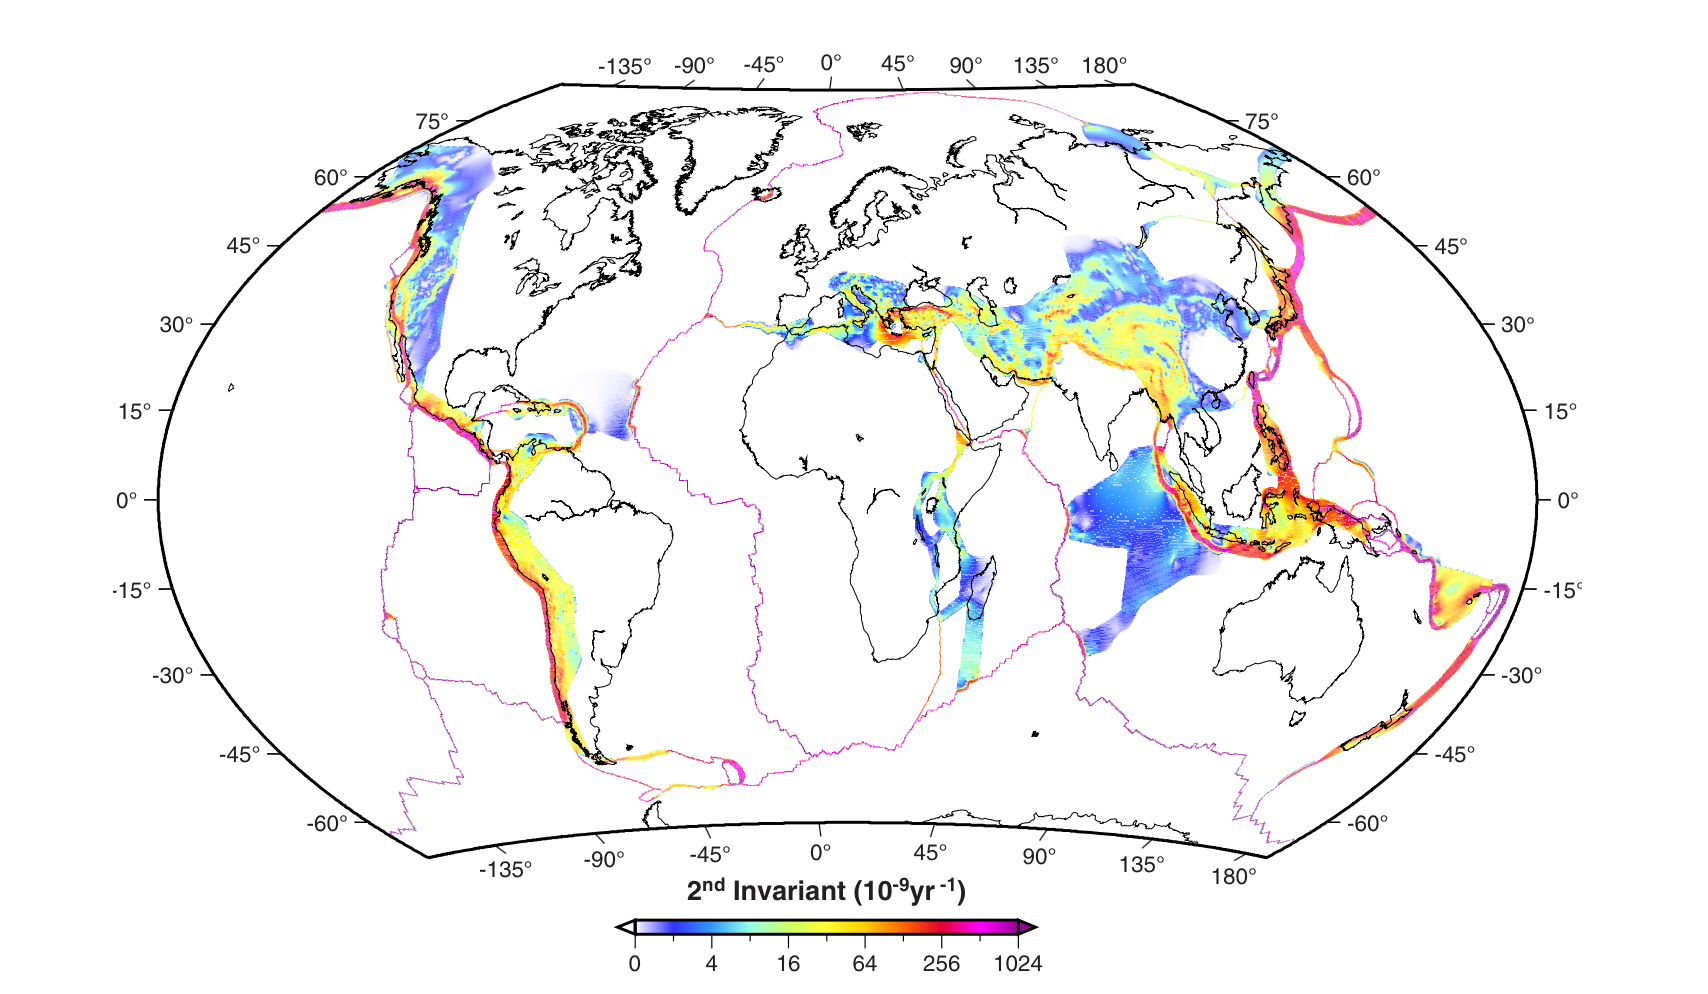
The cover of this month's issue of G-cubed shows this figure with contours of the second invariant of strain rate from the new Global Strain Rate Model (v. 2.1). The model is based on 22,415 horizontal geodetic velocities, 6705 of which were determined by the Nevada Geodetic Laboratory, the rest are from the literature. Non-linear color scale is saturated at high values. White areas were assumed to be rigid plates and no strain rates were calculated there. Instead, the rigid body rotation of these plates was imposed as boundary conditions when solving for plate boundary strain rates.
Kreemer, C., G. Blewitt, E.C. Klein, 2014, A geodetic plate motion and Global Strain Rate Model,
Geochemistry, Geophysics, Geosystems, 15, 3849-3889, doi:10.1002/2014GC005407.
Files of Interest
[October 14, 2014] Geoff Blewitt Honored with Vening Meinesz Medal
Geoff has been awarded the Vening Meinesz Medal for 2015. The medal was established by the European Geosciences Union Division of Geodesy and is the highest award offered in Europe that recognizes distinguished research in Geodesy. The official announcement of the medal recipients was posted on October 13, 2014. See also this description of the medal and a list of past recipients.
Congratulations Geoff!!
[October 10, 2014] Bill Hammond Elected Secretary of AGU Geodesy Section
Bill will serve a two year term as Secretary. See The AGU Elections Page for this year's results.
[August 25, 2014, 4pm PDT] M6.1 American Canyon earthquake seen in next day rapid GPS results
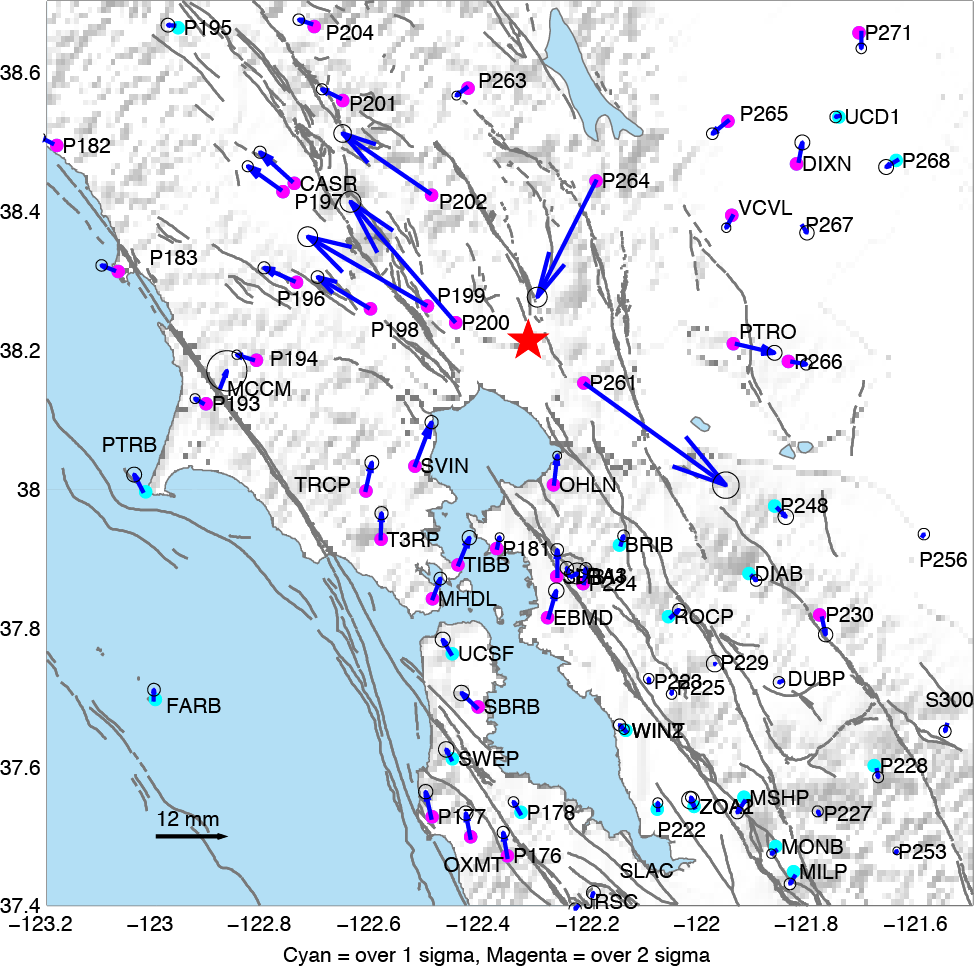
On August 24, 2014 at 3:20 am Pacific time a magnitude 6.1 earthquake struck the northern San Francisco Bay Area, near American Canyon and Napa California. By the next day, August 25 at 9:00 am we had estimated coseismic displacements, i.e. the amount the earth permanently shifted during the earthquake. Because continuously recording GPS stations are located on both sides of the fault these measurements can help to quickly identify which fault slipped, providing an independent corrobortion that it was likely the West Napa Fault Zone that activated during the earthquake.
See the NGL low-latency earthquake geodesy page for this event for more information.
[August 15, 2014] Paper published by Corné Kreemer in Geology
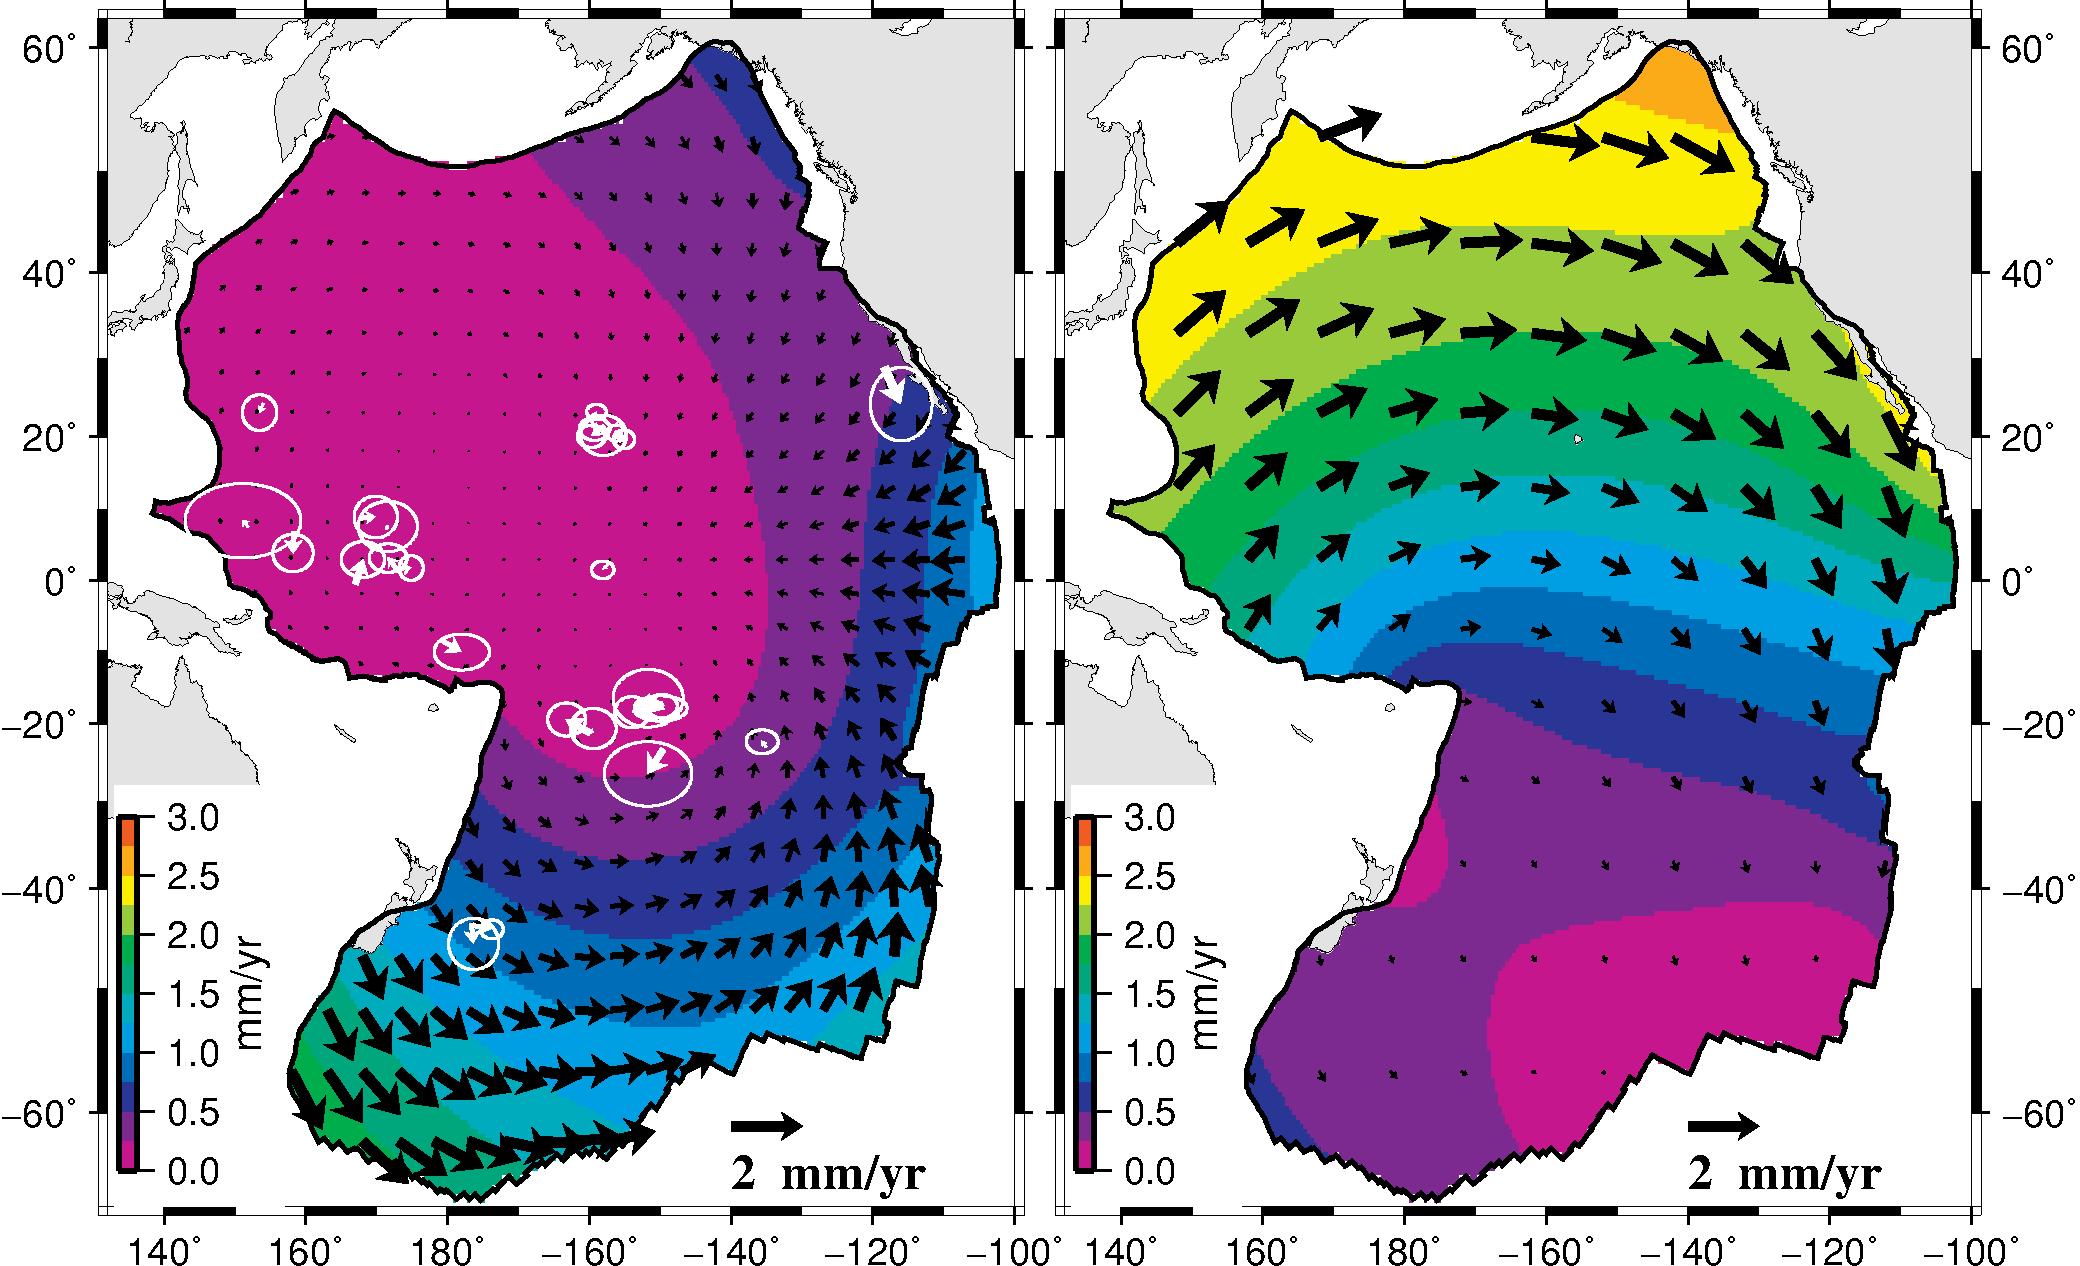
Plate tectonics is one of the universal theories in Earth science that people have learned about in school. We challenge here a fundamental part of this theory: that the plates are rigid. Plate rigidity is plate tectonics' central approximation and gives the theory its rigor and predictive power. This study predicts and quantifies significant deformation within the young parts of the Pacific plate by assuming that the plate must contract horizontally due to the cooling of the plate as it moves away from its adjacent spreading centers. Thus one cannot assume that parts of the plate near the Pacific-Antarctic spreading center move rigidly with parts off the coast of California. Estimates of the relative motion between the Pacific and North America from sea-floor data in the south Pacific and Atlantic oceans differs by 5 mm/yr from direct observations, and this study can explain about half of this difference (the remainder may come from deformation of the oceanic parts of other plates). We find that the implied deformation in the Pacific plate has the same spatial distribution as the locations of earthquakes, which suggests that thermal contraction is (at least, partly) released seismically and improves our understanding of the cause of those enigmatic earthquakes.Read more in the Kreemer and Gordon, 2014 article:
[May 14, 2014] Human-Induced Uplift of the Sierra Nevada in Nature
The Nevada Geodetic Laboratory has collaborated with scientists at Western Washington University, U.C. Berkeley and the University of Ottowa to publish a study on human-induced rise of the Sierra Nevada in Southern California. Uplift of 1-3 mm/yr can be attributed to elastic rebound following massive pumping of groundwater in the southern Great Valley. The unburdening flexes the lithosphere and helps explain observed trends and annual variations in seismicity on portions of the San Andreas Fault.The article (Amos et al., 2014) was published in the journal Nature and is also discussed in a News and Views piece Fertile Fields for Seismicity by Paul Lundgren of JPL.
The detailed analyses is part of a National Science Foundation (NSF) funded research project awarded to Blewitt and Hammond.
[April 21, 2014] Bill Hammond receives the 2013 Editor's Choice Citation for Excellence in Refereeing for his service to the Journal of Geophysical Research-Solid Earth.
Congrats, Bill! See page 5 of the Eos article.
[March, 9 2014] The Ferndale, California offshore earthquake permanently displaced the coast by as much as ~15 mm to the east.
Though the event occurred nearly 80 km west of the coast, rapidly processed GPS solutions with 5 minutes sample interval show significant displacement at EarthScope Plate Boundary Observatory stations P159, P160, P161, P162. The plots below show changes in position of the GPS stations from this strike slip event.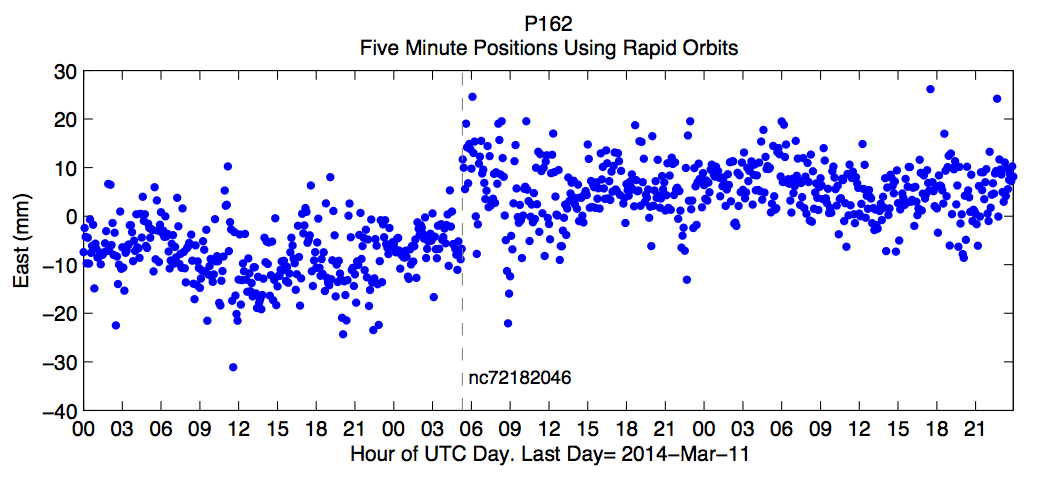 Similar plots for P161, P160, and P159 (click to enlarge):
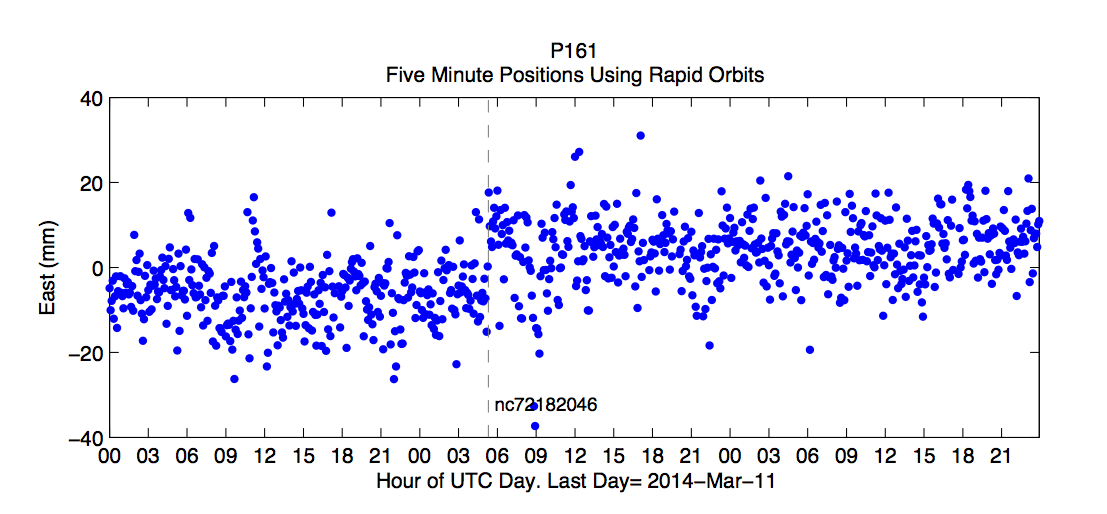
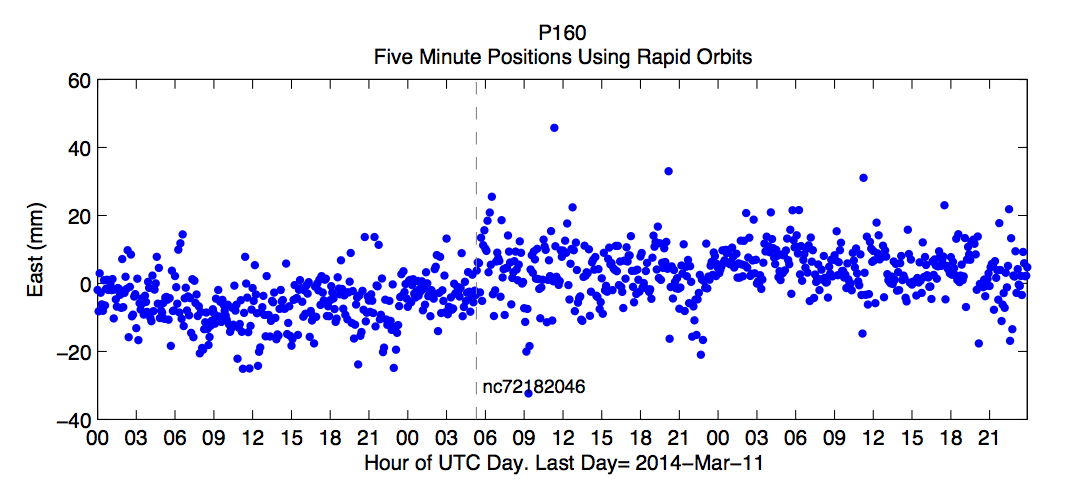
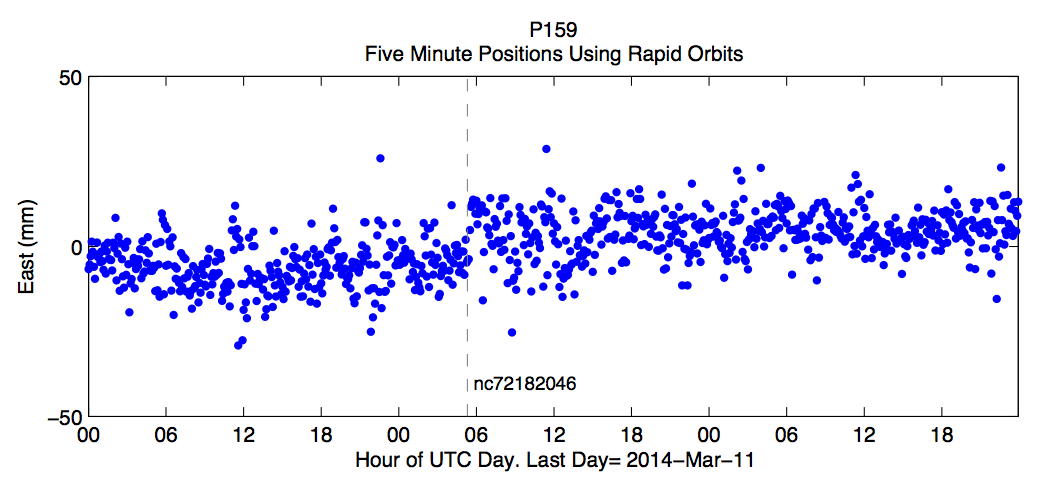
More information at the NGL station pages for: P159, P160, P161, P162.
1 Hz displacements are shown in the analysis by Rongxin Fang (visiting scholar at NGL) for stations P058, P159, P160, P161, P169, using the PANDA software. In this analysis satelllite orbits and clocks are estimated in simulated real-time. Permanent offsets are visible within about 5 minutes of the event time (shown with red dashed line):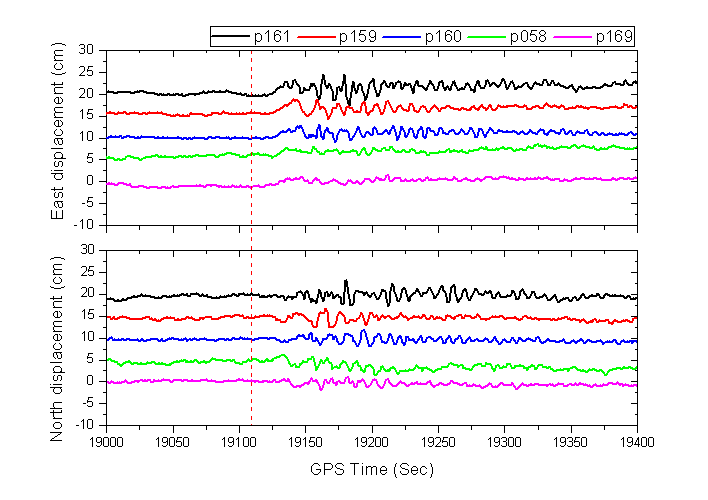 More information about this earthquake is available from the
USGS.
Original data are available from:
UNAVCO, Inc..
GPS data processing at NGL is supported NASA and the NSF. See
our Acknowledgements page.
More information about this earthquake is available from the
USGS.
Original data are available from:
UNAVCO, Inc..
GPS data processing at NGL is supported NASA and the NSF. See
our Acknowledgements page.
[December, 2013] We have developed a new North America plate fixed terrestrial reference frame for geodetic studies of crustal deformation.
The paper is published by Geoff Blewitt in the Journal of Geodynamics .[May 5, 2013] Corné Kreemer nominated as EarthScope Series Speaker.
EarthScope speakers are selected based on their outstanding research accomplishments involving the NSF EarthScope facility as well as their abilities to engage a variety of audiences. Corné Kreemer will join the ranks of this prestigious group for the 2013-2014 series.
More information on the EarthScope Speaker Series.
[October 16, 2012] Geoffrey Blewitt elected AGU Geodesy Section President.
As President of the Geodesy Section, Professor Blewitt will serve a two year term as President Elect starting January 1, 2013, then 2 years as President. The American Geophysical Union has over 61,000 members from over 146 countries.
[September 12, 2012] NGL's work featured as Science Snapshot at UNAVCO's Web page
NGL identified the need for the geodesy community to create a modeling framework that would integrate data archives, data analysis tools, and modeling software and provide access to these elements through a "Geodesy Community Workbench." A poster describing the Geodesy Community Workbench was presented at the recent UNAVCO Science Workshop, and this poster is featured as a Science Snapshot on UNAVCO's Web page. Read more ...
[July 20, 2012] NGL publishes map of geodetic strain rates in western U.S.
We just published an official NBMG map showing GPS velocities and an associated strain rate model for the Pacific-North American plate boundary, western U.S.
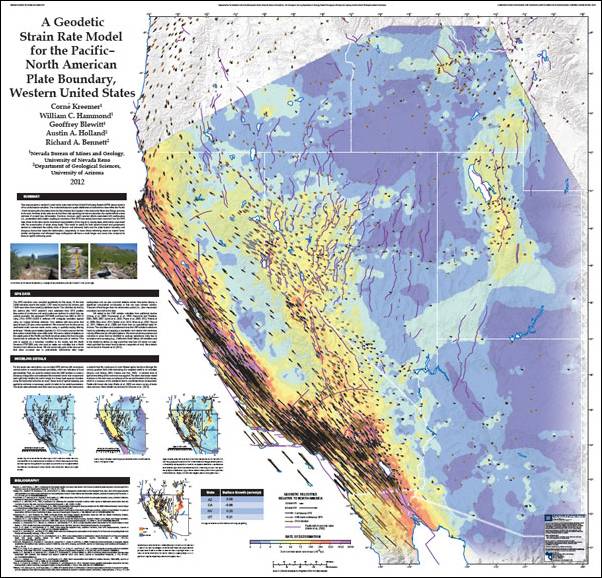
A free full-size PDF or paper versions can be found or ordered at
NBMG publications store.
[May 3, 2012] NGL publishes paper on Sierra Nevada uplift
The Sierra Nevada range in California and Nevada is actively uplifing at a rate of 1 to 2 mm/yr. Geodetic measurments based on over 10 years of GPS and InSAR data show that mountain growth can be observed directly, and help show that the Sierra Nevada topography is relatively young in geologic terms.The results are due to be published in the July, 2012 issue of Geology.
Access the full manuscript,
and read the UNR press release.
Also see stories at San Francisco Chronicle, OurAmazingPlanet.com, and Yahoo.[April 24, 2012] NASA uses NGL technology in GPS earthquake monitoring system
GPS technology developed and implemented at the University of Nevada, Reno will be the centerpiece of a major test this year by NASA to pinpoint the location and magnitude of strong earthquakes along the West Coast of the United States. The project was announced by NASA today.
Read the UNR press release and the NASA story.
[April 2, 2011] NBMG response to UNR administration and testimony to Nevada Legislators available
NBMG faculty and classified staff have prepared a document in response to the University of Nevada, Reno curricular review proposal. This document is available in .pdf format on the NBMG website, http://www.nbmg.unr.edu or directly at http://www.nbmg.unr.edu/_docs/Response_to_curricular_review_of_NBMG.pdf.
In addition to the response document, testimony from NBMG Director and State Geologist, Jon Price, was presented on April 1, 2011 before the Senate Finance and Assembly Ways and Means Joint Subcommittee on K-12 Education/Higher Education. This testimony is also available on the NBMG website or directly at http://www.nbmg.unr.edu/_docs/TESTIMONYbyJonPrice31March2011.pdf.
[March 29, 2011] Worldwide recognition and support for NBMG and NGL ...
As a reaction to the proposed disproportional cut of more than 50% of the state-funded budget of NBMG, more than 110 letters of support for NBMG were sent to the UNR President from national and international agencies, universities, and individuals. Read selected quotes ...; Read more quotes ...; see overview of all letters.
[March 20, 2011] Proposed disproportional budget cut of more than 50% darkens the future for NBMG and NGL ...
As a consequence of the dire economic situation in Nevada, the Nevada System of Higher Education faces a cut of the state-funded budget of more than 30%. In order to meet the budget cut requested by the Nevada legislator, the President of UNR has proposed to cut the budget of NBMG disproportionally by more than 50%. Such a cut would take away the economic basis for NBMG to provide mandated services for Nevada. The cut would also reduce the ability of NBMG to win external grants and have a significant negative impact on the overall UNR budget and the economy of Nevada.
[March 15, 2011] Tohoku-Oki Earthquake, Japan M9.0: Geodetic Information
A devastating earthquake struck northeast Japan March 11, 2011 at 05:46:23 UTC. NGL has collaborated with NASA and JPL to develop prototype tsunami warning systems based on GPS. See this page for more about this event.
[January 16, 2011] NGL in Science Magazine News Focus
See AGU Fall Meeting Highlights news focus on Hammond et al. 2010 presentation on Sierra Nevada Uplift in Science, v. 331, p. 143, January 14, 2011 .
[January 15, 2011] Paper on Northern Walker Lane GPS and Block Modeling published:
A new study has been published in the Journal of Geophyscial Research: "Block Modeling of Crustal Deformation of the Northern Walker Lane and Basin and Range from GPS Velocities". Here we have used geodetic and geologic data to evaluate fault slip rates in this zone of complex crustal deformation. See Hammond et al., 2011 article.
[December 1, 2010] Corné Kreemer wins AGU Award:
Group member Corné Kreemer has won the 2010 Geodesy Section Award from the American Geophysical Union (AGU). The Award is given each year to an AGU member under the age of 40 who shows the potential to become an AGU Fellow in the future. The Award is given in recognition of major advances in geodesy, and Corné was particularly honored for his work on the Global Strain Rate Map. See more about Corné in this Nevada Today article .
[November 10, 2010] National Academies Report on Precise Geodetic Infrastructure published:
A National Academies Report has been published, co-authored by Geoff Blewitt of NGL:
Recognizing the growing reliance of a wide range of scientific and societal endeavors on infrastructure for precise geodesy, and recognizing geodetic infrastructure as a shared national resource, this book provides an independent assessment of the benefits provided by geodetic observations and networks, as well as a plan for the future development and support of the infrastructure needed to meet the demand for increasingly greater precision. Precise Geodetic Infrastructure makes a series of focused recommendations for upgrading and improving specific elements of the infrastructure, for enhancing the role of the United States in international geodetic services, for evaluating the requirements for a geodetic workforce for the coming decades, and for providing national coordination and advocacy for the various agencies and organizations that contribute to the geodetic infrastructure.
Reference: Minster, J.B., Z. Altamimi, G. Blewitt, W.E. Carter, A. Cazenave, H. Dragert, T.A. Herring, K.M. Larson, J.C. Ries, D.T. Sandwell, J.M. Wahr, and J.L. Davis (2010). Precise Geodetic Infrastructure: National Requirements for a Shared Resource, 142 pp. The National Academies Press, ISBN-10:0-309-15811-7, ISBN-13: 978-0-309-15811-4.
[May 6, 2010] Active Shear Zone in Southern Nevada:
We combined GPS velocities and earthquake focal mechanisms to suggest that there exists an E-W trending sinistral shear zone in southern Nevada (Kreemer et al., 2010). This Pahranagat shear zone accommodates 2 mm/yr near the Nevada-Utah border and less to the west. The shear zone is a transfer zone between rigid crust to the north and diffusily extending crust to its south, and is a natural connection between the Wasatch fault zone and the Eastern California Shear Zone.
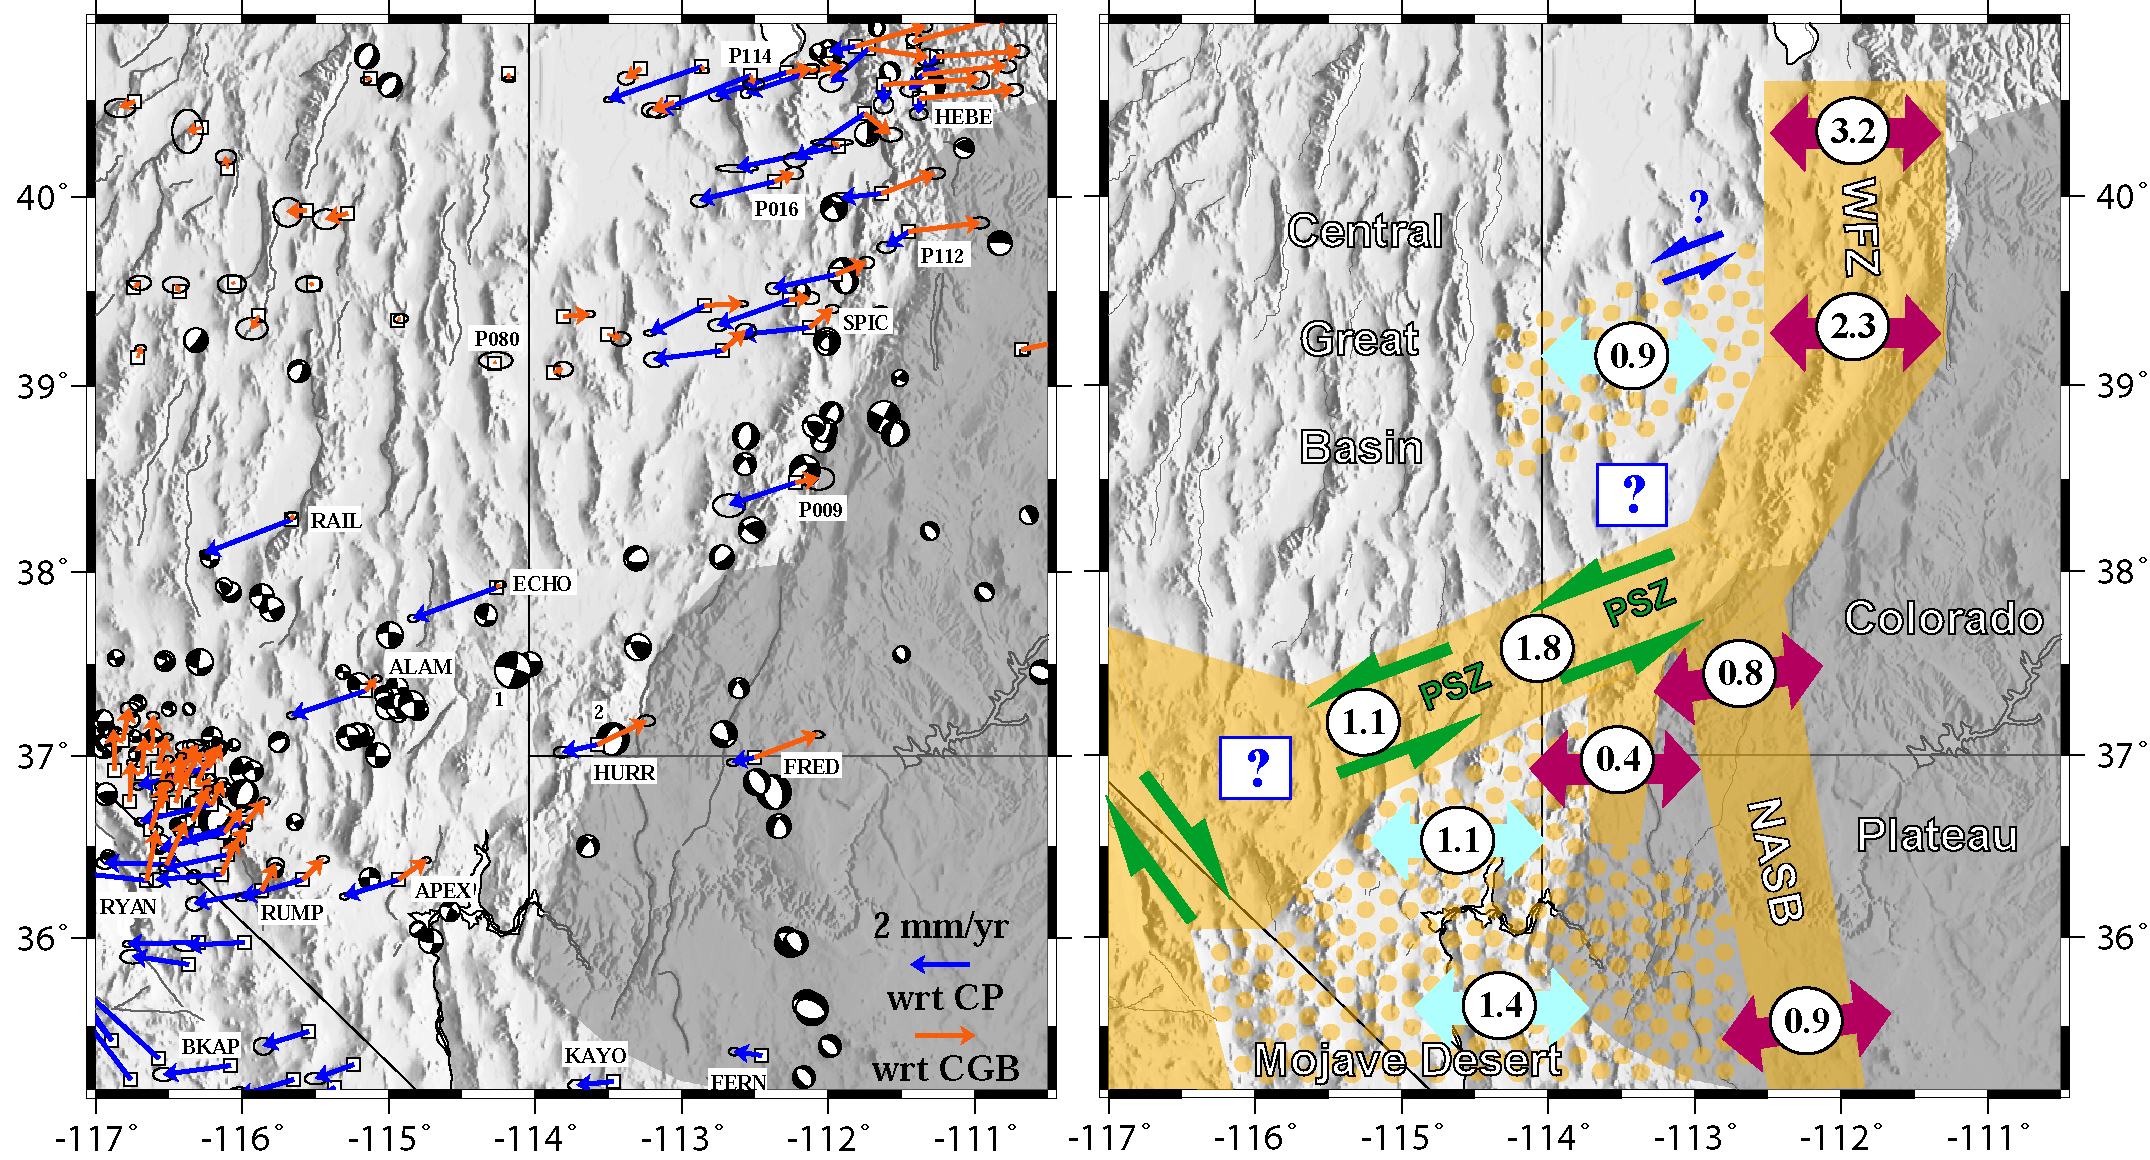
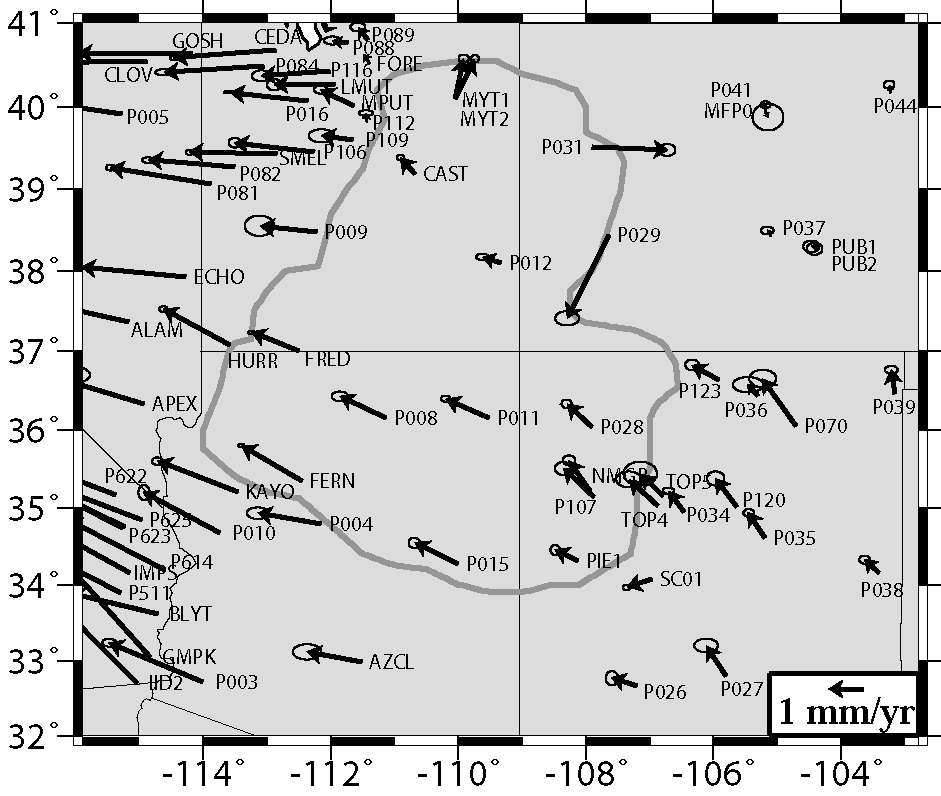
[May 4, 2010] Colorado Plateau Motion and Deformation
We analyzed data from continuous GPS sites in the Southwest U.S. and derived the very small motions relative to stable North America (Kreemer et al., 2010). We show that the central part of the Plateau rotates as a rigid entity around a pole in the northern Rockies, but that the western and eastern margins of the plateaus show active extension.
Read the blog after our 2010 AGU talk.
[April 15, 2010] Yucca Mountain Postseismic Relaxation:
A study of GPS data from sites around Yucca Mountain, Nevada shows how postseismic relaxation from distant earthquakes can affect estimates of long-term strain rates (Hammond et al., 2010). These effects can cause strain GPS rates to change over time, and have important implications for tectonic interpretation and seismic hazard analysis.
[October 10, 2009] New Absolute Plate Motion Model:
We published a new absolute plate motion model (GSRM-APM-1) that is not derived from hotspot data, but from an alignment of present-day surface motions to mantle anisotropy orientations. You can find more information in Kreemer (2009). The figure below shows the GSRM-APM-1 velocities as well as Euler pole locations.
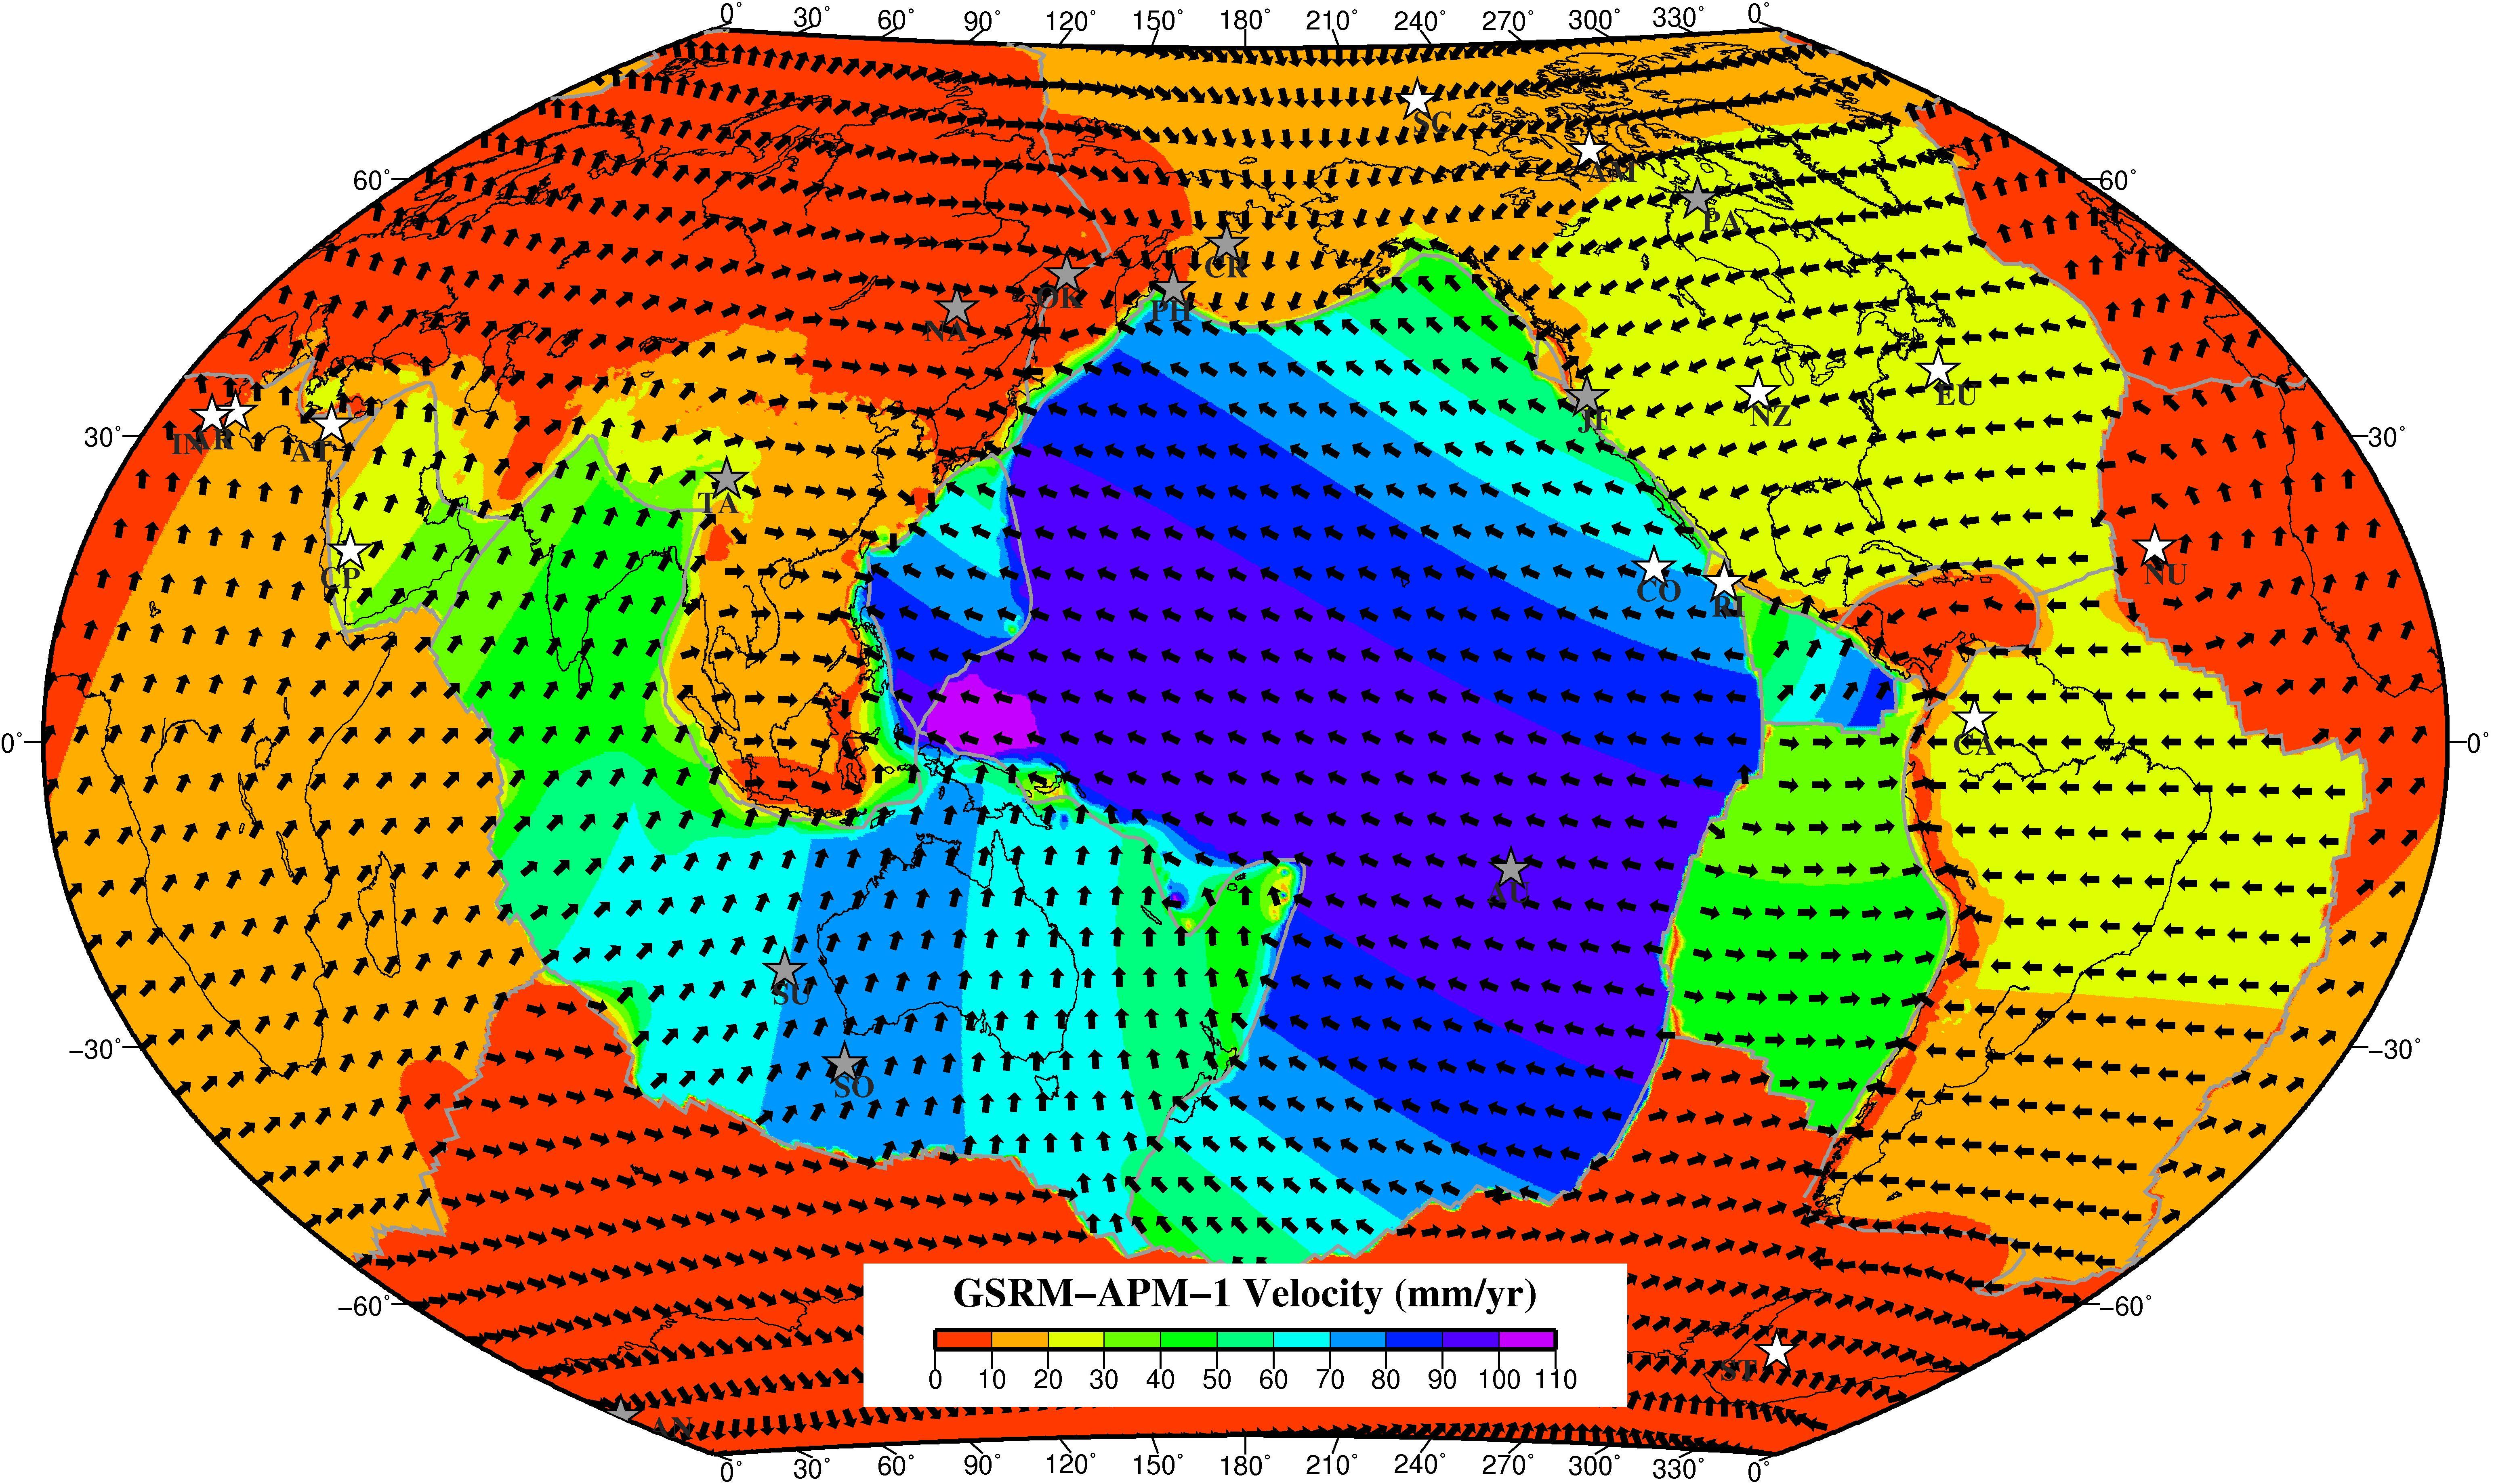
Figure Caption: (click on figure for higher resolution) Vectors indicate velocity directions in the GSRM-APM-1 reference frame and color contours are the velocity amplitudes. Stars are Euler pole locations (white, counterclockwise rotation; grey, clockwise rotation).
[July 14, 2009] GGOS 2020 Book Published:

See http://www.springer.com/978-3-642-02686-7 for details, and/or order it at Amazon.com.
[March 15, 2009] Three papers published:
We have three papers published in the new Geological Society of America Special Paper 447: Late Cenozoic Structure and Evolution of the Great Basin–Sierra Nevada Transition:
Please contact the authors (Blewitt , Kreemer ,Hammond) for details, reprints, etc.
[January 1, 2009] Areal Changes in the Pacific-North America Plate Boundary Zone:
New Publication: Corné Kreemer and Bill Hammond have used a large compilation of geodetic velocities in the Pacific-North America plate boundary zone to show that between the Gulf of California and the Queen Charlotte Islands the plate boundary undergoes no net areal change, consistent with being a transform plate boundary. They also showed that the area growth in the great Basin and Range is all offset by areal reduction in northern California above the southern Cascada subduction zone. This kinematic link is corroborated by independent geodynamic indicators and enforces the idea that the southern Cascade subduction zone may act as a 'window escape' for the Basin and Range material to flow/collapse towards. These results are now published in the journal Geology.
The same journal issue also contains a comprehensive perspective of these results. Reprints are available upon request.
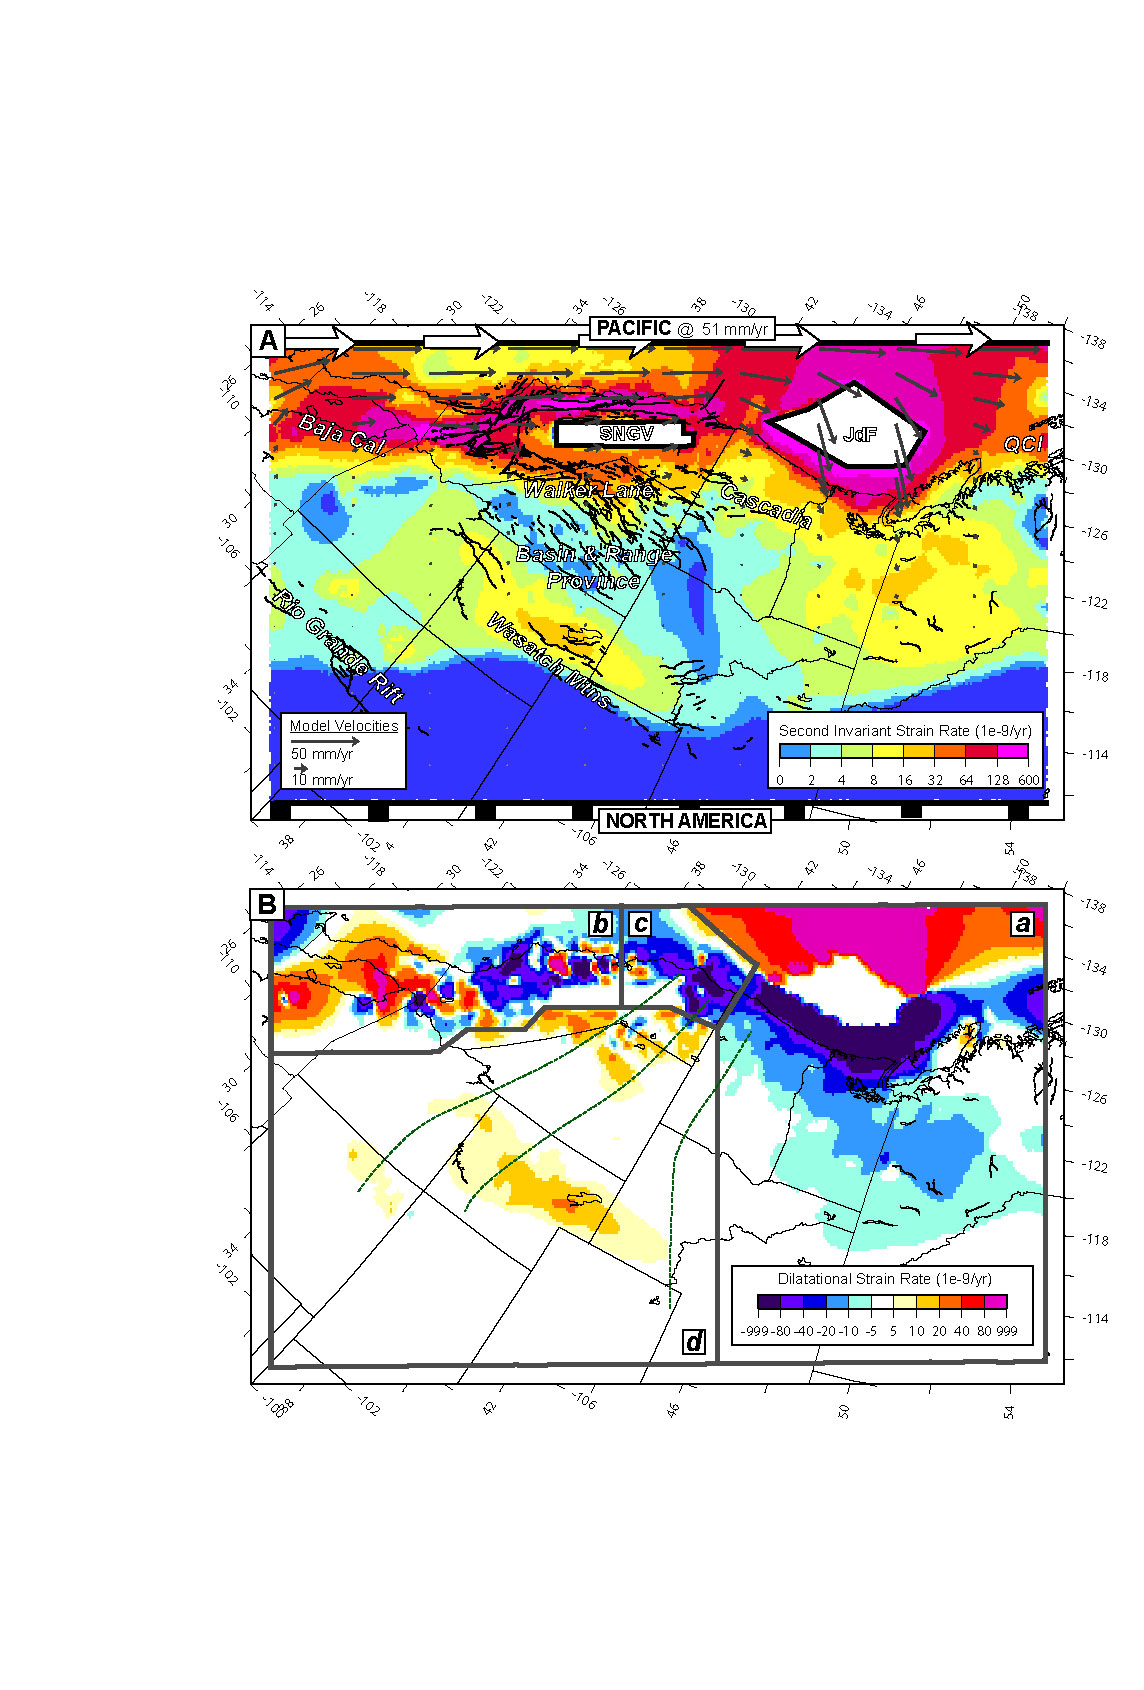
Figure Caption: (click on figure for higher resolution)
A: Pacific-NorthAmerica (PA-NA) plate boundary zone in western North America in an oblique Mercator projection
around the PA-NA pole of rotation. North American model boundary is fixed, while the Pacific boundary is
constrained to move at the full PA-NA rate. The Sierra Nevada - Great Valley microplate (SNGV) and
Juan de Fuca plate (JdF) are modeled as rigid entities within the deforming grid. Black lines are Quaternary
faults. Colors indicate second invariant of strain rate tensor field. Grey arrows are interpolated model
velocities relative to North America. QCI, Queen Charlotte Islands.
B: Contours of the dilatational strain rates.
Red and blue colors indicate extension (i.e., area growth) and contraction (i.e., area reduction), respectively.
The gray lines divide the plate boundary into four zones (results for specific zones are published in article).
Dashed green lines are trajectories along (averaged) minimum principal stress observations for the greater
Basin and Range Provice (Humphreys and Coblentz, 2007).
[June 1, 2006] Paper on 2004 Sumatra Earthquake and Tsunami published:
A team of researchers from NGL and Northwestern University has shown that highly precise GPS measurements may more quickly assess the danger of a tsunami by rapidly estimating the magnitude of large tsunamigetic earthquakes in near real-time.
The results have been published as a cover story in Geophysical Research Letters.
Figure Caption: (above) Time series (blue lines) of east component of ground displacements after the great December 2004 Sumatra earthquake, recorded by continuous GPS sites in Southeast Asia. The earthquake produced changes in site positions that are large enough to allow the magnitude of the earthquake to be assessed within 15 minutes, faster than was possible with seismic data alone. This time interval is shorter than the time required by the tsunami to cross the Indian Ocean, illustrating that GPS data can contribute to tsunami warning by assessing whether an earthquake is large enough to generate an oceanwide tsunami. The tsunami arrival times (color contours on map) are made available by NOAA Center for Tsunami Research (director: Dr. Frank Gonzalez).
[March 1, 2005]Displacement field of the 2004 Sumatra earthquake calculated:
The M=9.2 earthquake of 26 December 2004, near northern Sumatra, was the largest earthquake ever directly recorded with modern-day space geodesy. This earthquake and its subsequent tsunami caused immense loss of lifes and property around the Indian Ocean. Researchers of the Nevada Geodetic Laboratory have contributed to the understanding of this earthquake. They have also started to study the feasibility of using GPS in estimating the earthquake's magnitude and tsunami potential in real-time. These developments could be crucial for enhancing existing and futuretsunami warning systems.
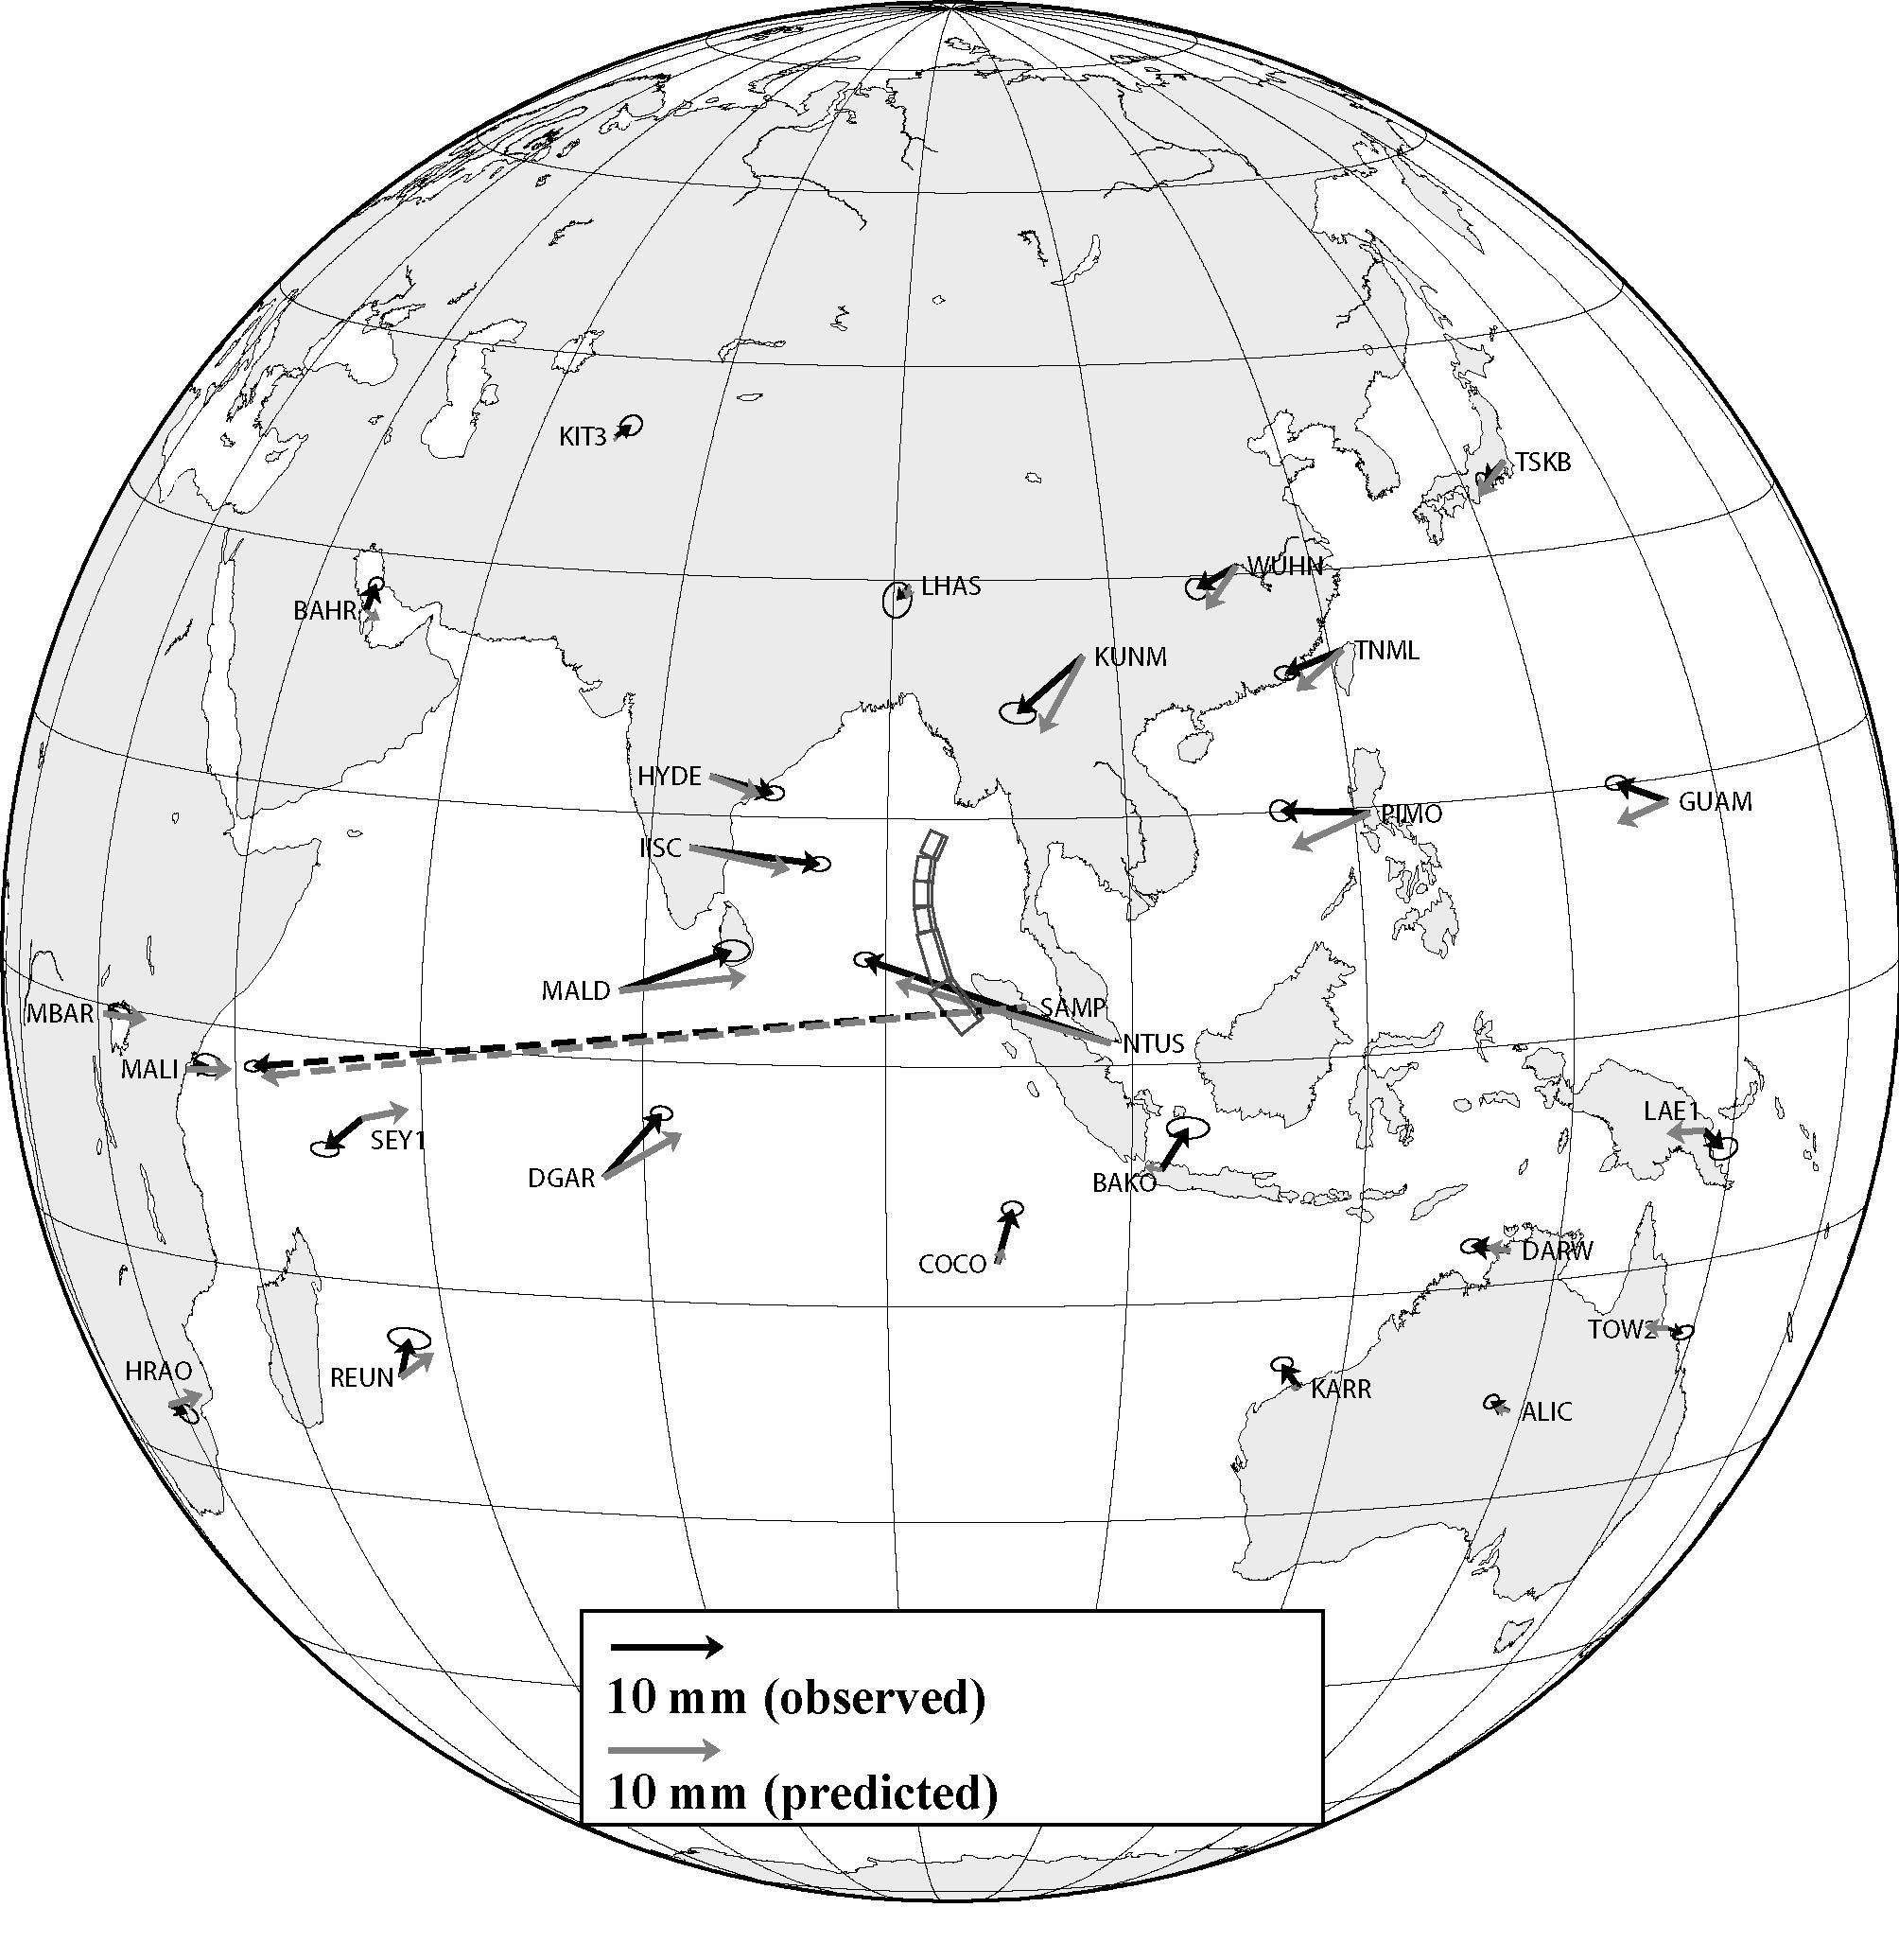
To your left you see a map of the eastern hemisphere. It shows in black arrows the horizontal displacements of GPS positions during the earthquake. You can see, for instance, that at many thousands kilometers away from the epicenter the Earth's surface moved with several millimeters. For instance, points in India moved approximately 1 cm to the east during the earthquake. These displacements are measurable by averaging GPS positions for the days before and after the earthquake. The offset estimates can be used to quantify the earthquake's magnitude and the rough characteristics of the slip pattern during the event. Our results, which have just been published, agree with those obtained by other research groups.
The challenge we now face is two-fold. 1) Can we obtain reasonably accurate offset estimates using only minutes
(instead of days/weeks) of data before and after the arrival of seismic waves at the GPS locations?
2) If GPS locations many thousand kilometers away from the epicenter moved, how can a stable global geodetic reference frame
be maintained?