
| Home | People | Contact | About us | Links | Vacancies | Site Map | News Archive | Acknowledgements |
|
Solutions from 5 Minute Sample Rate Time Series Available Day After Earthquake |
Solutions from 24 Hour Sample Rate Time Series Available 2 Days After Earthquake |
|
|
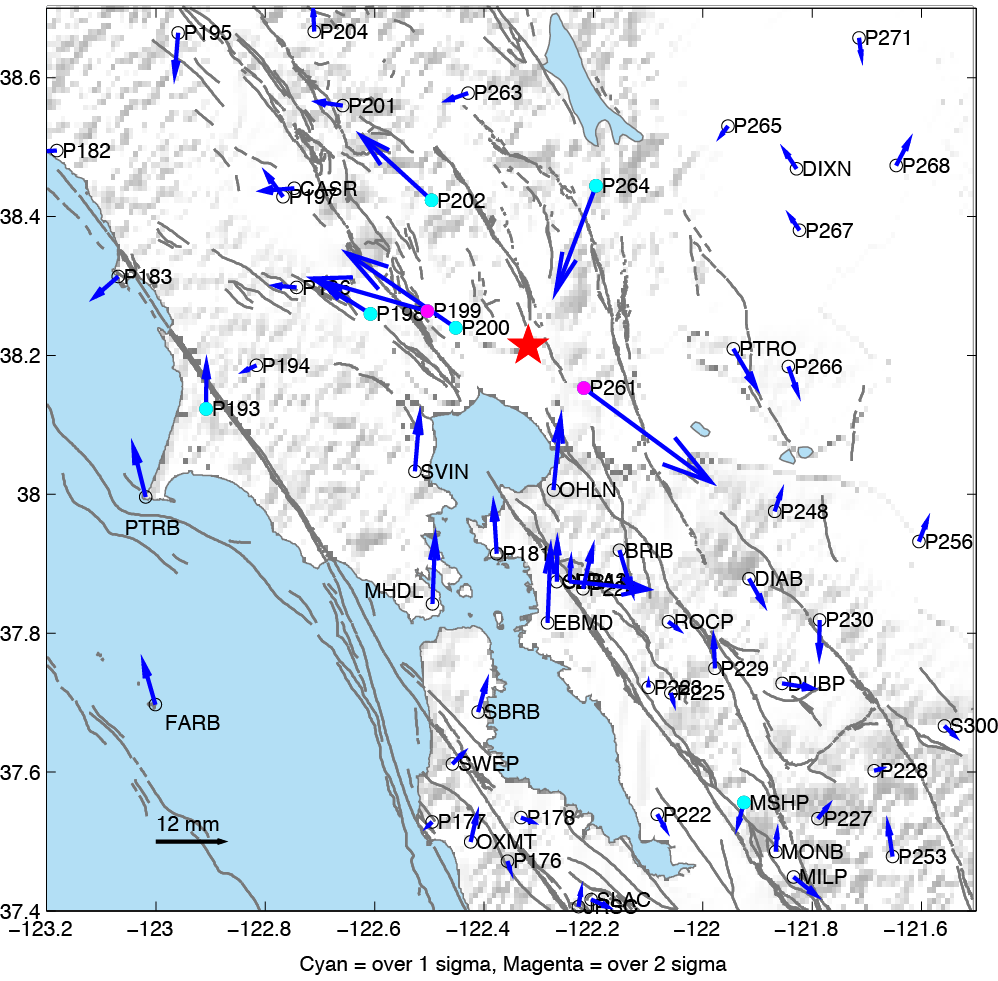
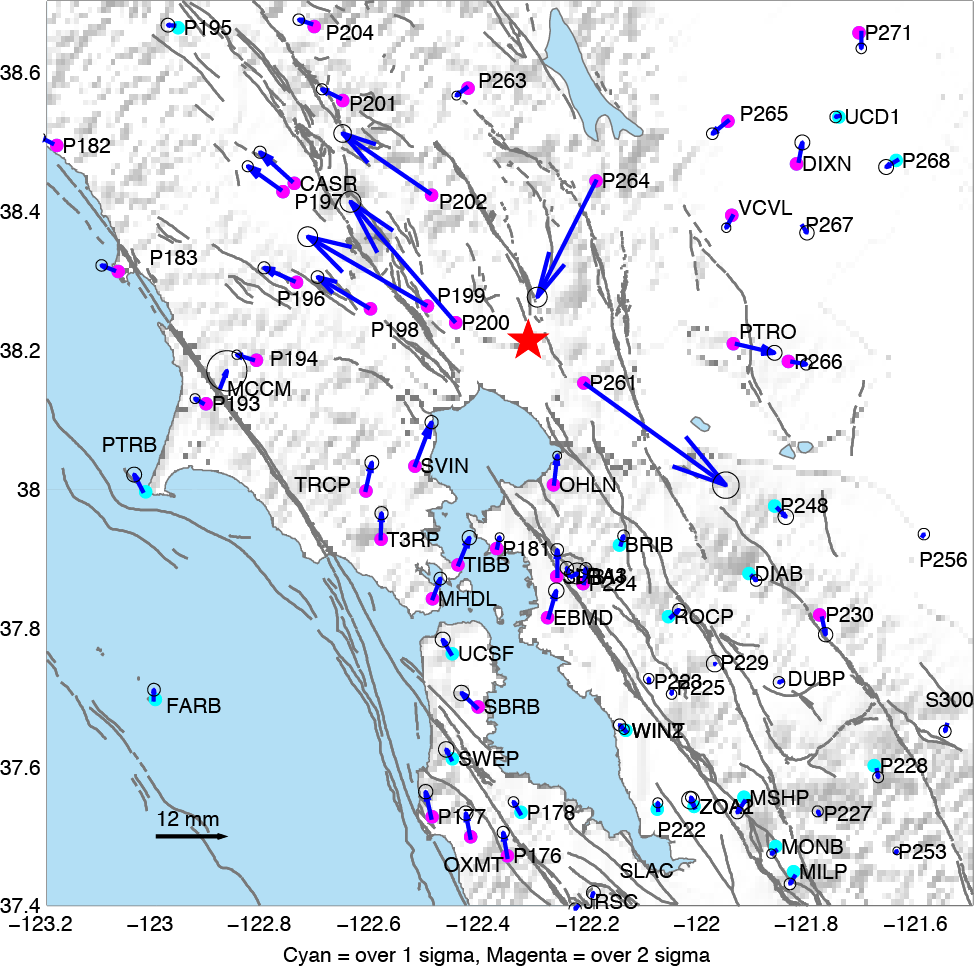
The figure on the left above shows a rapid estimate of the coseismic displacement that occurred in the earthquake. The offsets were estimated the day after the event from 24 hour latency 5 minute sample interval GPS time series obtained with the GIPSY/OASIS-II software from the Jet Propulsion Laboratory. We took 6 hours of data before the event, 6 hours (max) after the event, with a gap of one hour after the event. The offsets were estimated as the difference between the means of the coordinates for each of the after and before intervals, done separately for each coordinate. The figure on the right shows the estimates obtained after 24 hour sample rate time series using data up to the end of a full day after the earthquake, and hence are more accurate and greater in number. They show a similar pattern of coseismic displacement, though with less noise in the displacement field. Uncertainties in the offsets were estimated using the scatter of the time series before and after the event. Cyan and magenta dots in the vector plot indicate displacements that are greater than the 1 sigma/2 sigma uncertainty, respectively. We excluded offsets greater than 30 mm, based on the maximum displacement expected for an M6.1 at 10 km depth, which removed two large outliers in the displacement field.
The displacement pattern shows the clear characteristics of a strike slip event with an approximately northwest striking fault plane. Because stations are located on both sides of the fault these measurements can help to quickly identify which fault slipped, providing an independent corrobortion that it was likely the West Napa Fault Zone that activated during the earthquake.
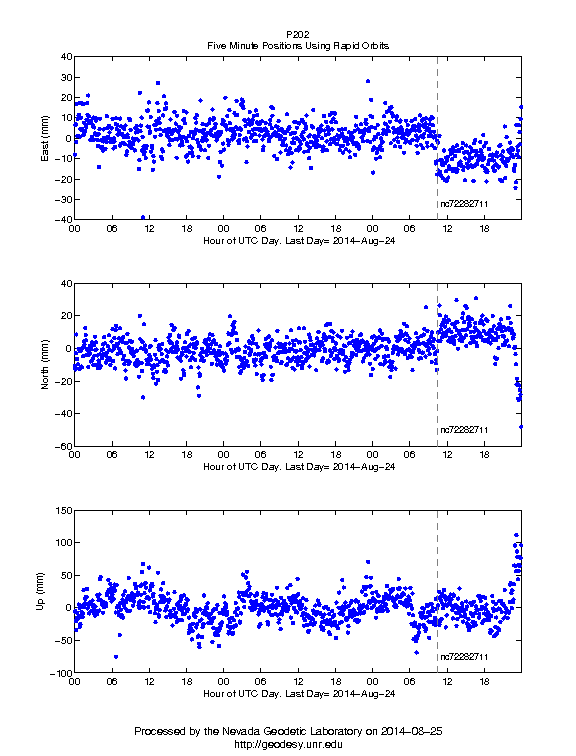
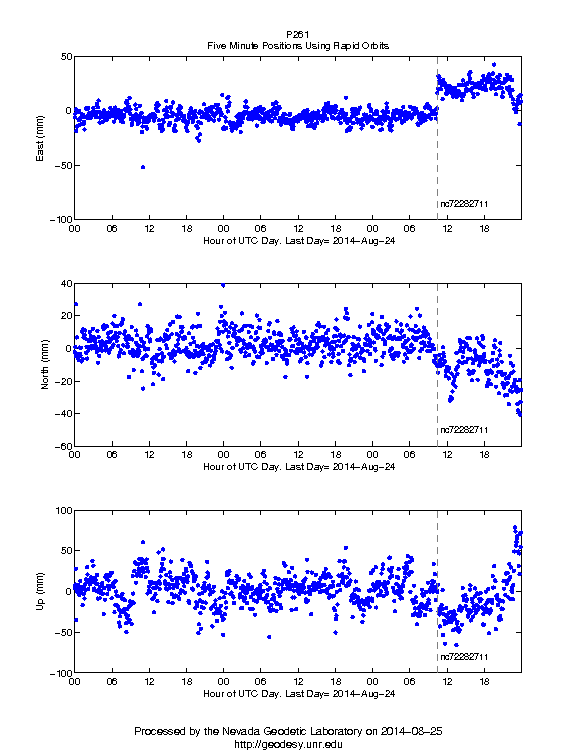
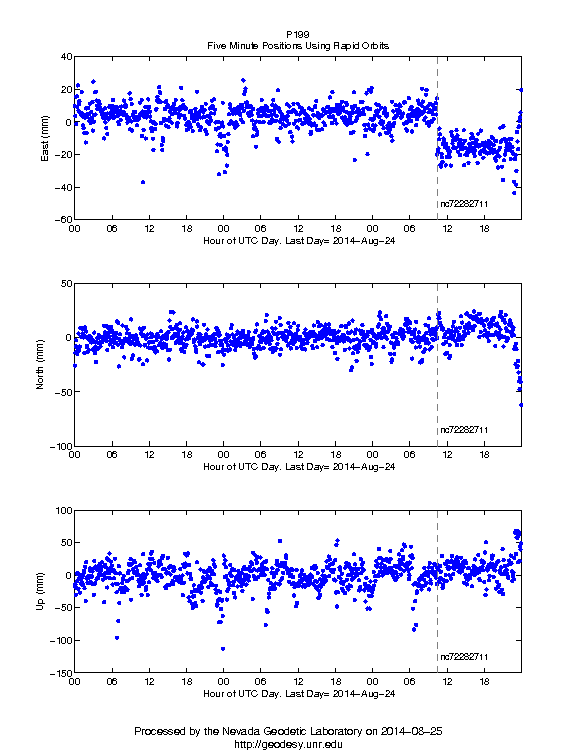
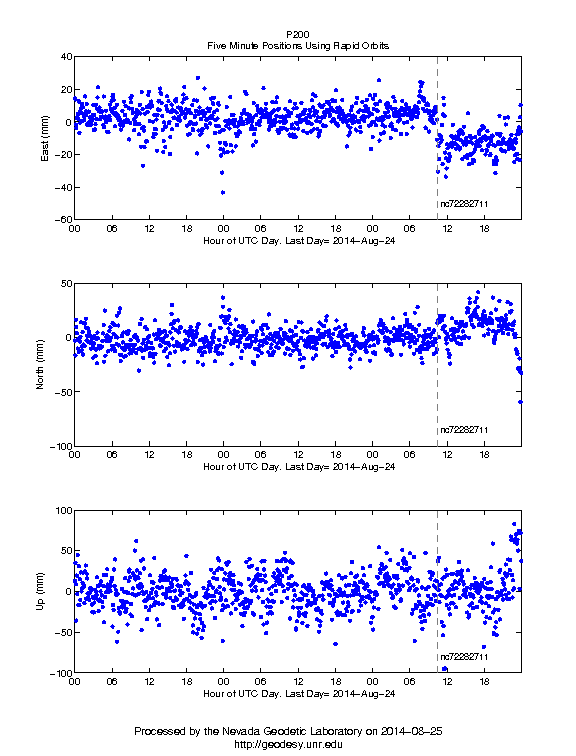
The figures below are example time series from stations P202 and P261. Note they move in opposite directions exactly at the event time because they lie on opposite sides of the fault. Each blue dot represents a position every five minutes. Three days of positions are shown.
|
|
Other stations that show this event in rapid (next day) 5 minute sample rate time series include P198, P199, P200, P264 plus some others.
Link to offset file based on rapid next day 5 minute sample rate time series (vector plot top left): here.
Link to offset file based on 24 hour sample rate using one full day after earthquake and 30 days before (vector plot top right): here. Values are in meters.
Values are in meters.GPS data were collected primarily by the EarthScope Plate Boundary Observatory, operated by UNAVCO, Inc, and the BARD Network operated by UC Berkeley, plus several other smaller networks. Processing was supported by grants from NASA and NSF.
Questions/Comments to Bill Hammond
Author's note: In an earlier version of this post the figure in the upper right, the 24 hour sample rate offsets, the scale was incorrect making the displacements seem larger than the vector scale bar would indicate. That has been corrected in this version.
Station latitude, longitudes and heights can be found here: llh file
You can cite this work as: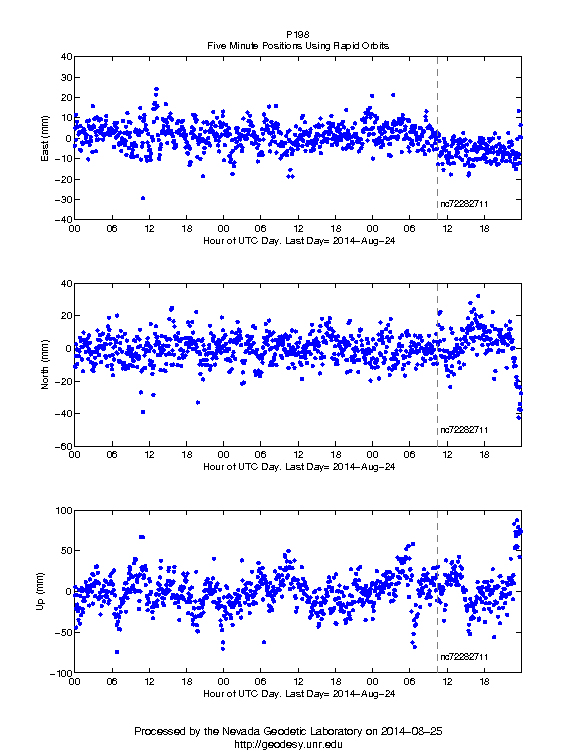