Global Strain Rate Map : Results for version 2.1 (2014)
A complete list of model files and input data can be found HERE
Please email me if you have questions
More information can also be obtained HERE
results for the old GSRM v1.2 (2004) can be found HERE
Below you'll find the figures of the 2014 paper, you can find the full captions there
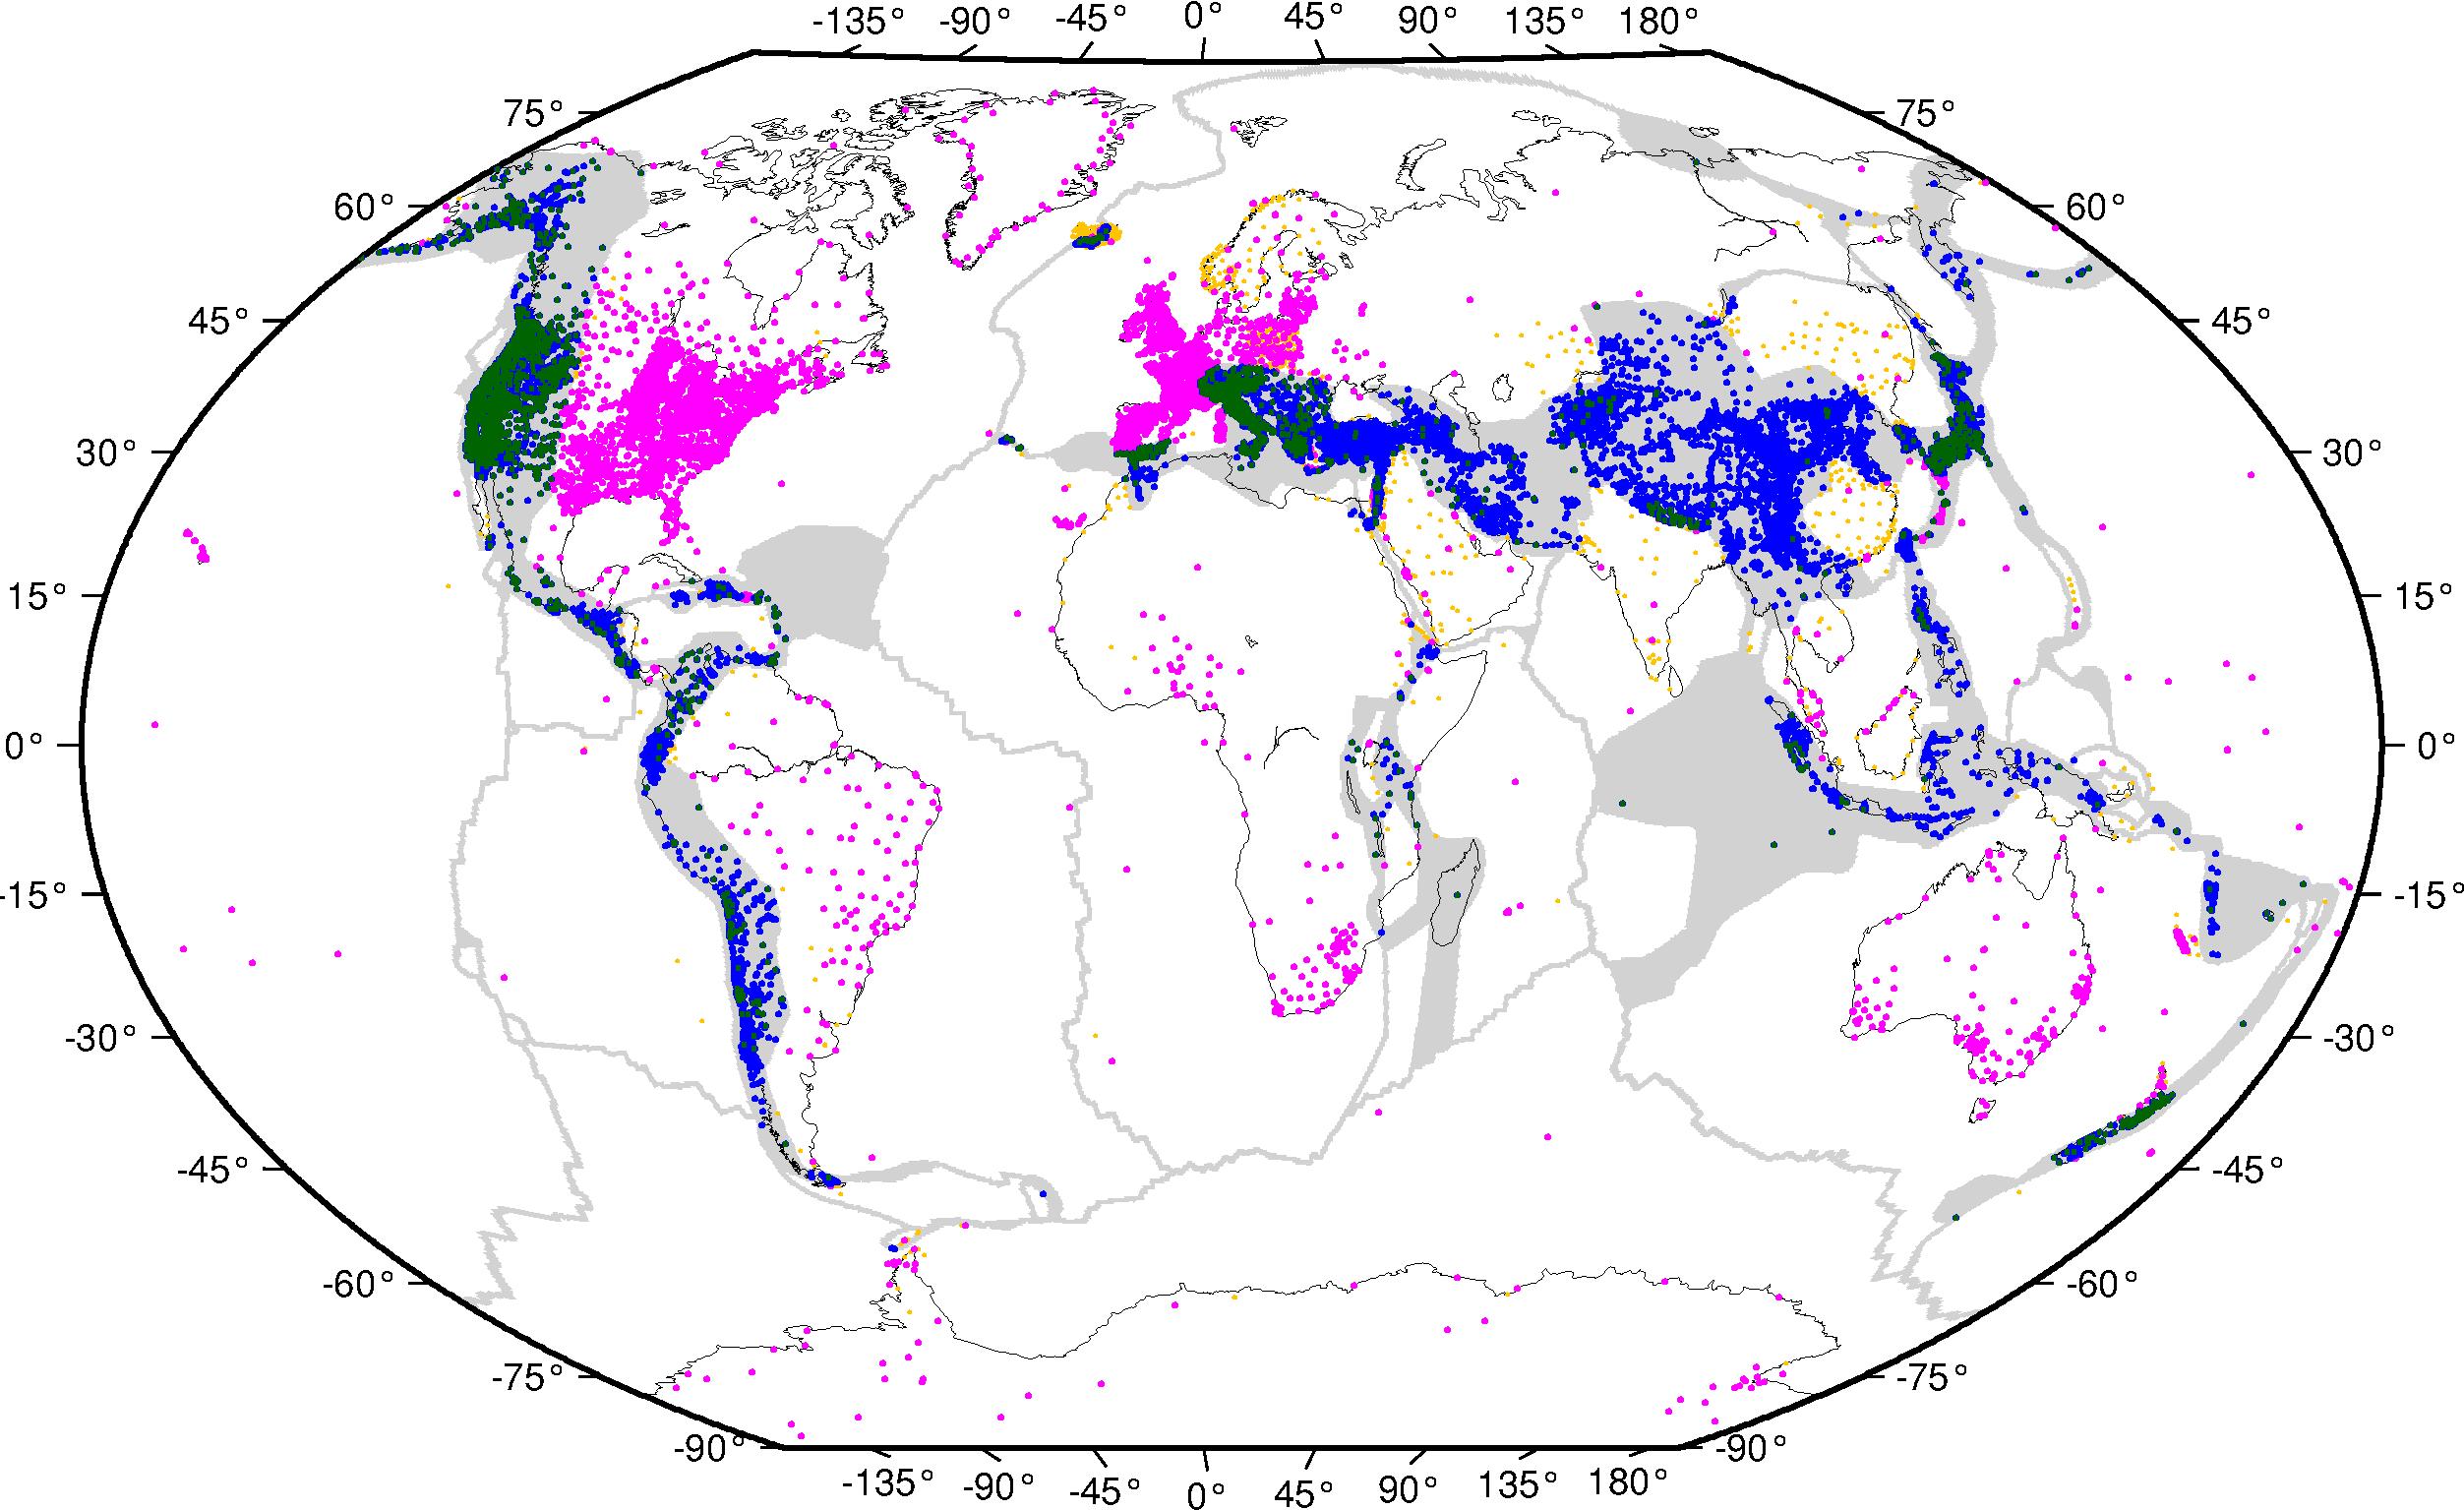
Fig.1 - Station locations
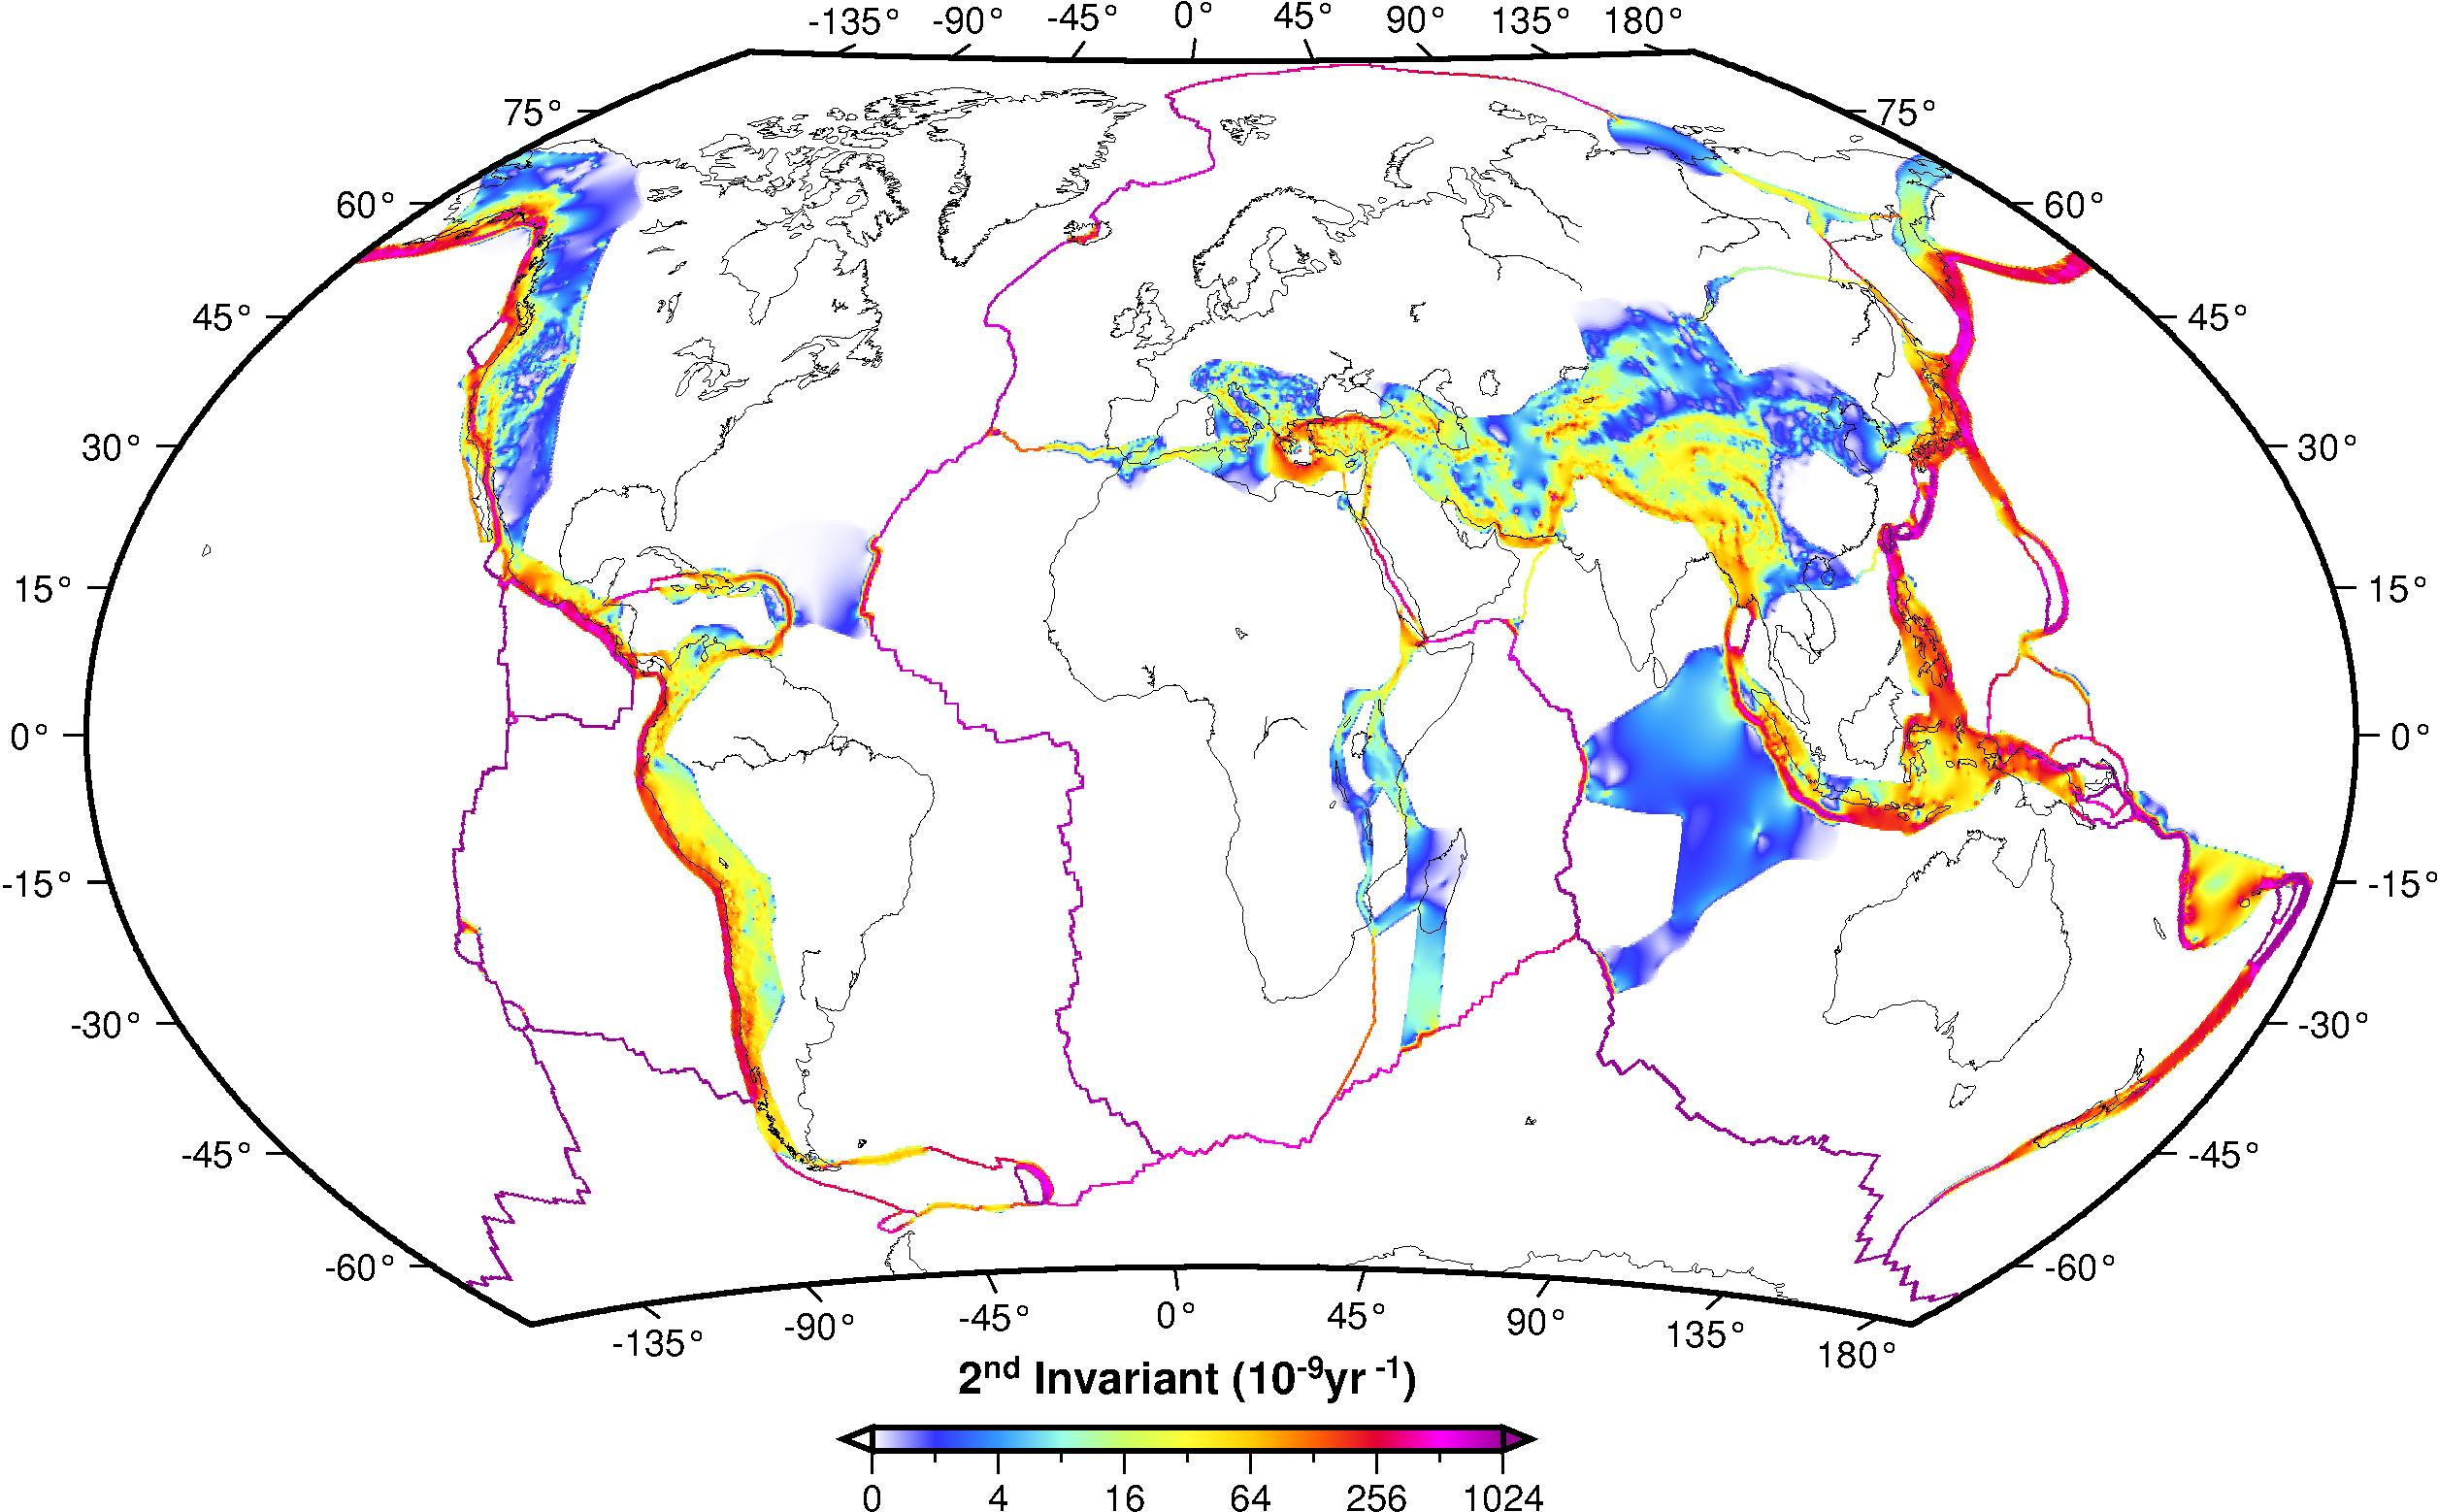
Fig.2. - Second Invariant
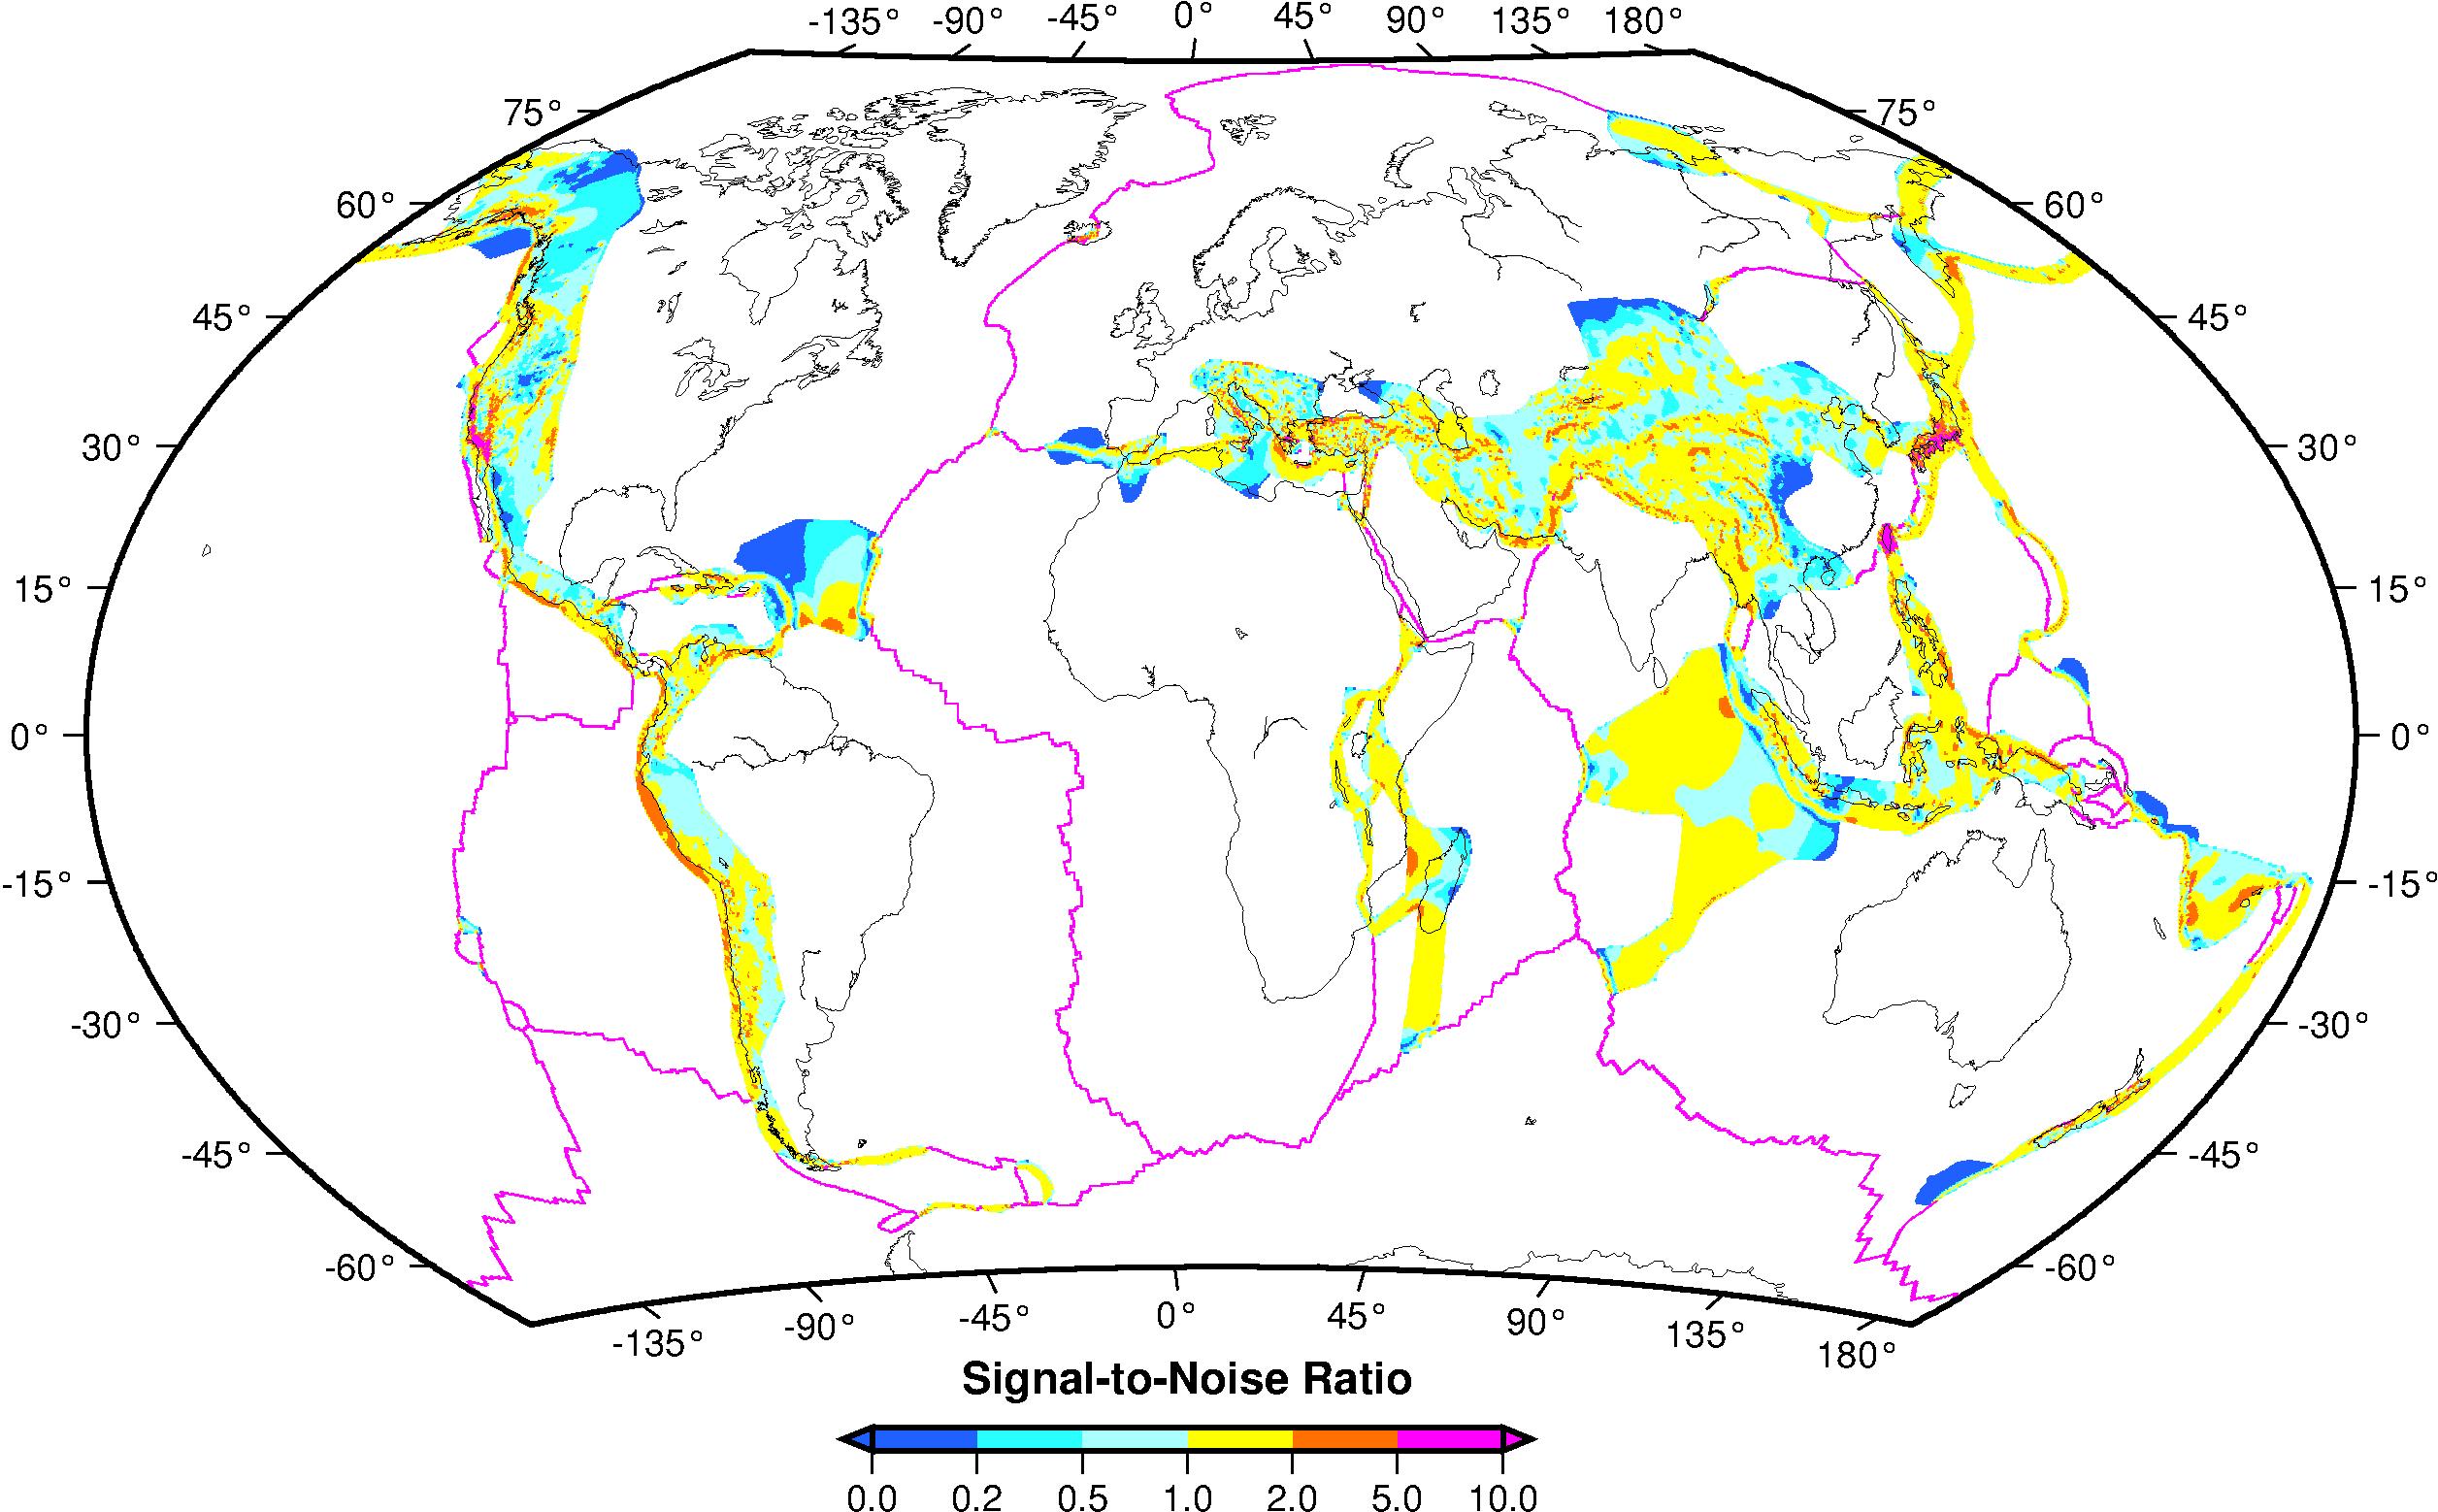
Fig.3 - Signal-to-noise ratio of second invariant
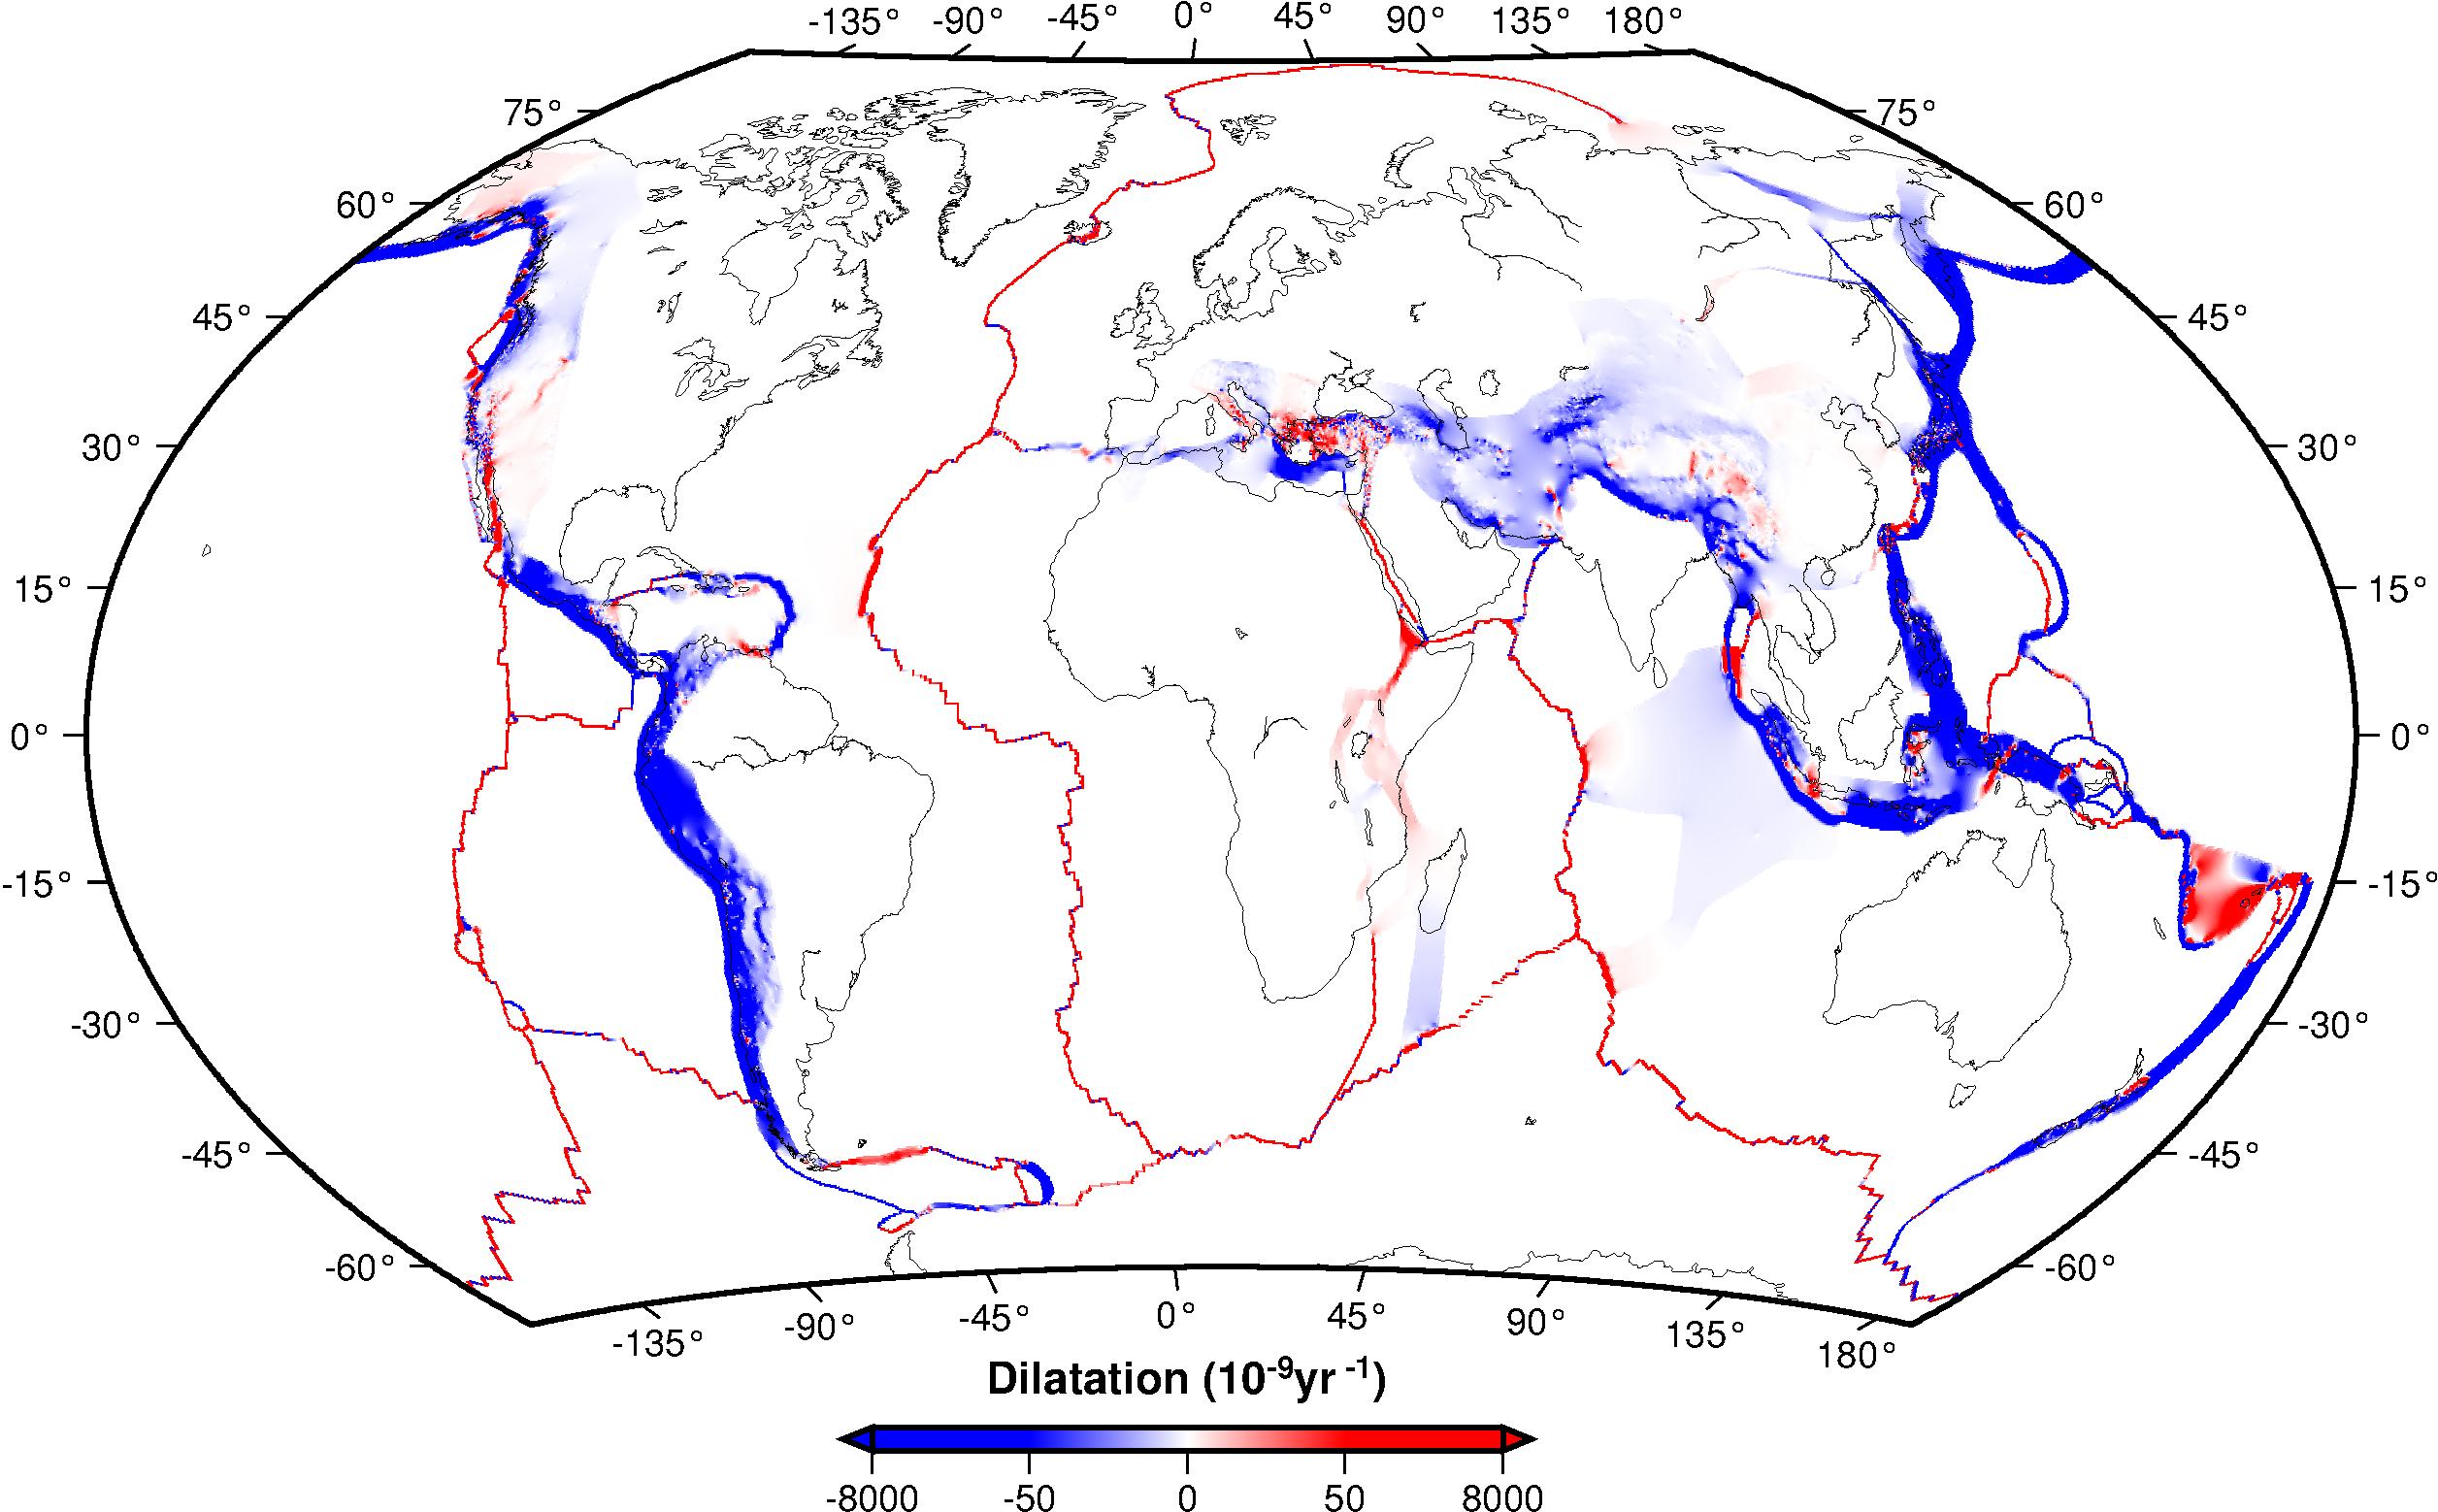
Fig.4 - Dilatation rate
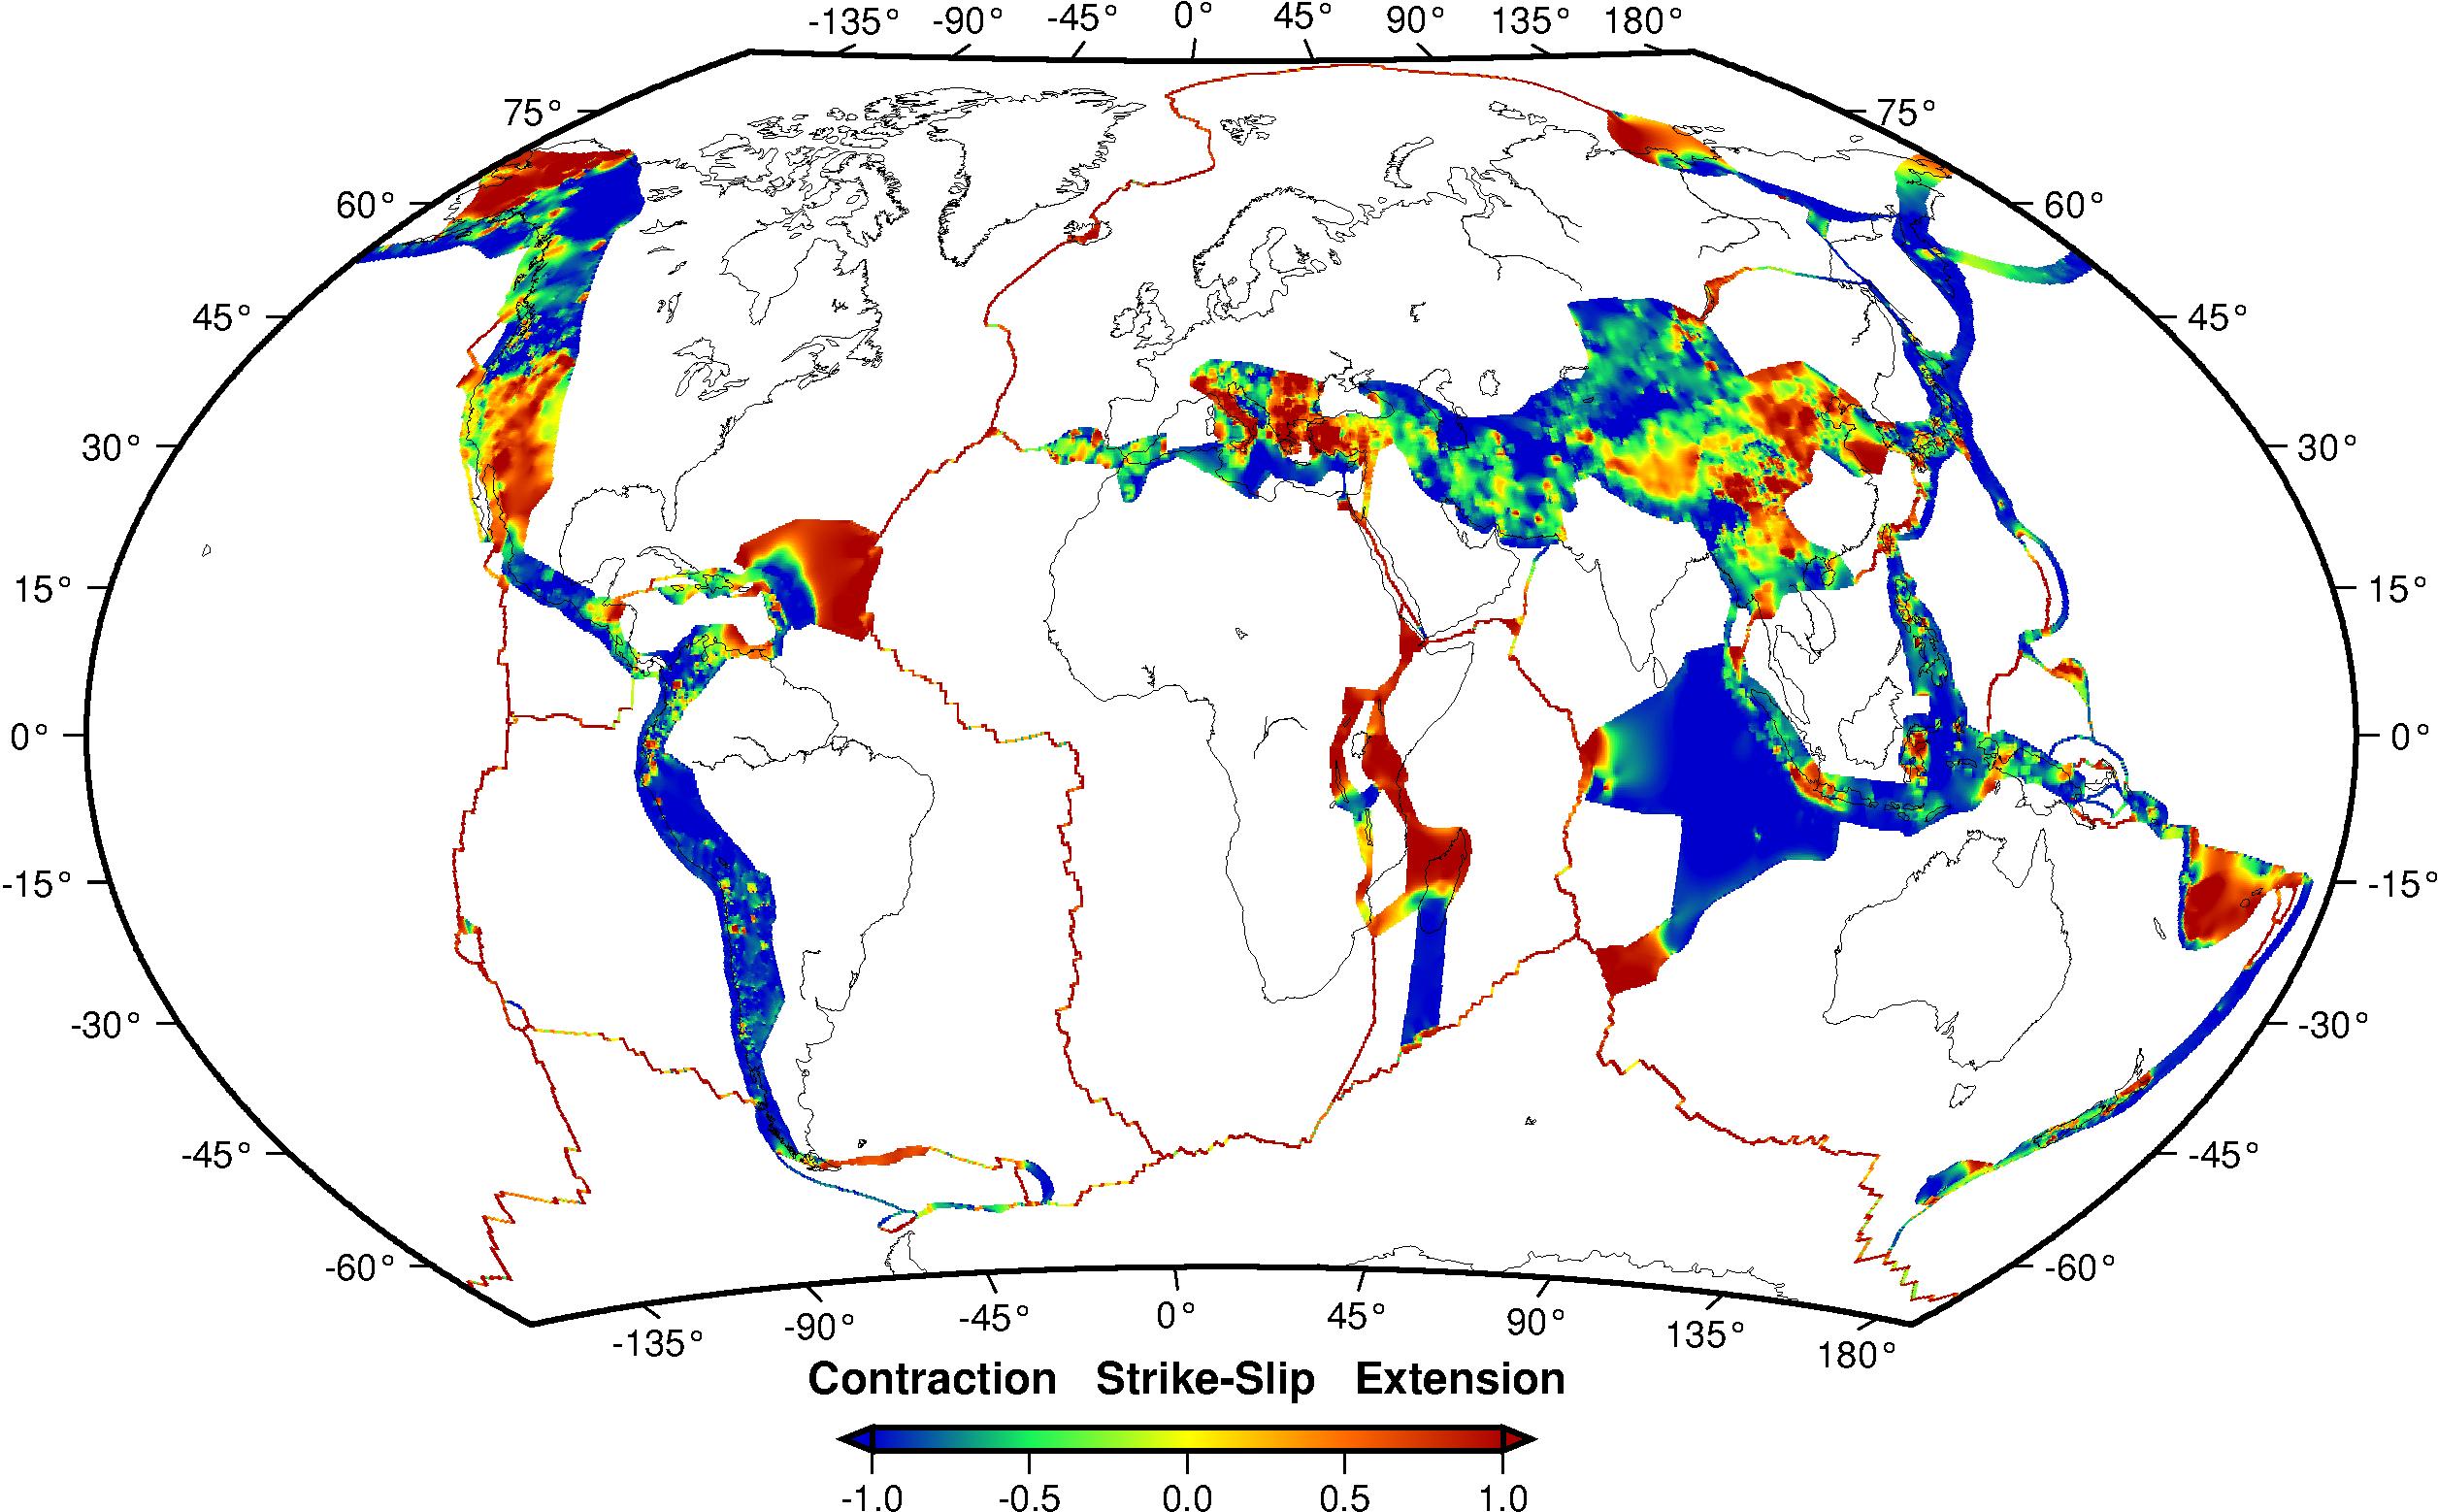
Fig.5 - Style of strain rate tensor
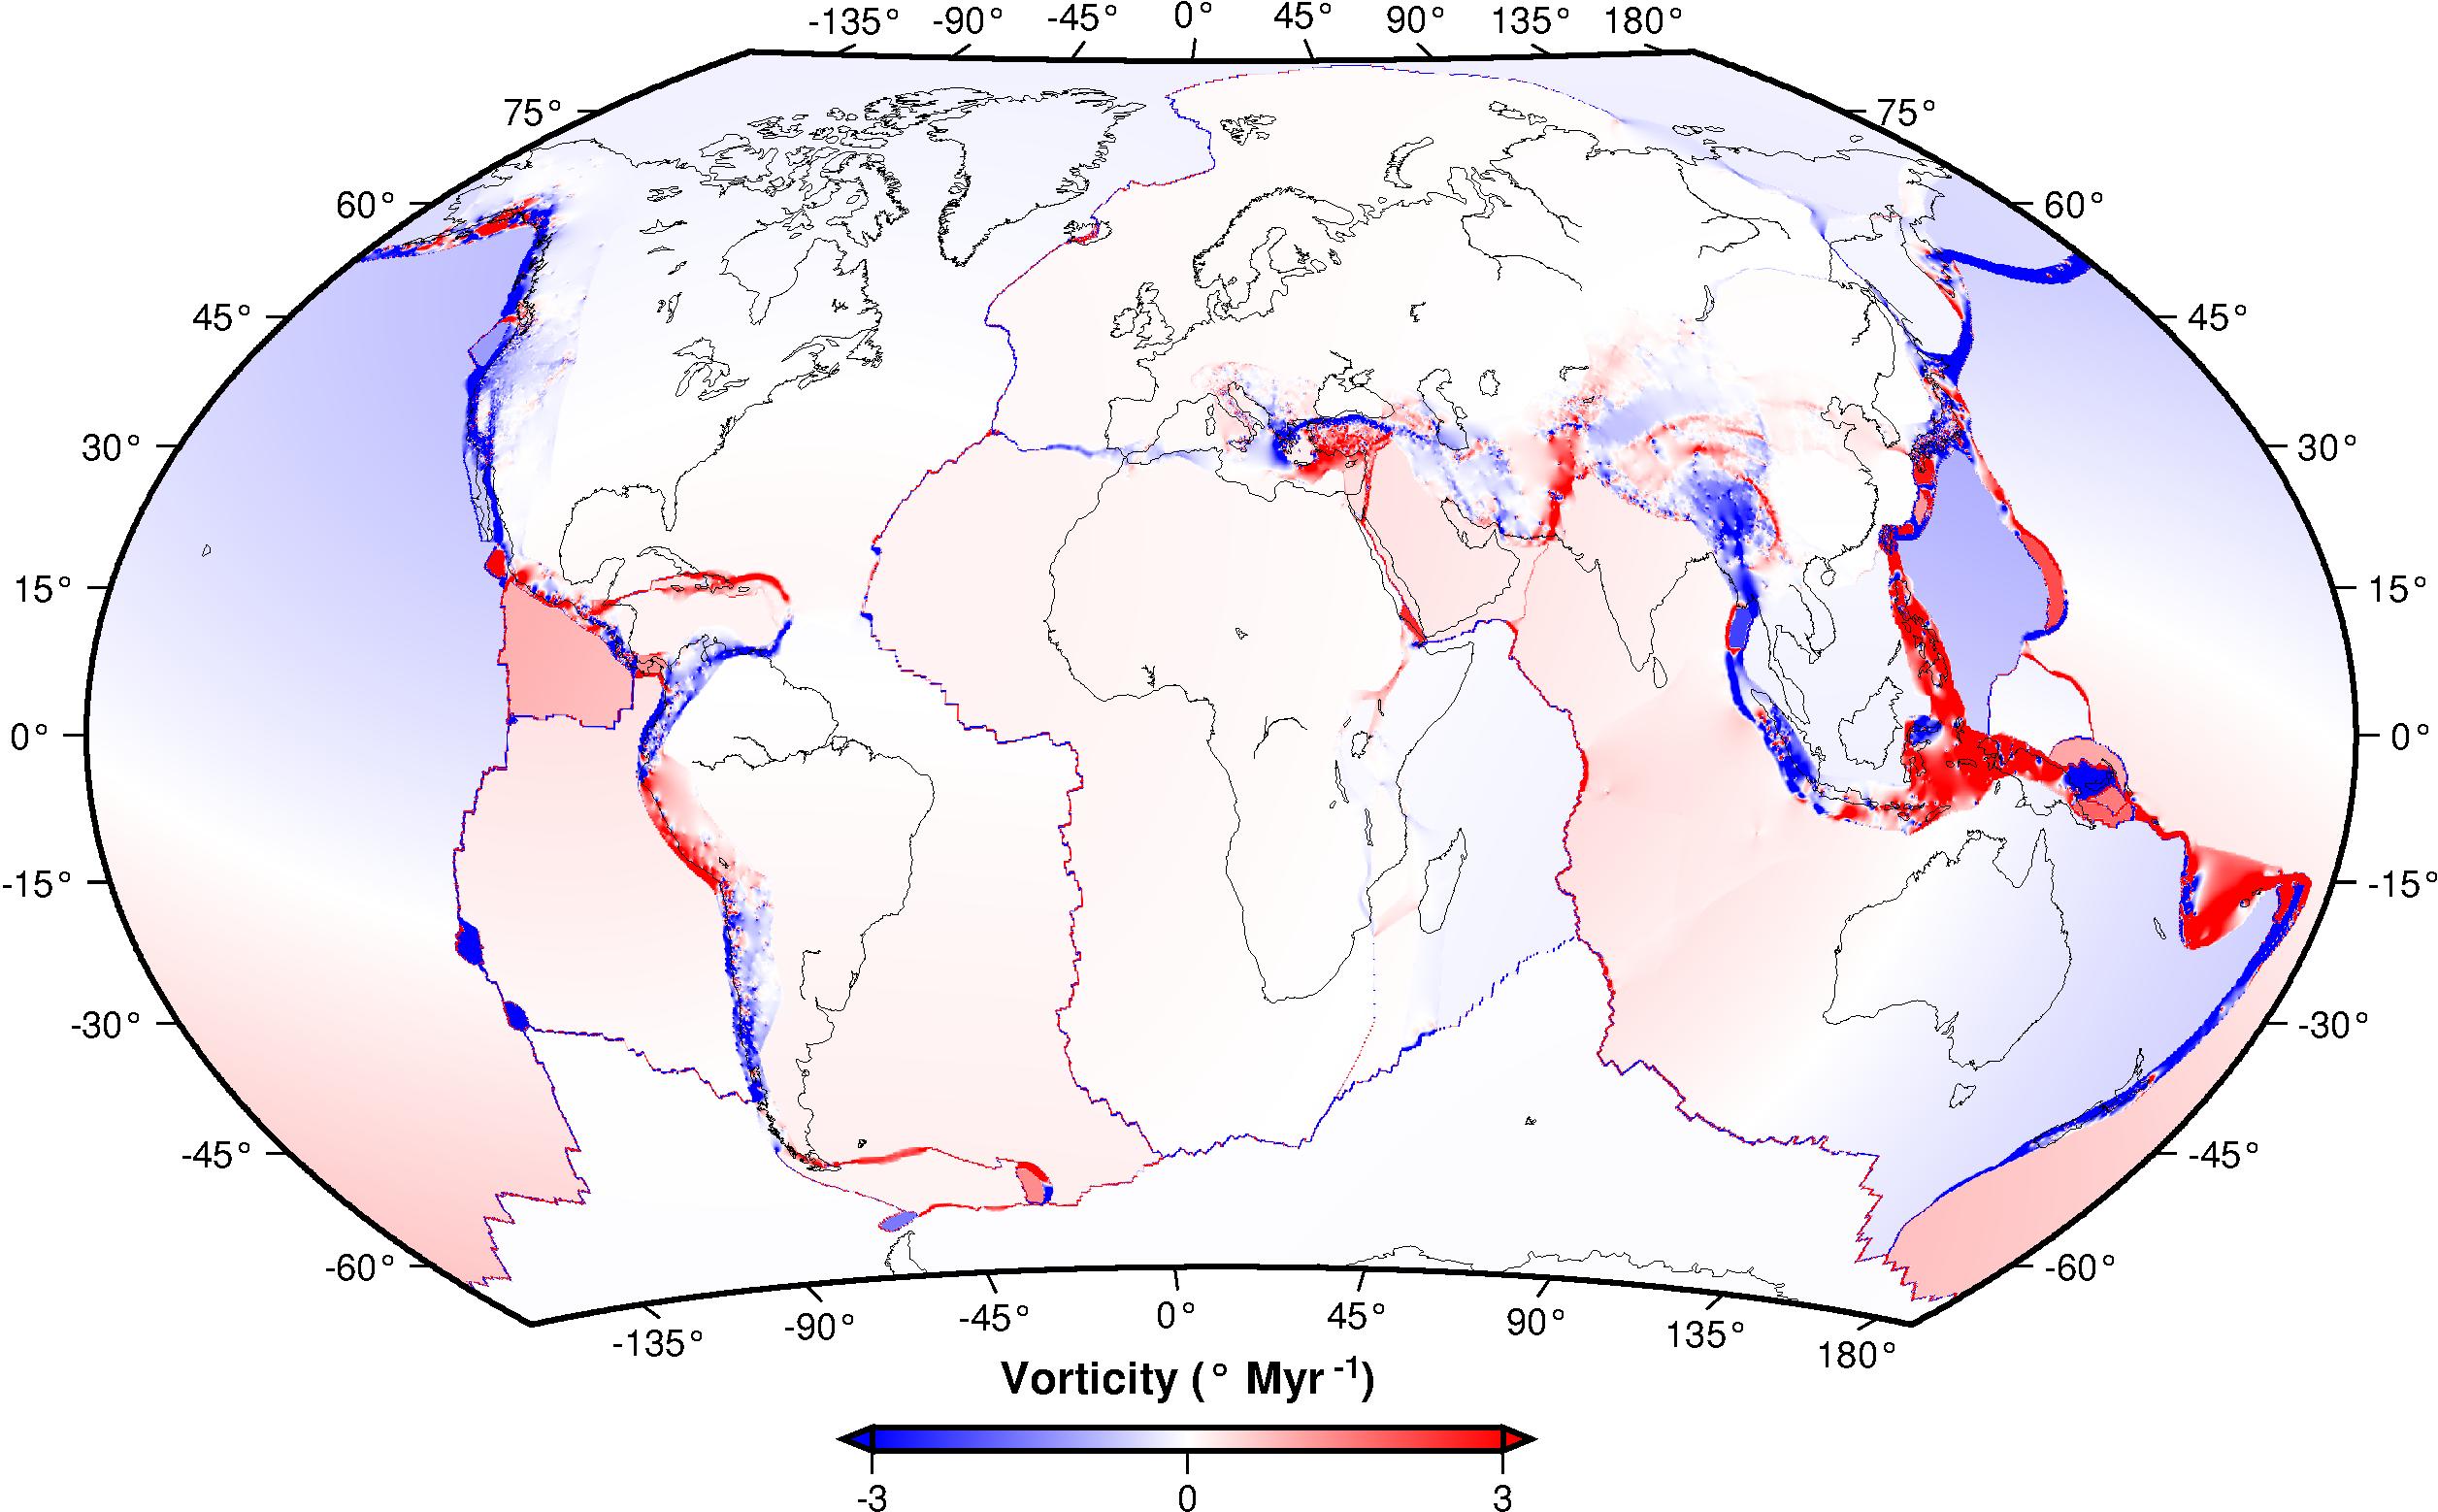
Fig.6 - Vorticity (in net-rotation frame of Kreemer (2009))
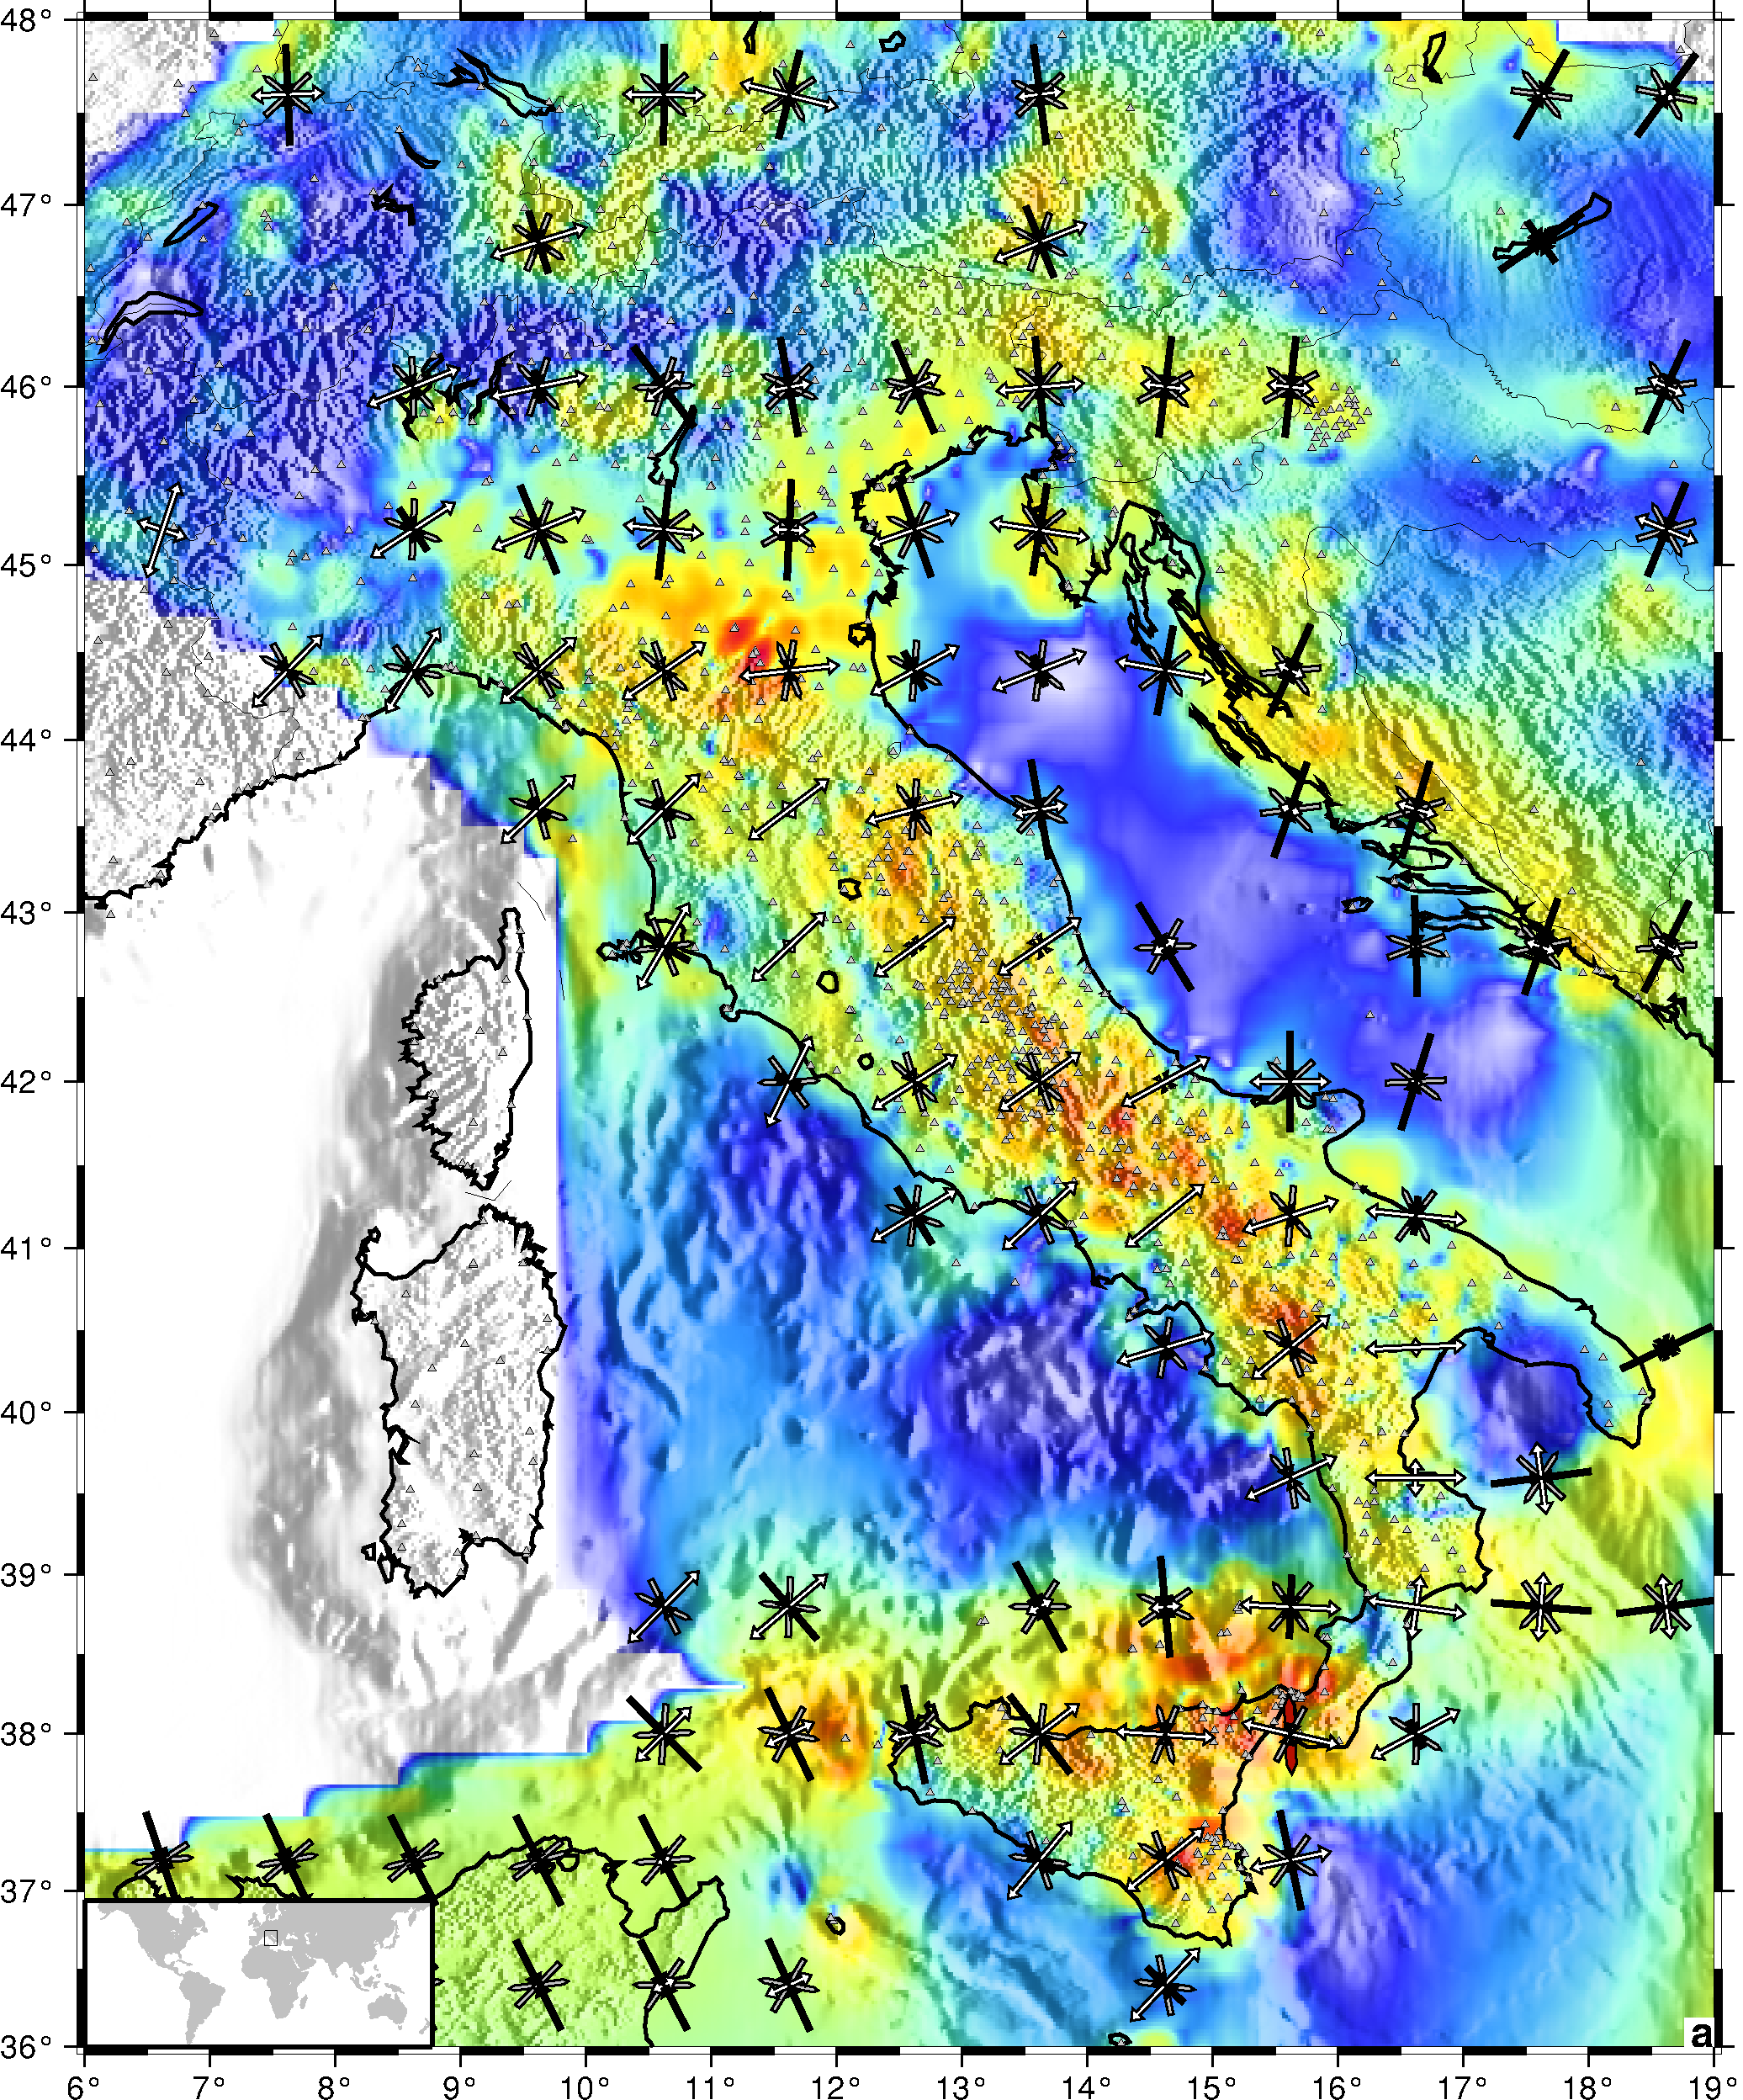
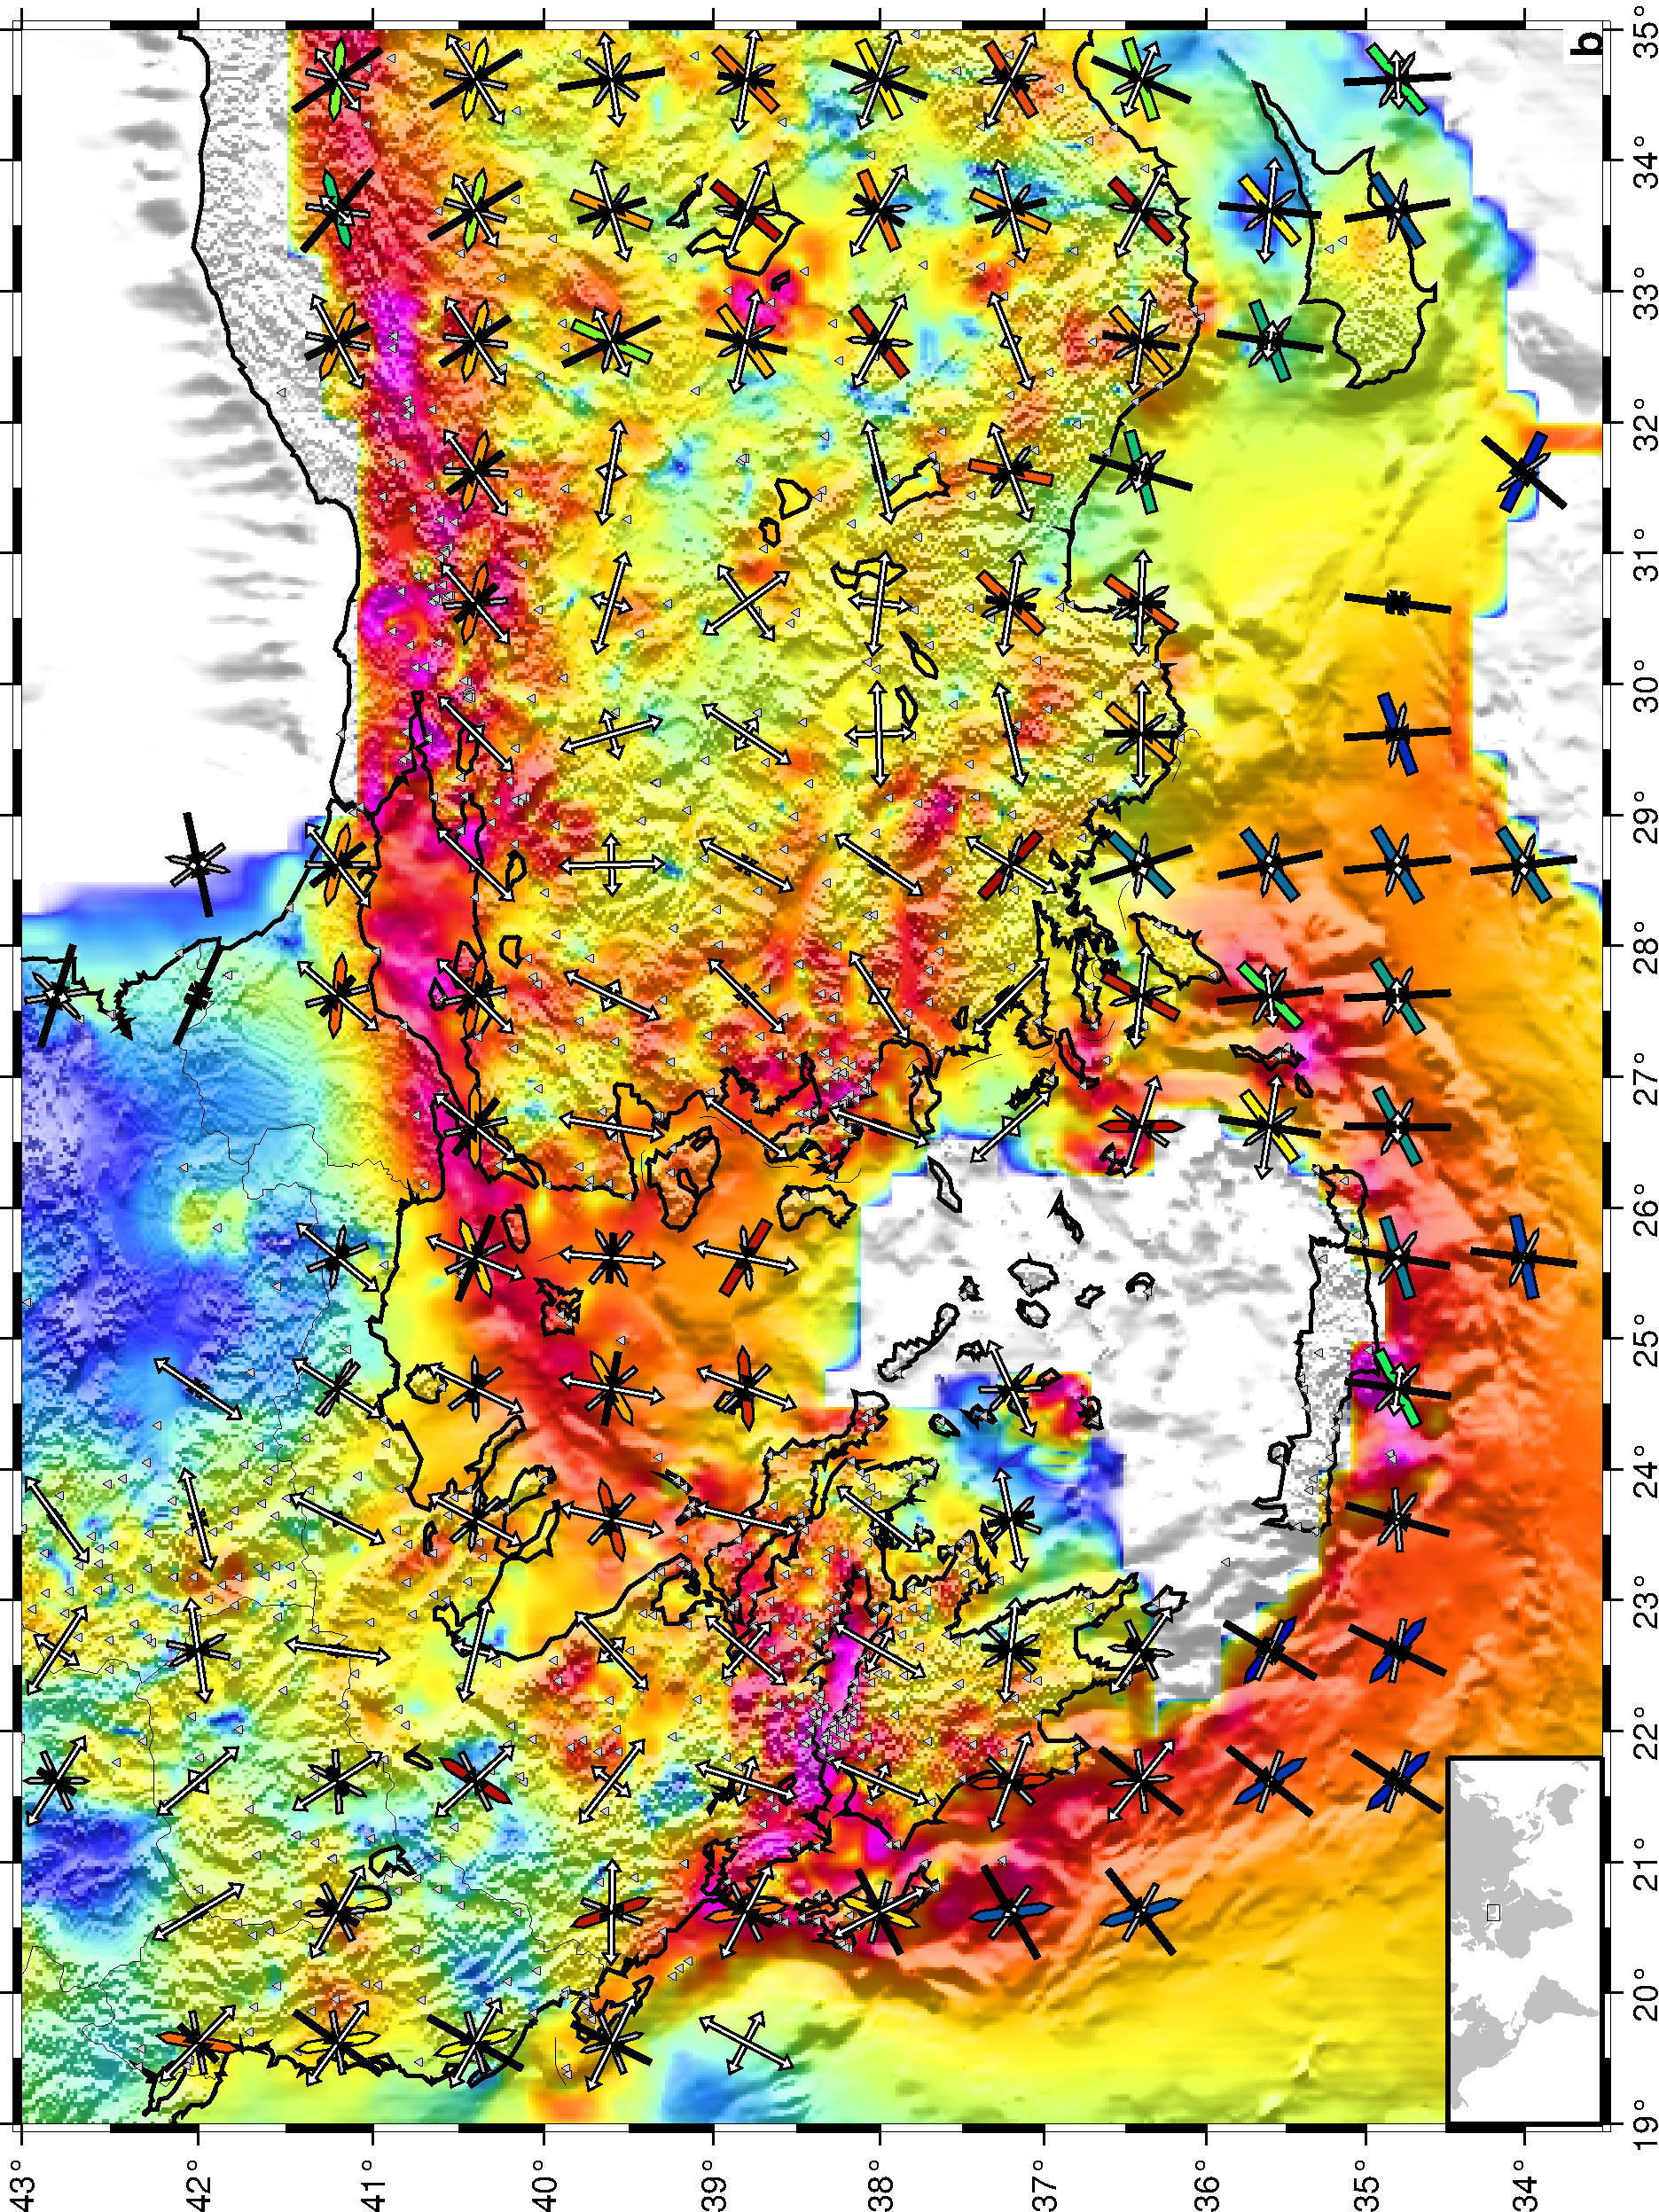
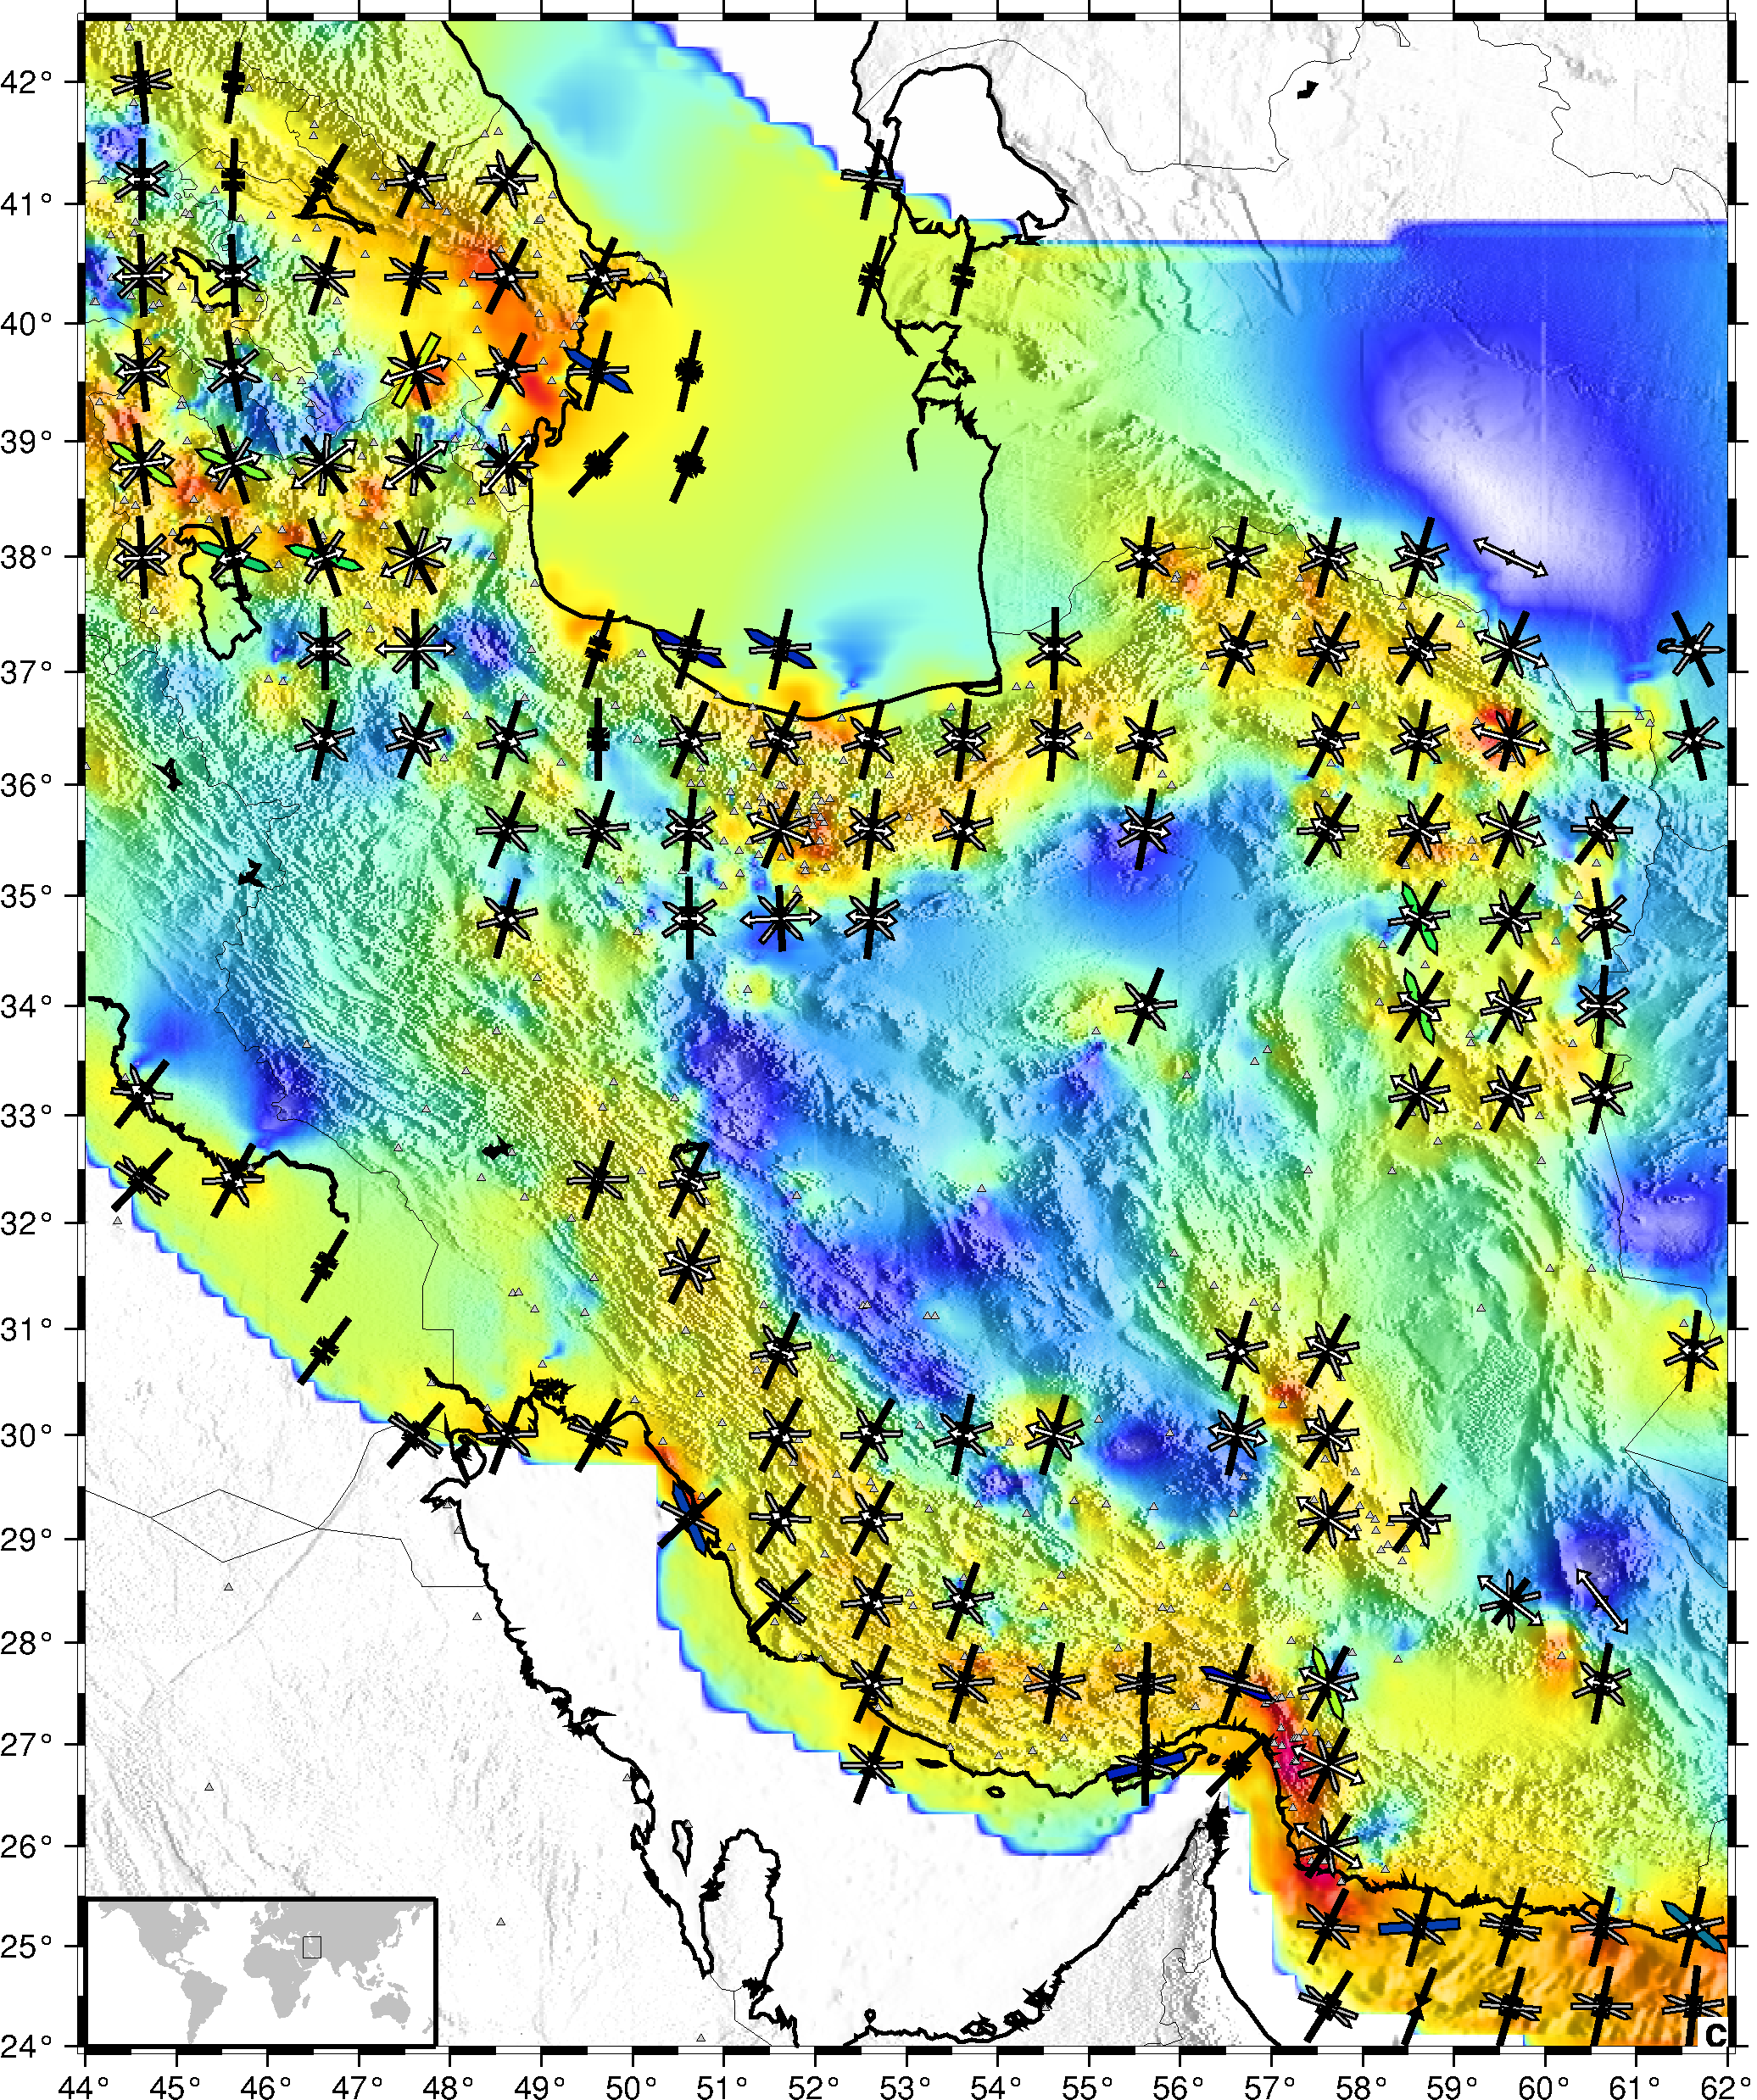
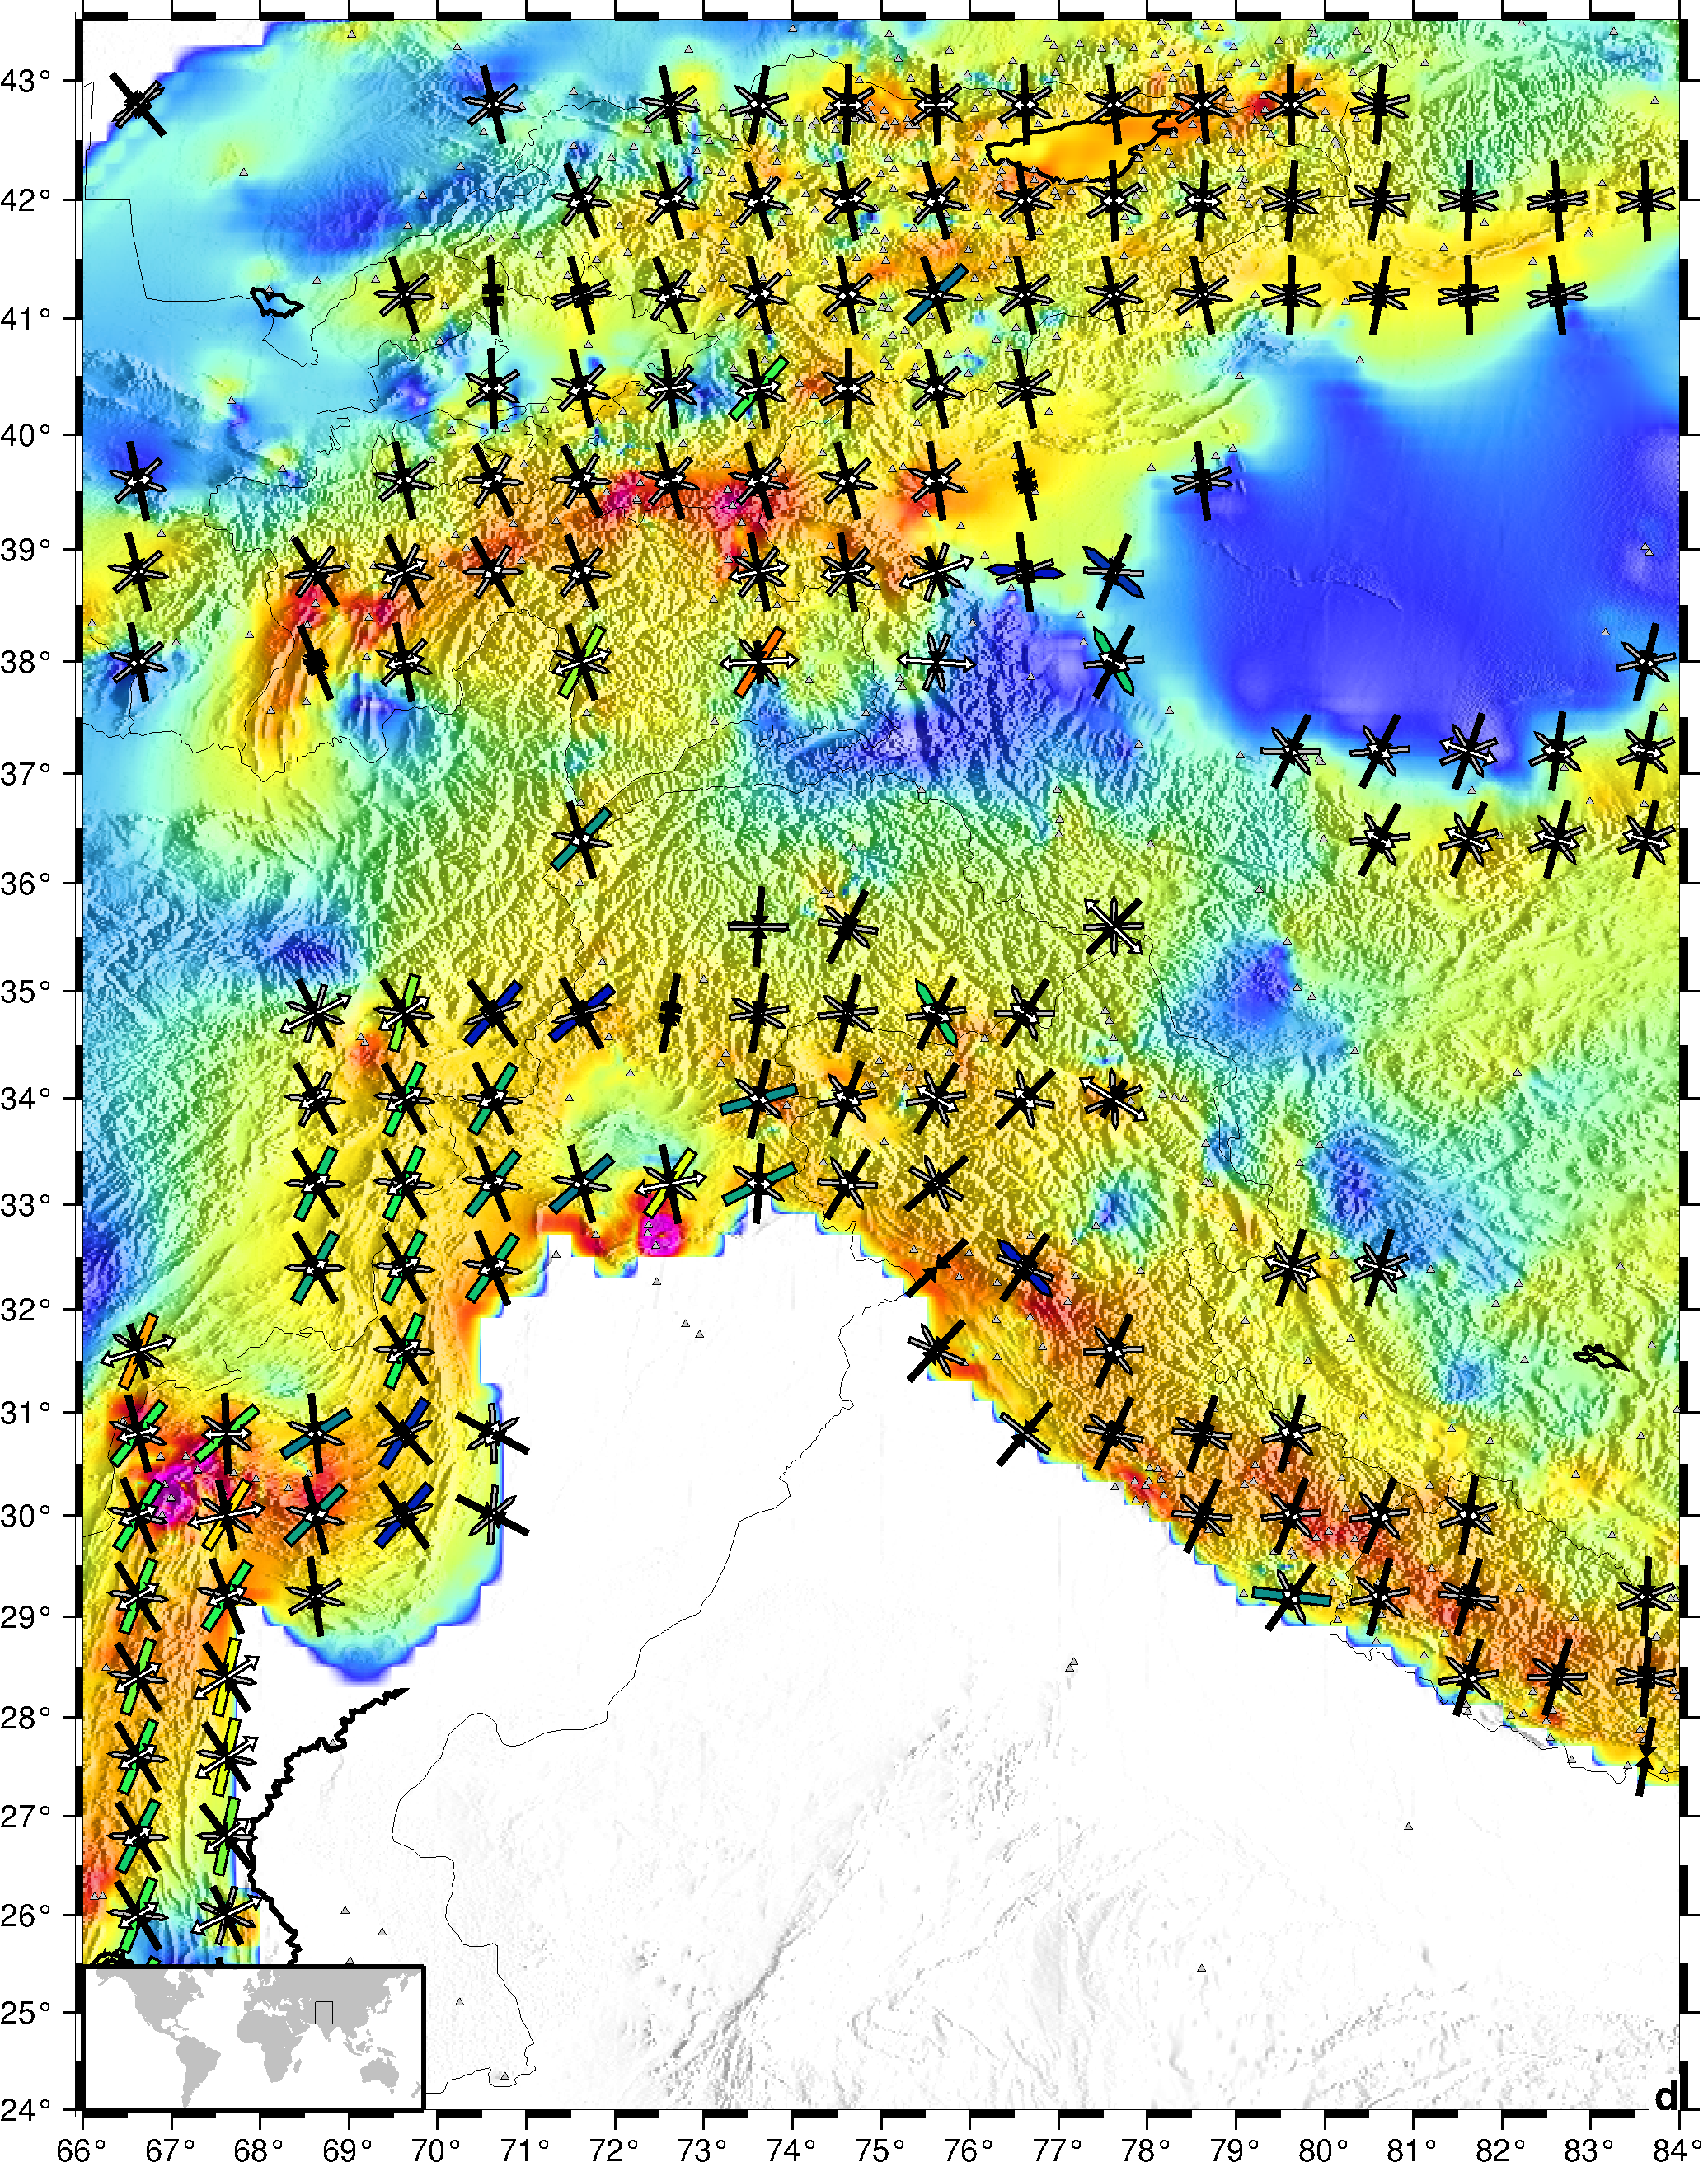
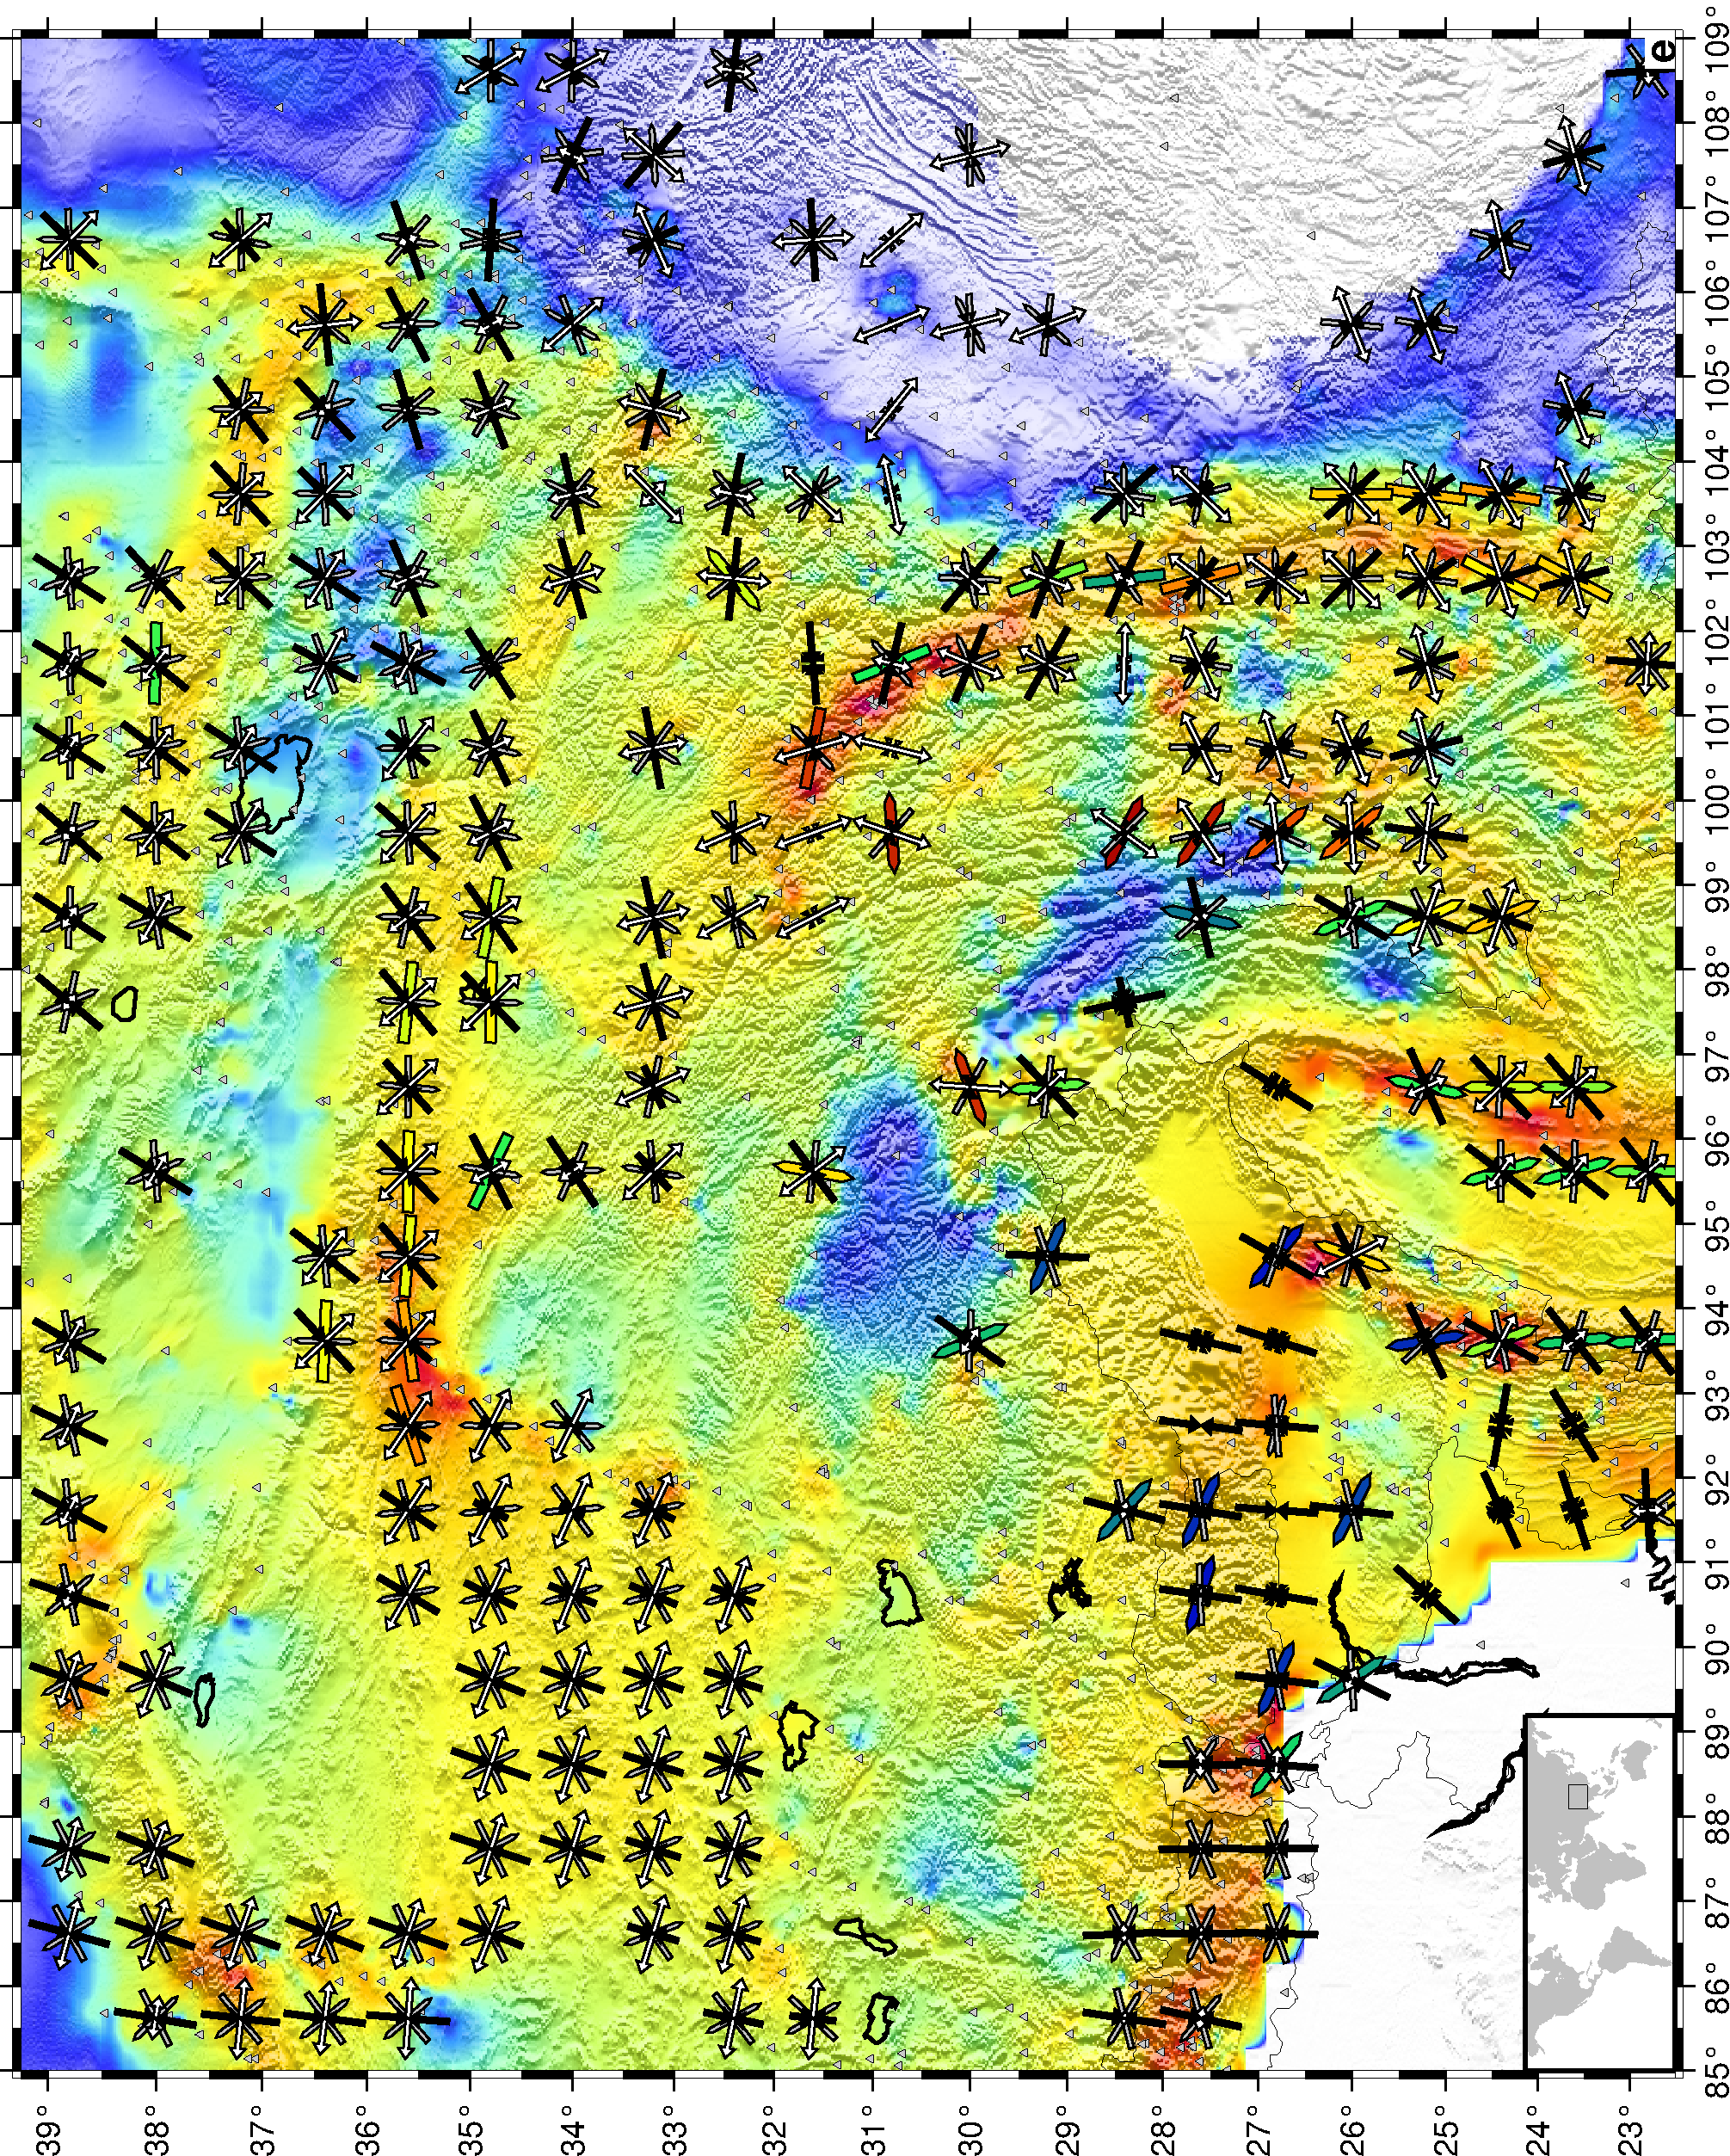
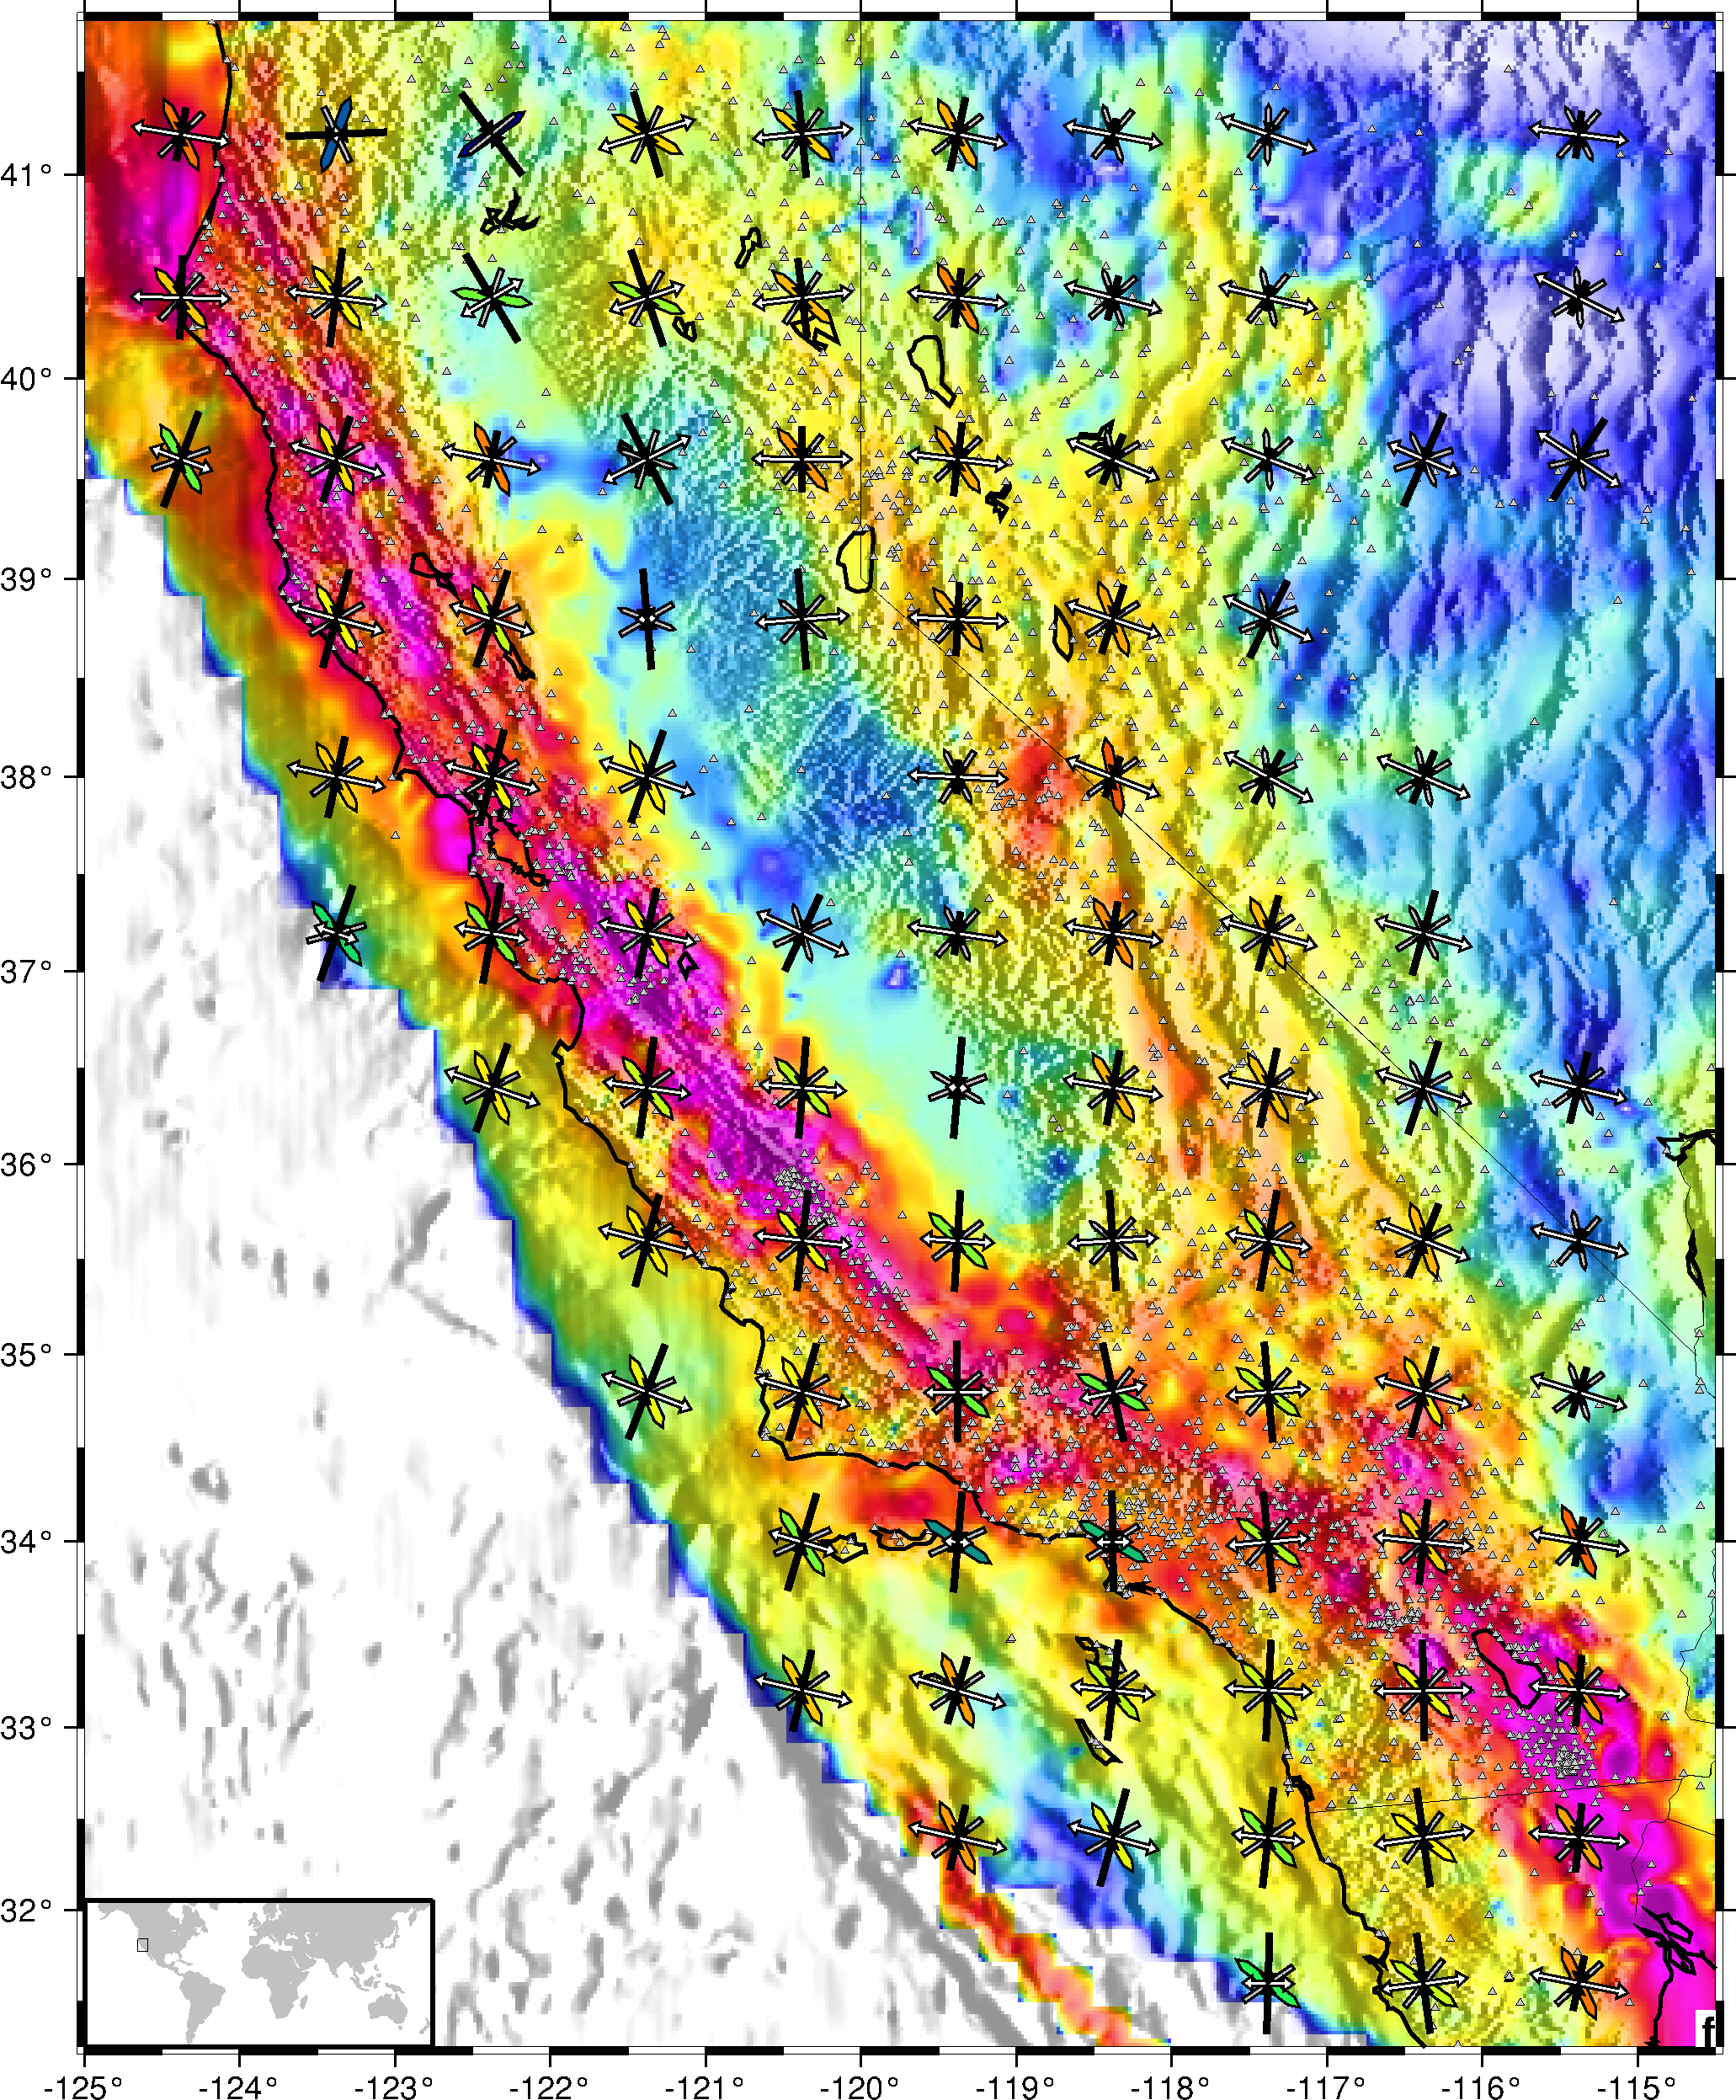
Fig.7 - Regional zooms
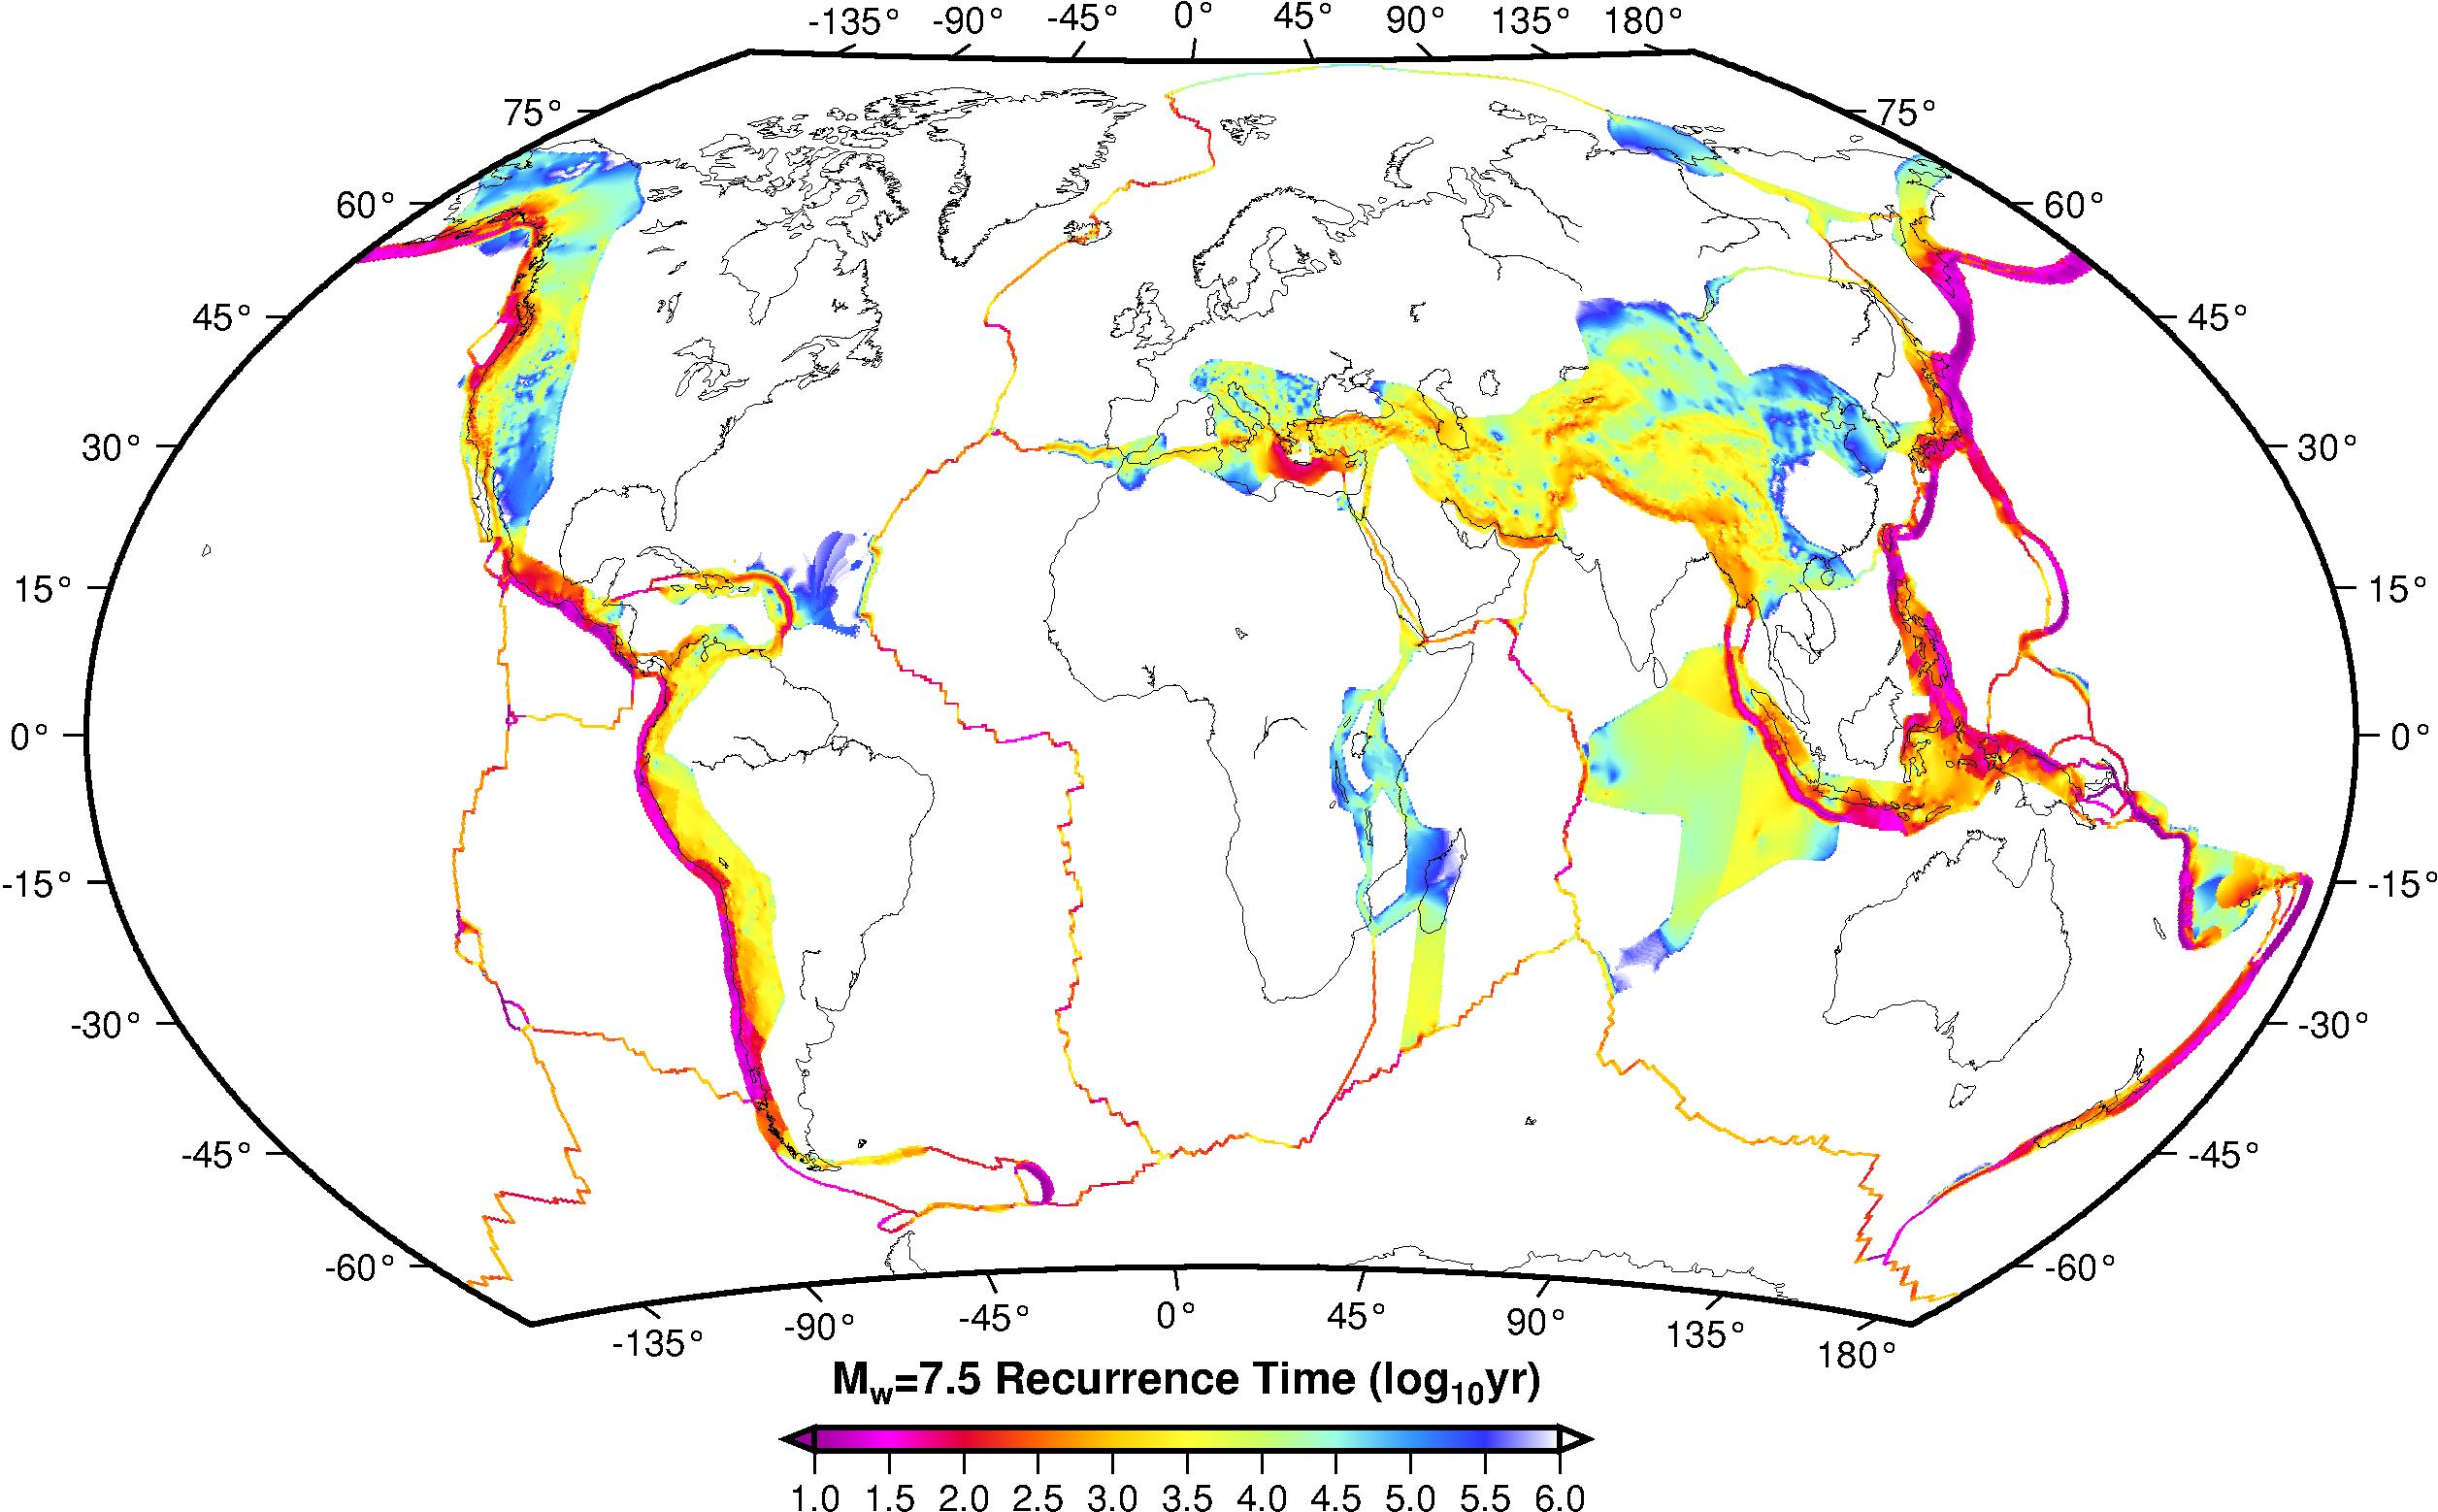
Fig.8 - Predicted recurrence rate of M7.5 earthquake