MAGNET GPS Station - Photo by Geoff Blewitt

Station ID : WST2

Network Operator's Station ID : WST1

Station operator information from: RINEX headers

When using products from this system please cite Blewitt et al., (2018) for the processing plus also the citation for the original data.

Coordinates:

Latitude: 54.528 degrees

Longitude: 11.060 degrees

Height: 50.518 meters


Time Series Data

(ascii text)
24 Hour Final Solutions

IGS20

tenv3 or tenv

xyz

EU

tenv3

24 Hour Rapid Solutions

IGS20

tenv3

EU

tenv3

5 Minute Final Solutions

IGS20

kenv tar files for download

5 Minute Rapid Solutions
(last 60 days max)

IGS20

kenv tar file download

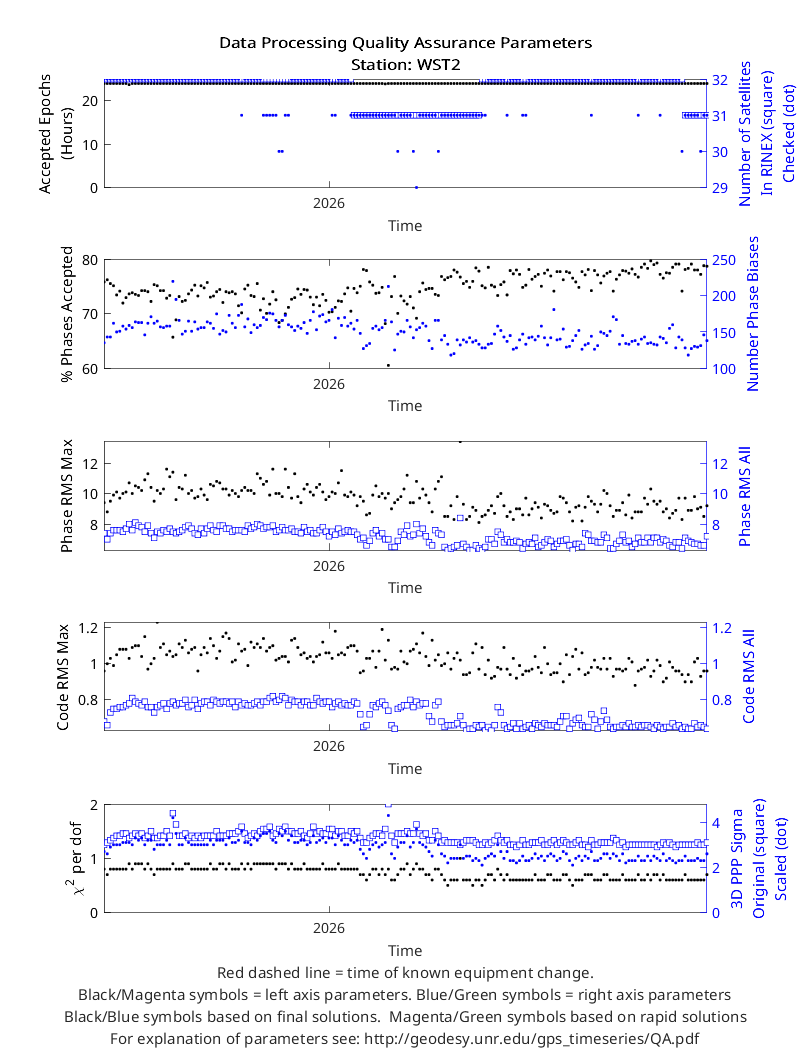
Quality Assurance (QA) Files

IGS20

.qa.gz file download

5 Minute Troposphere Solutions

Tot./Wet Zenith Delay, etc.

tar files for download


Surface Mass Loading Predictions
Note: NGL solutions are in CM
Subtract CM:CF file to place in CF

CM:CF Translation

CM

NTAL

NTOL

GRACE Mascon

CF

NTAL

NTOL

GRACE Mascon


Nearest 4 Other Stations Distance

WES1

0.00 km

D719

0.16 km

LEUC

12.13 km

BUNG

41.04 km

Link to Map with all stations centered on WST2


Readmes With File Formats and Other Information:

tenv3, tenv, xyz, kenv, trop, QA file,
loading predictions file format

Time Series Plots

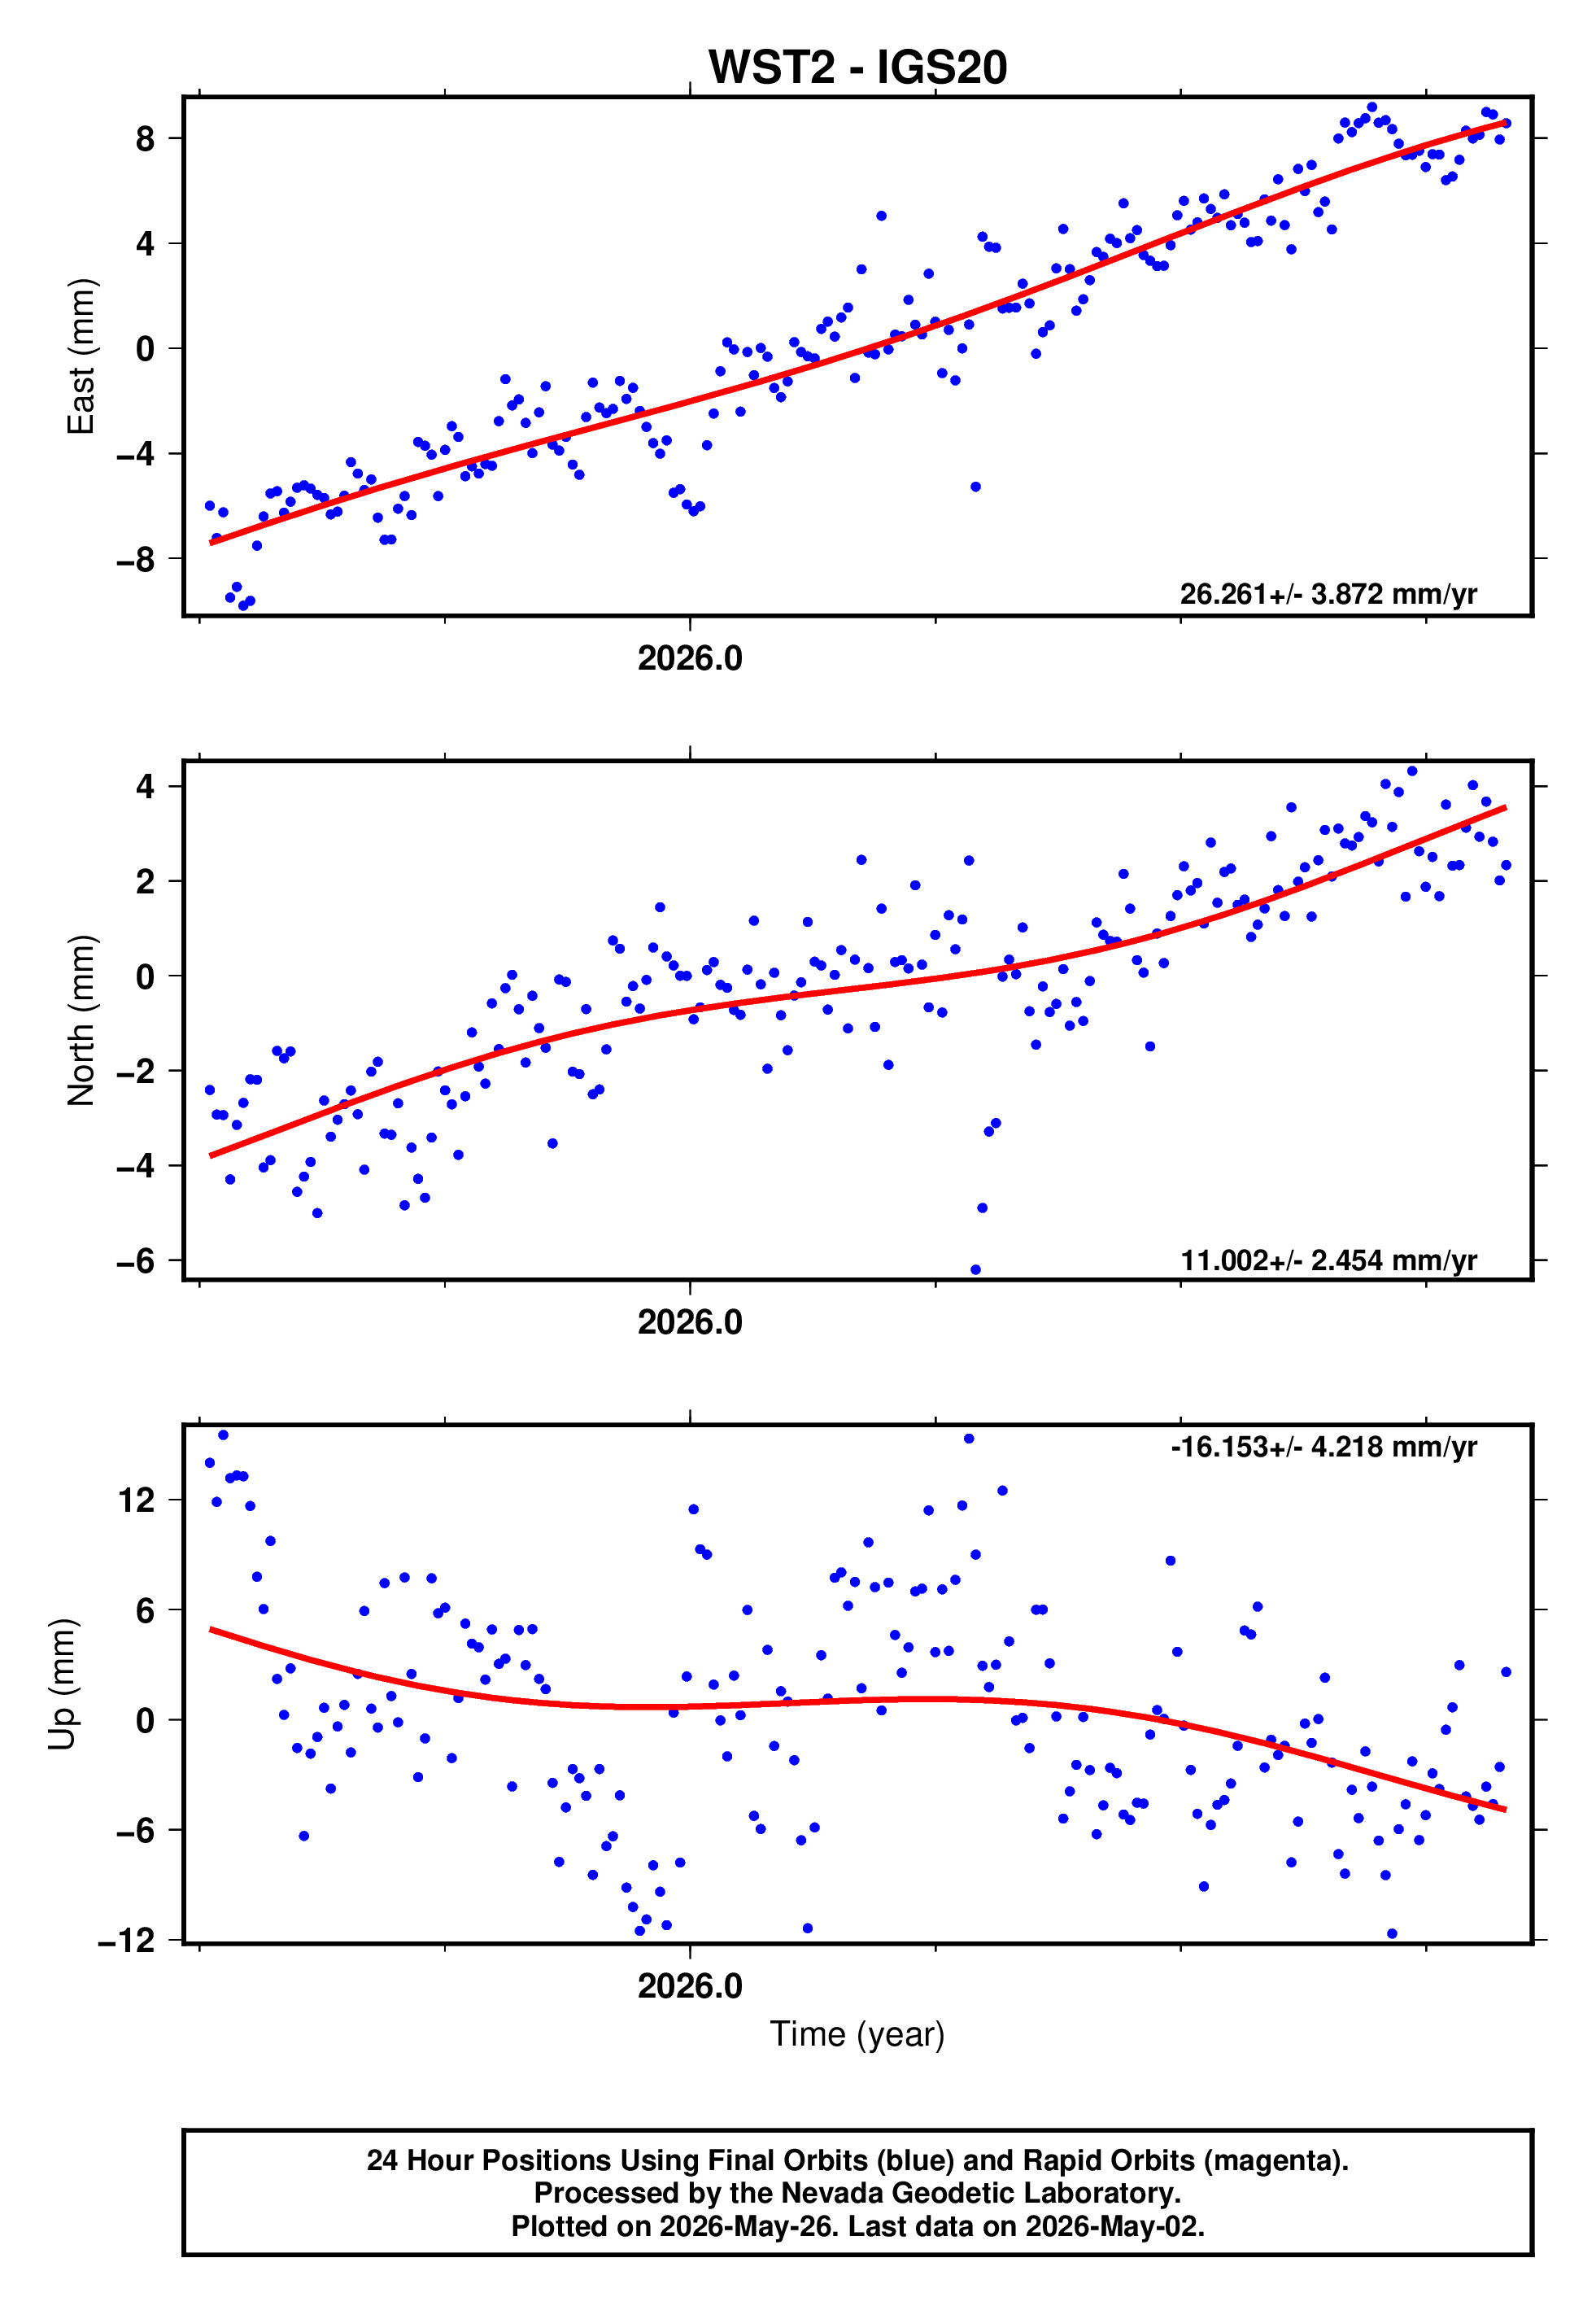
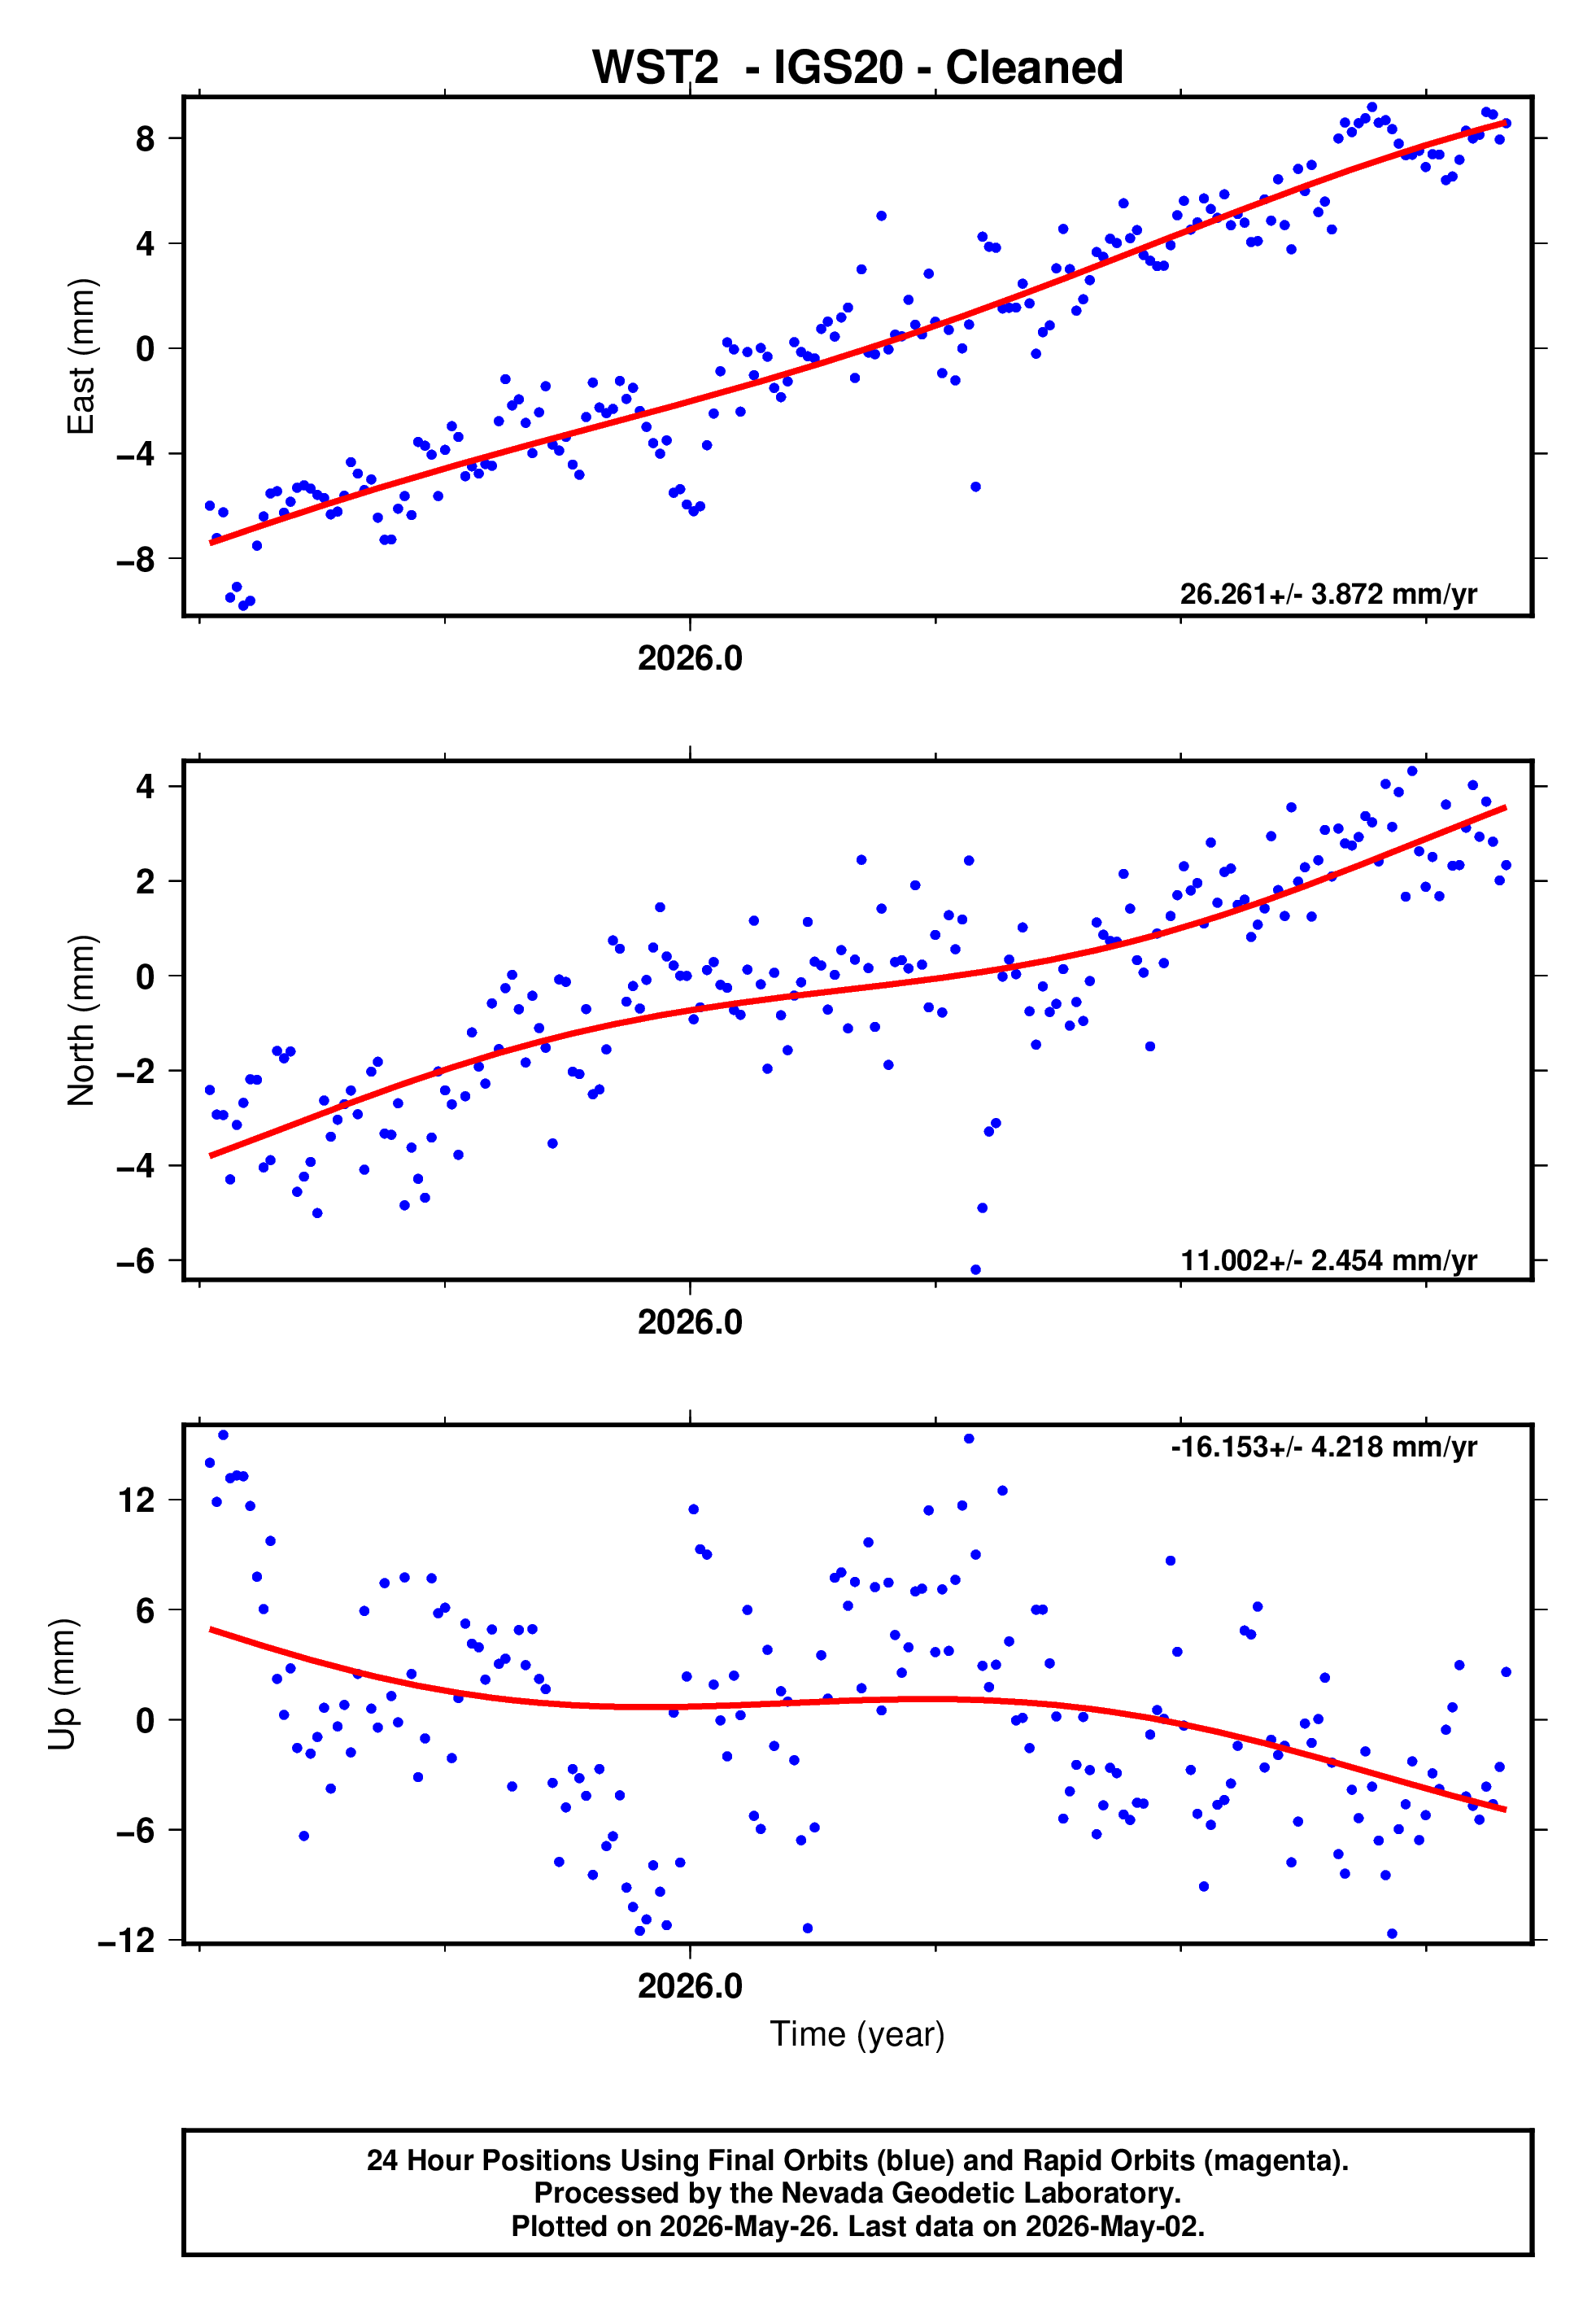
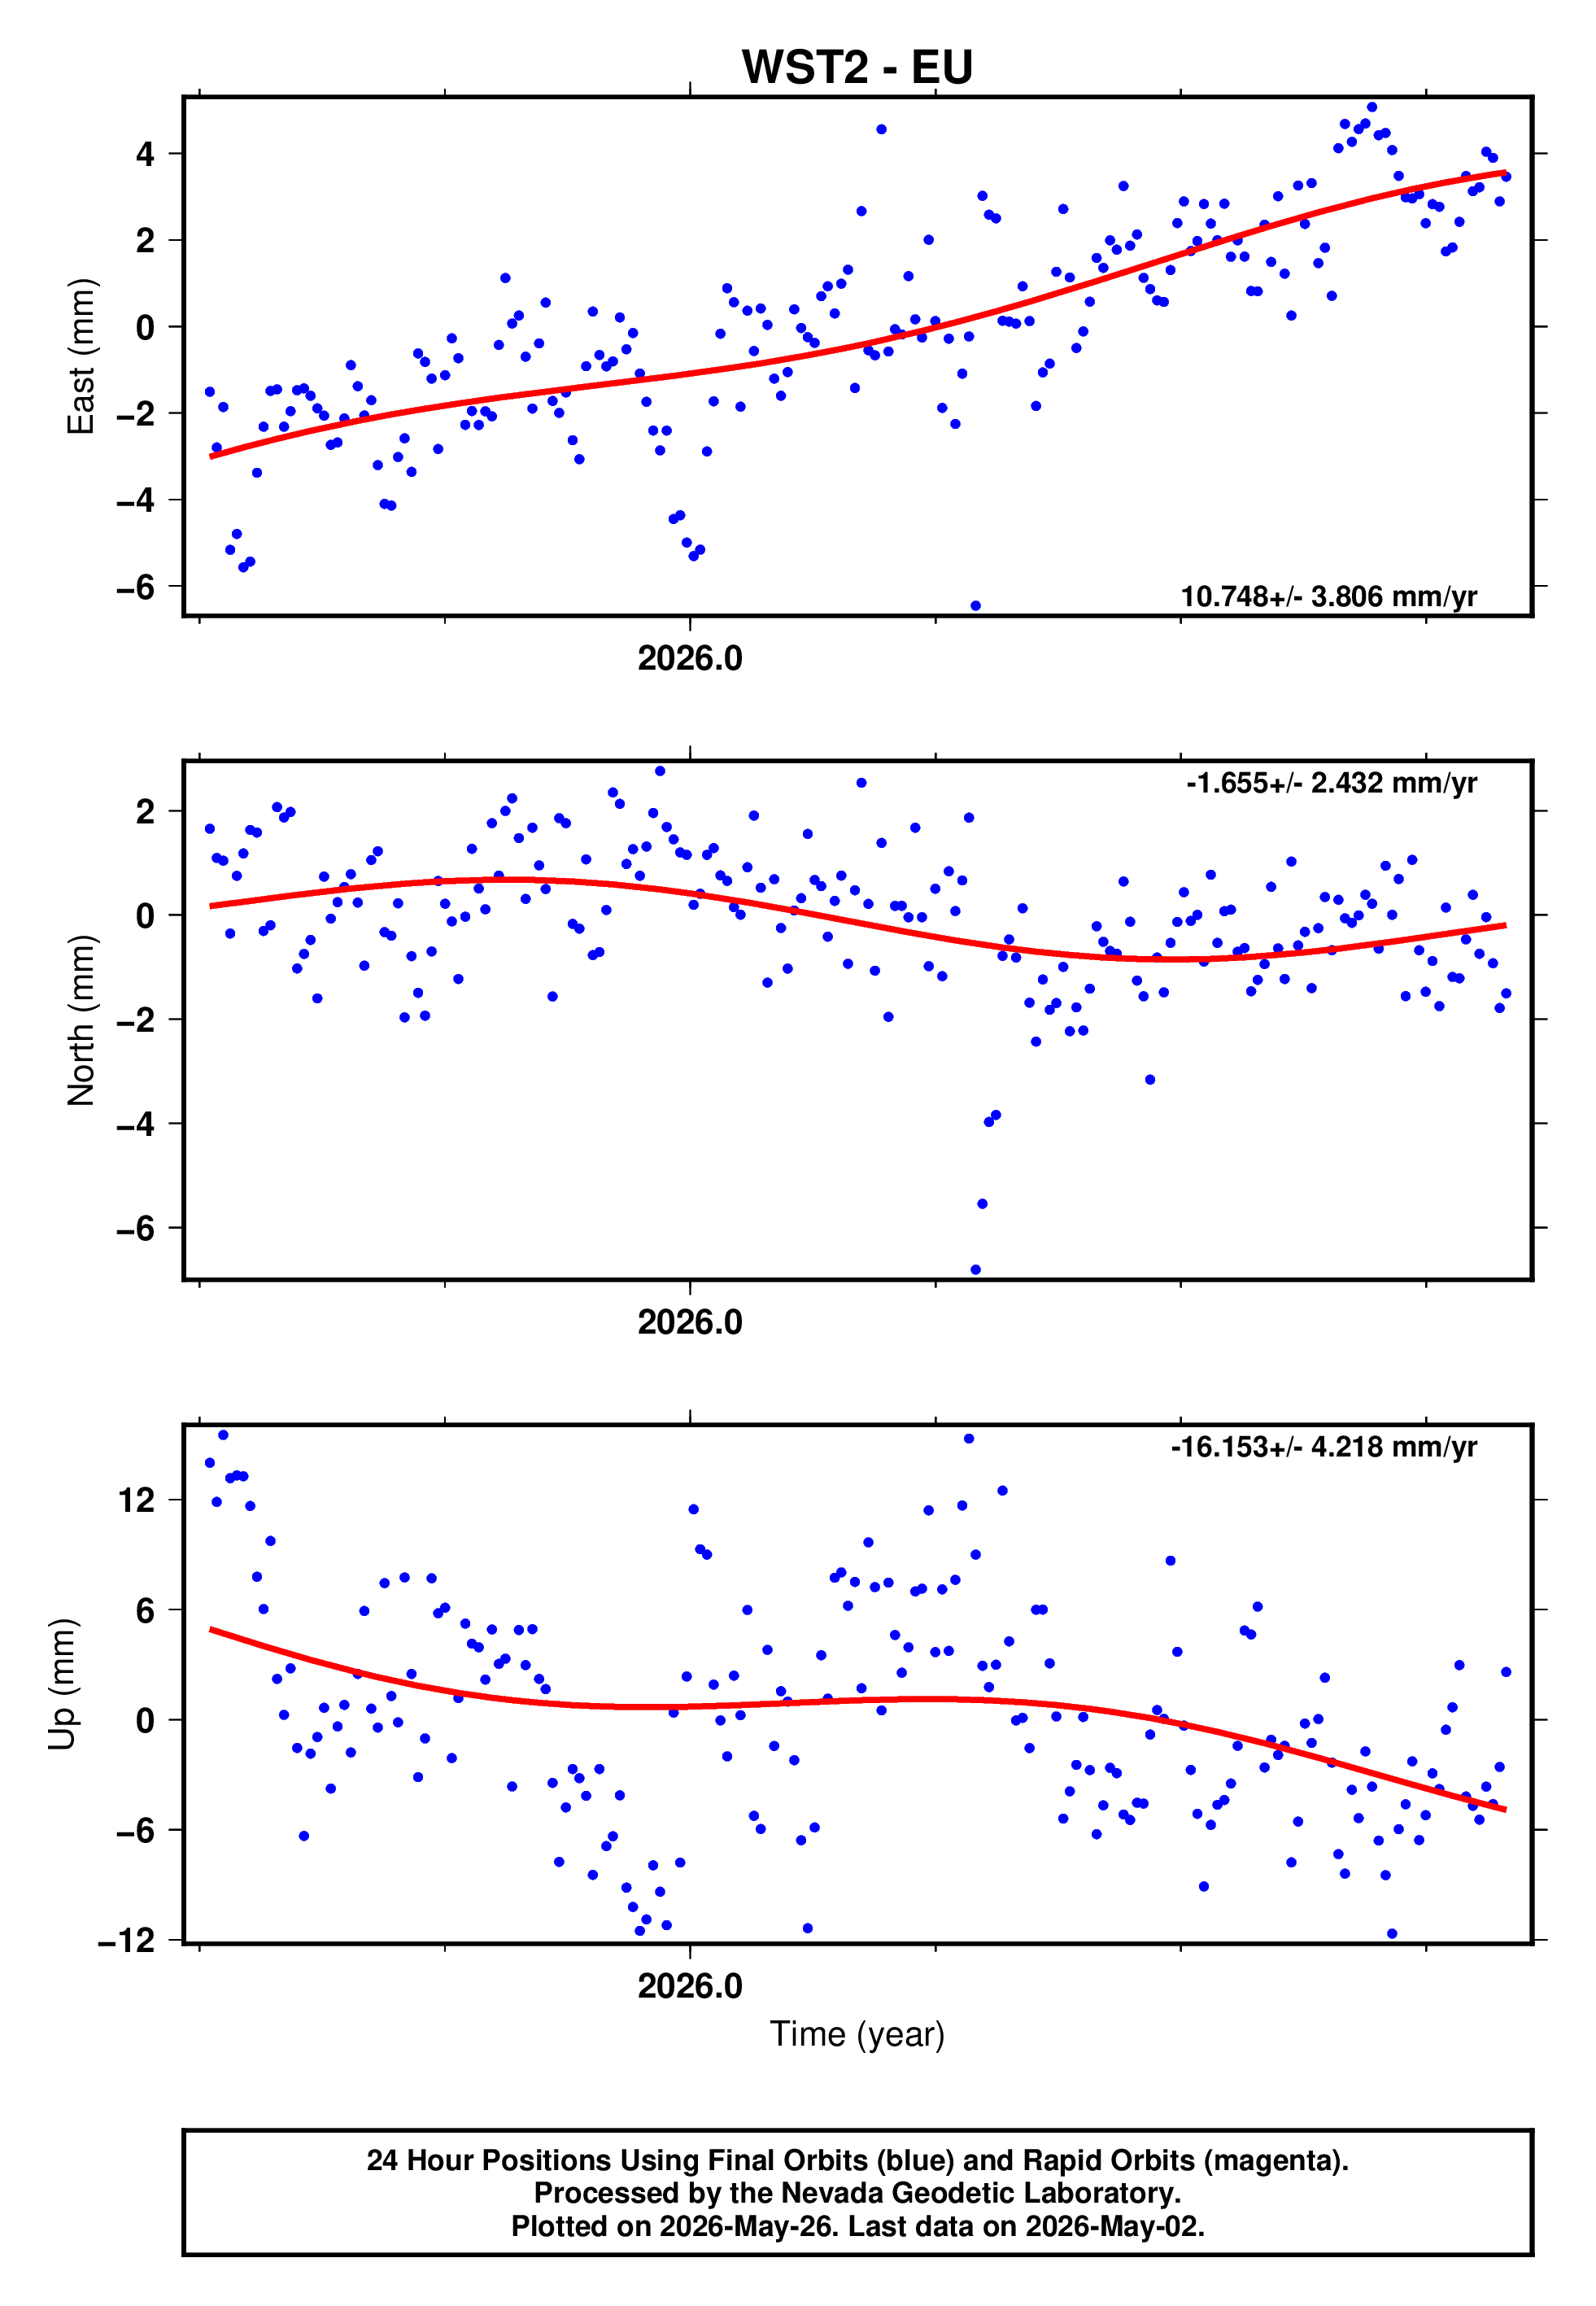
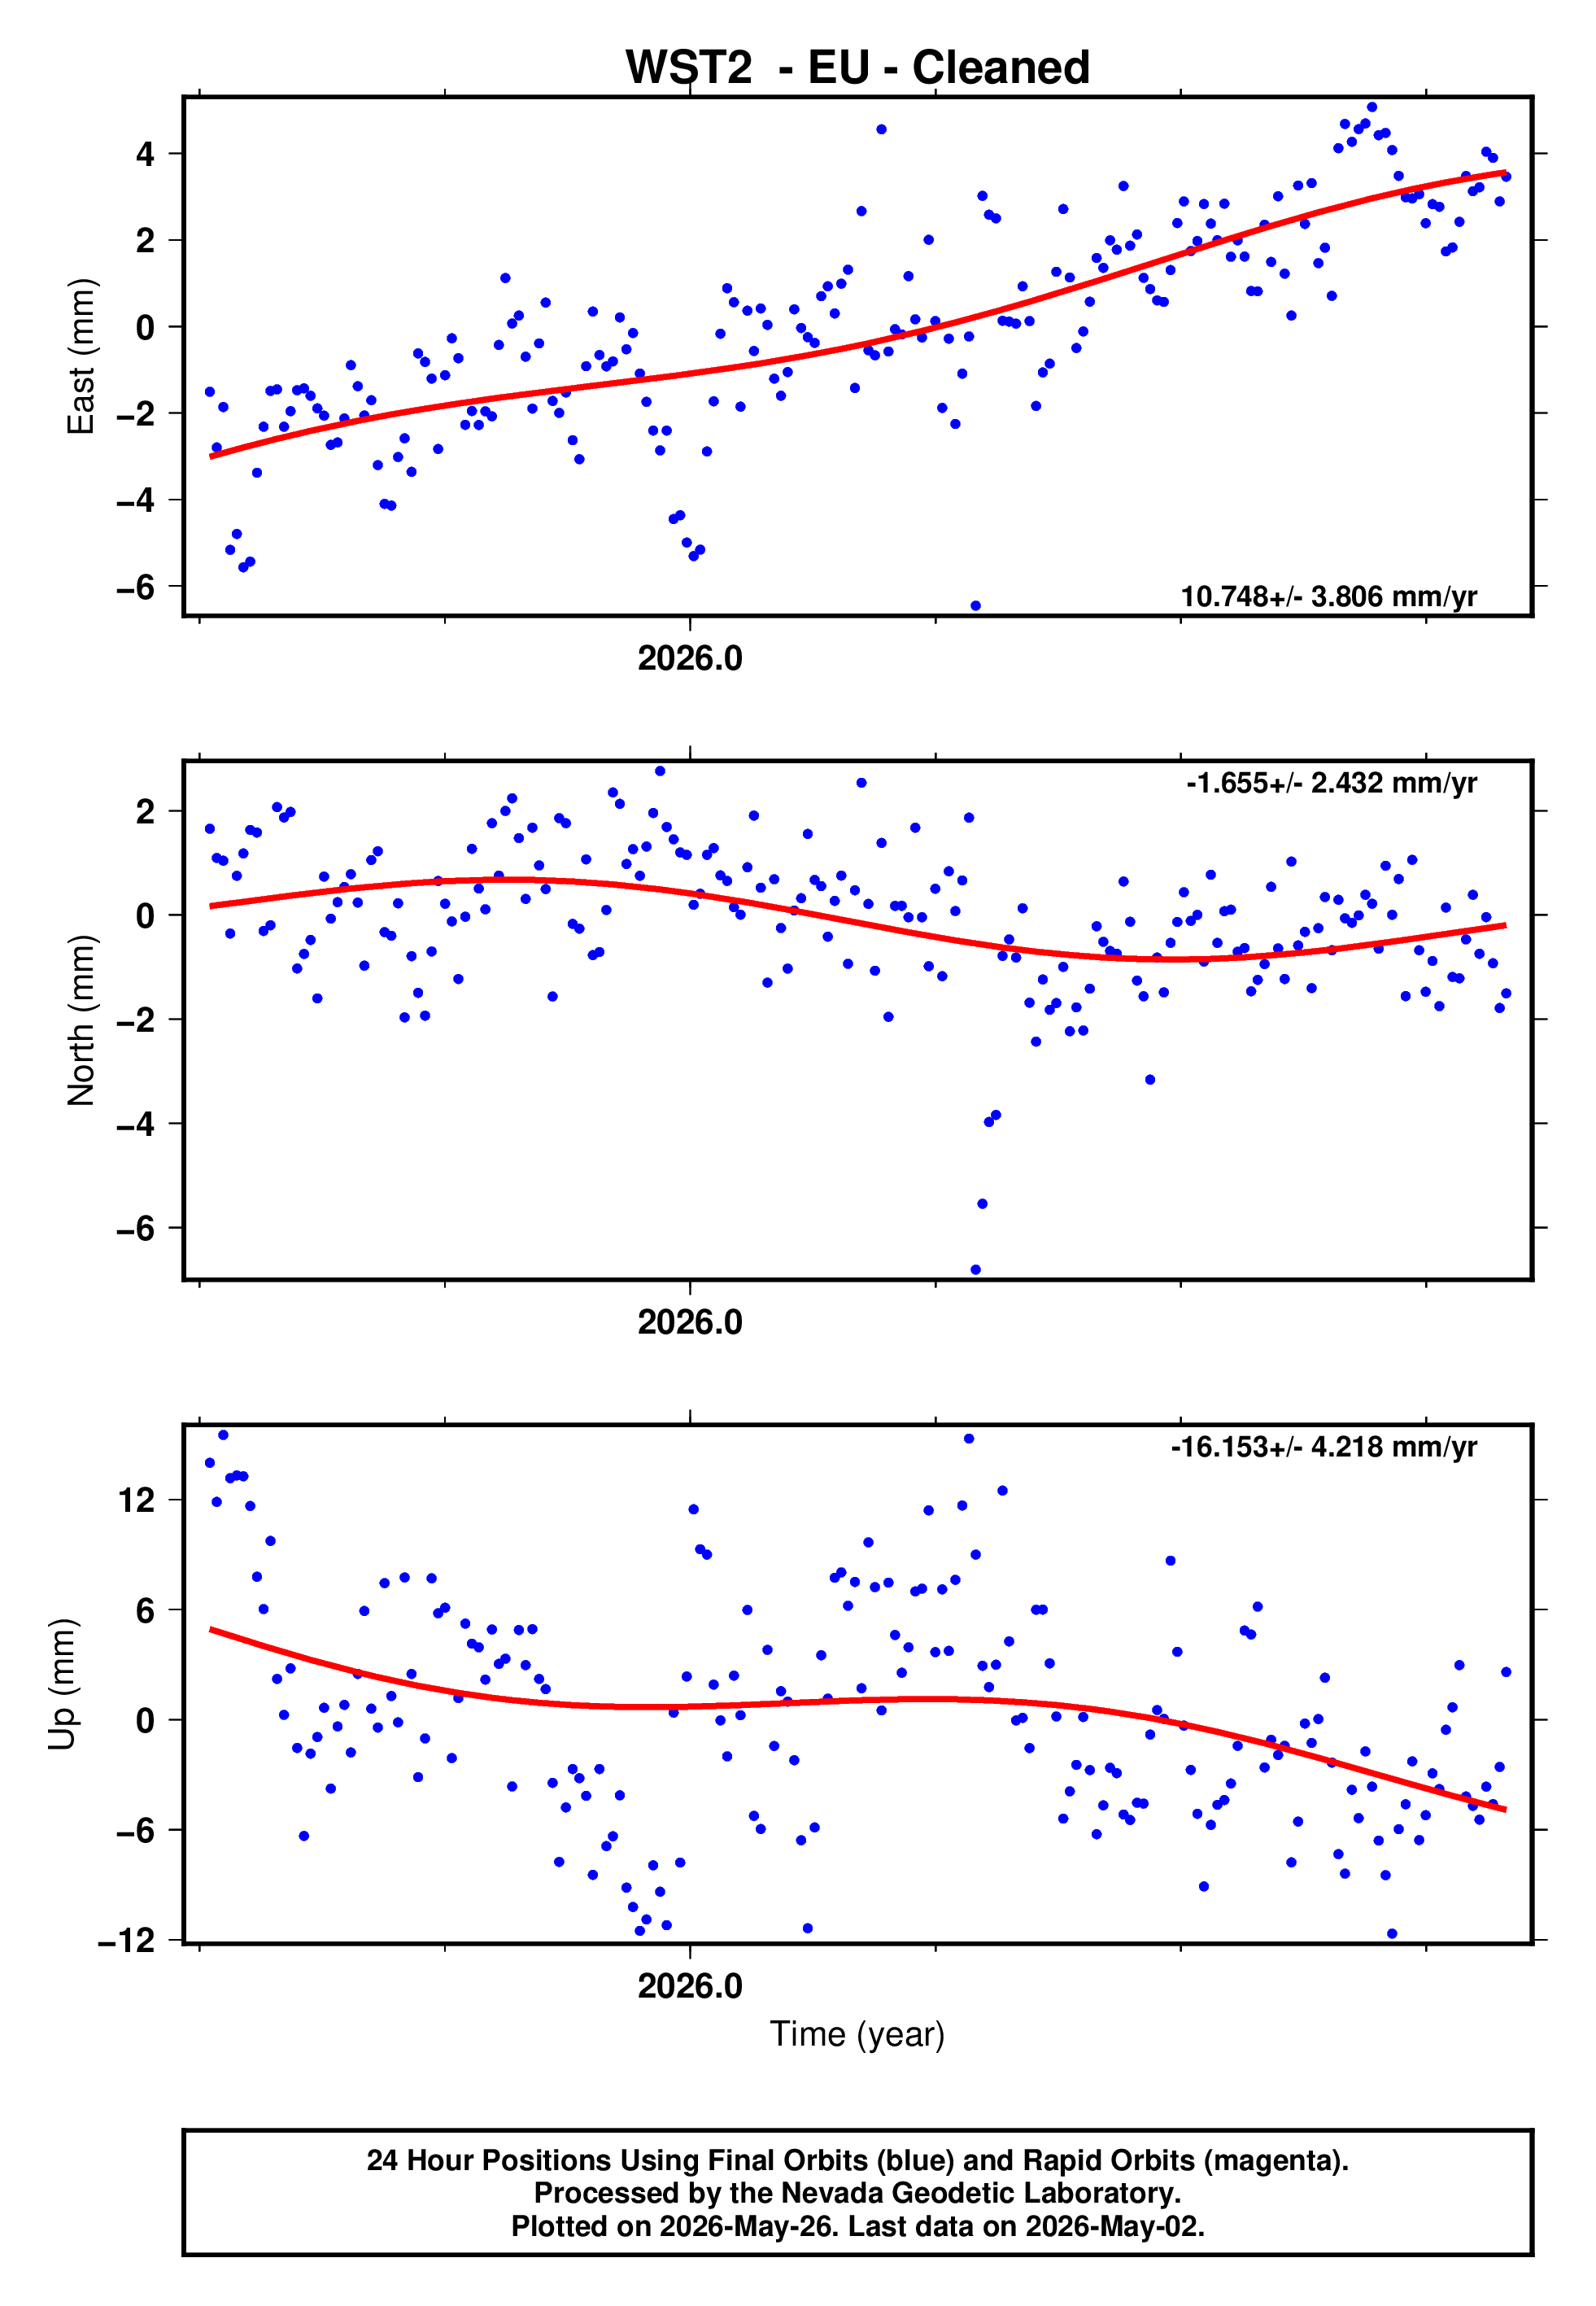
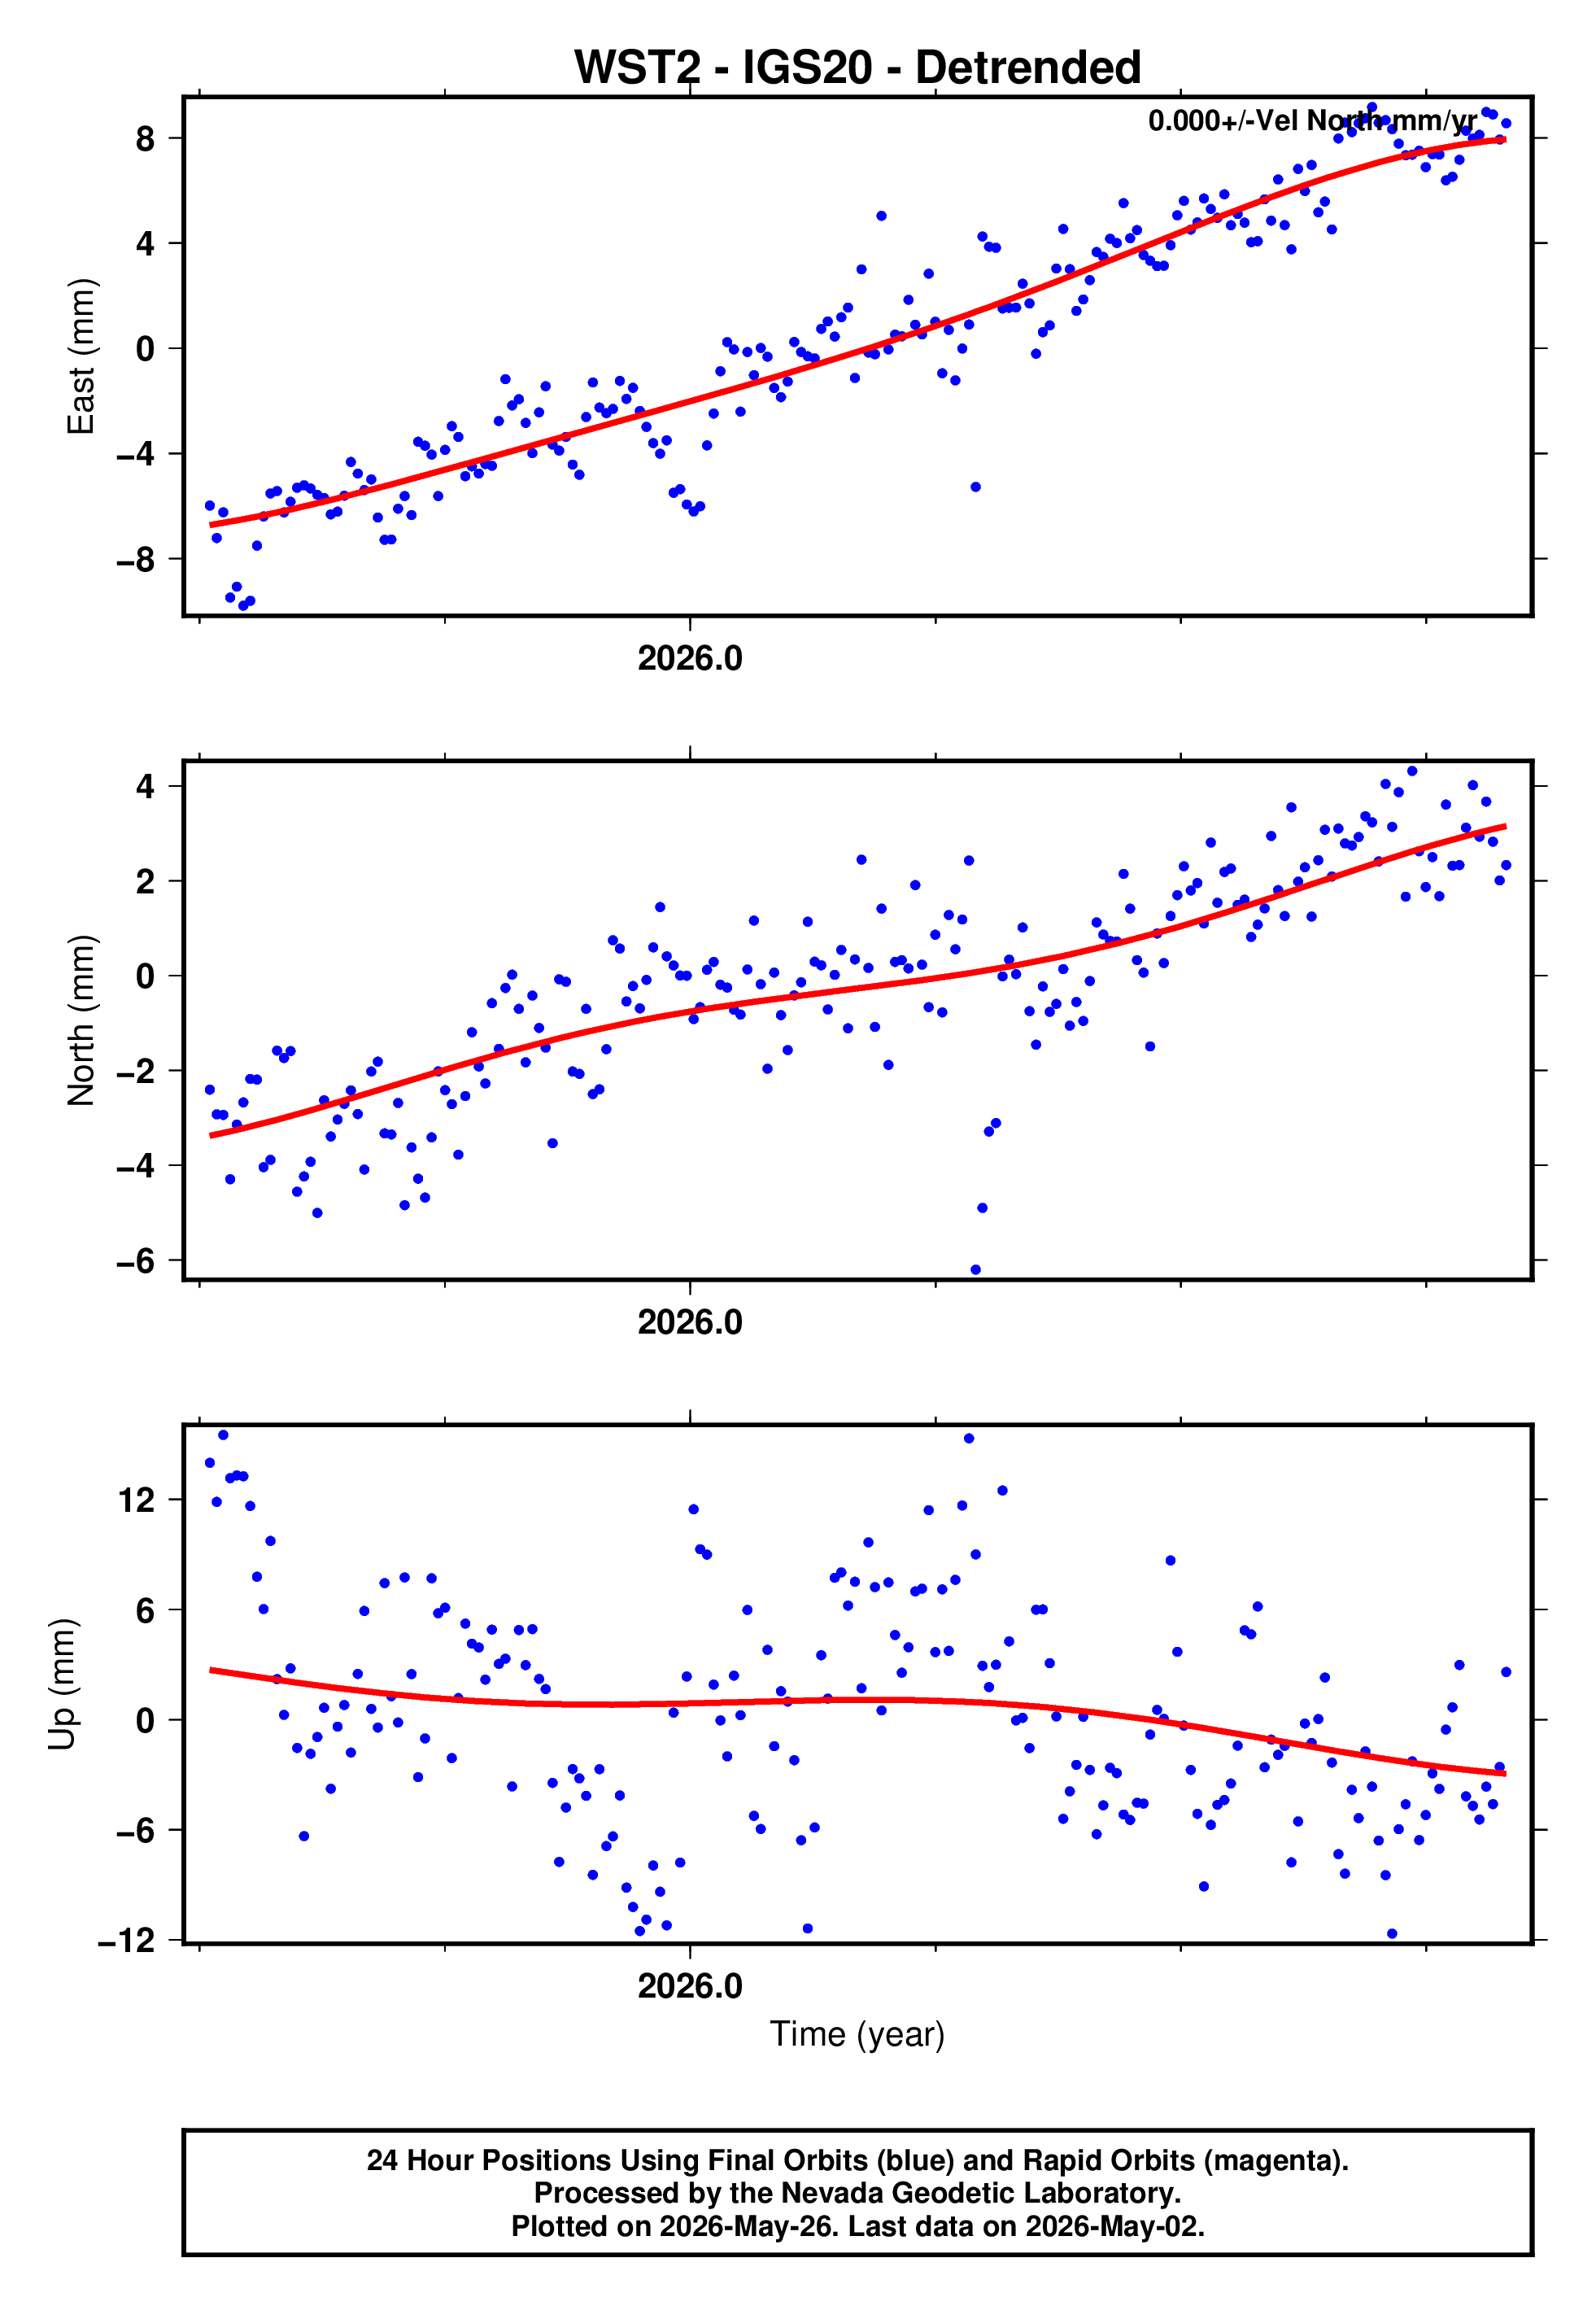
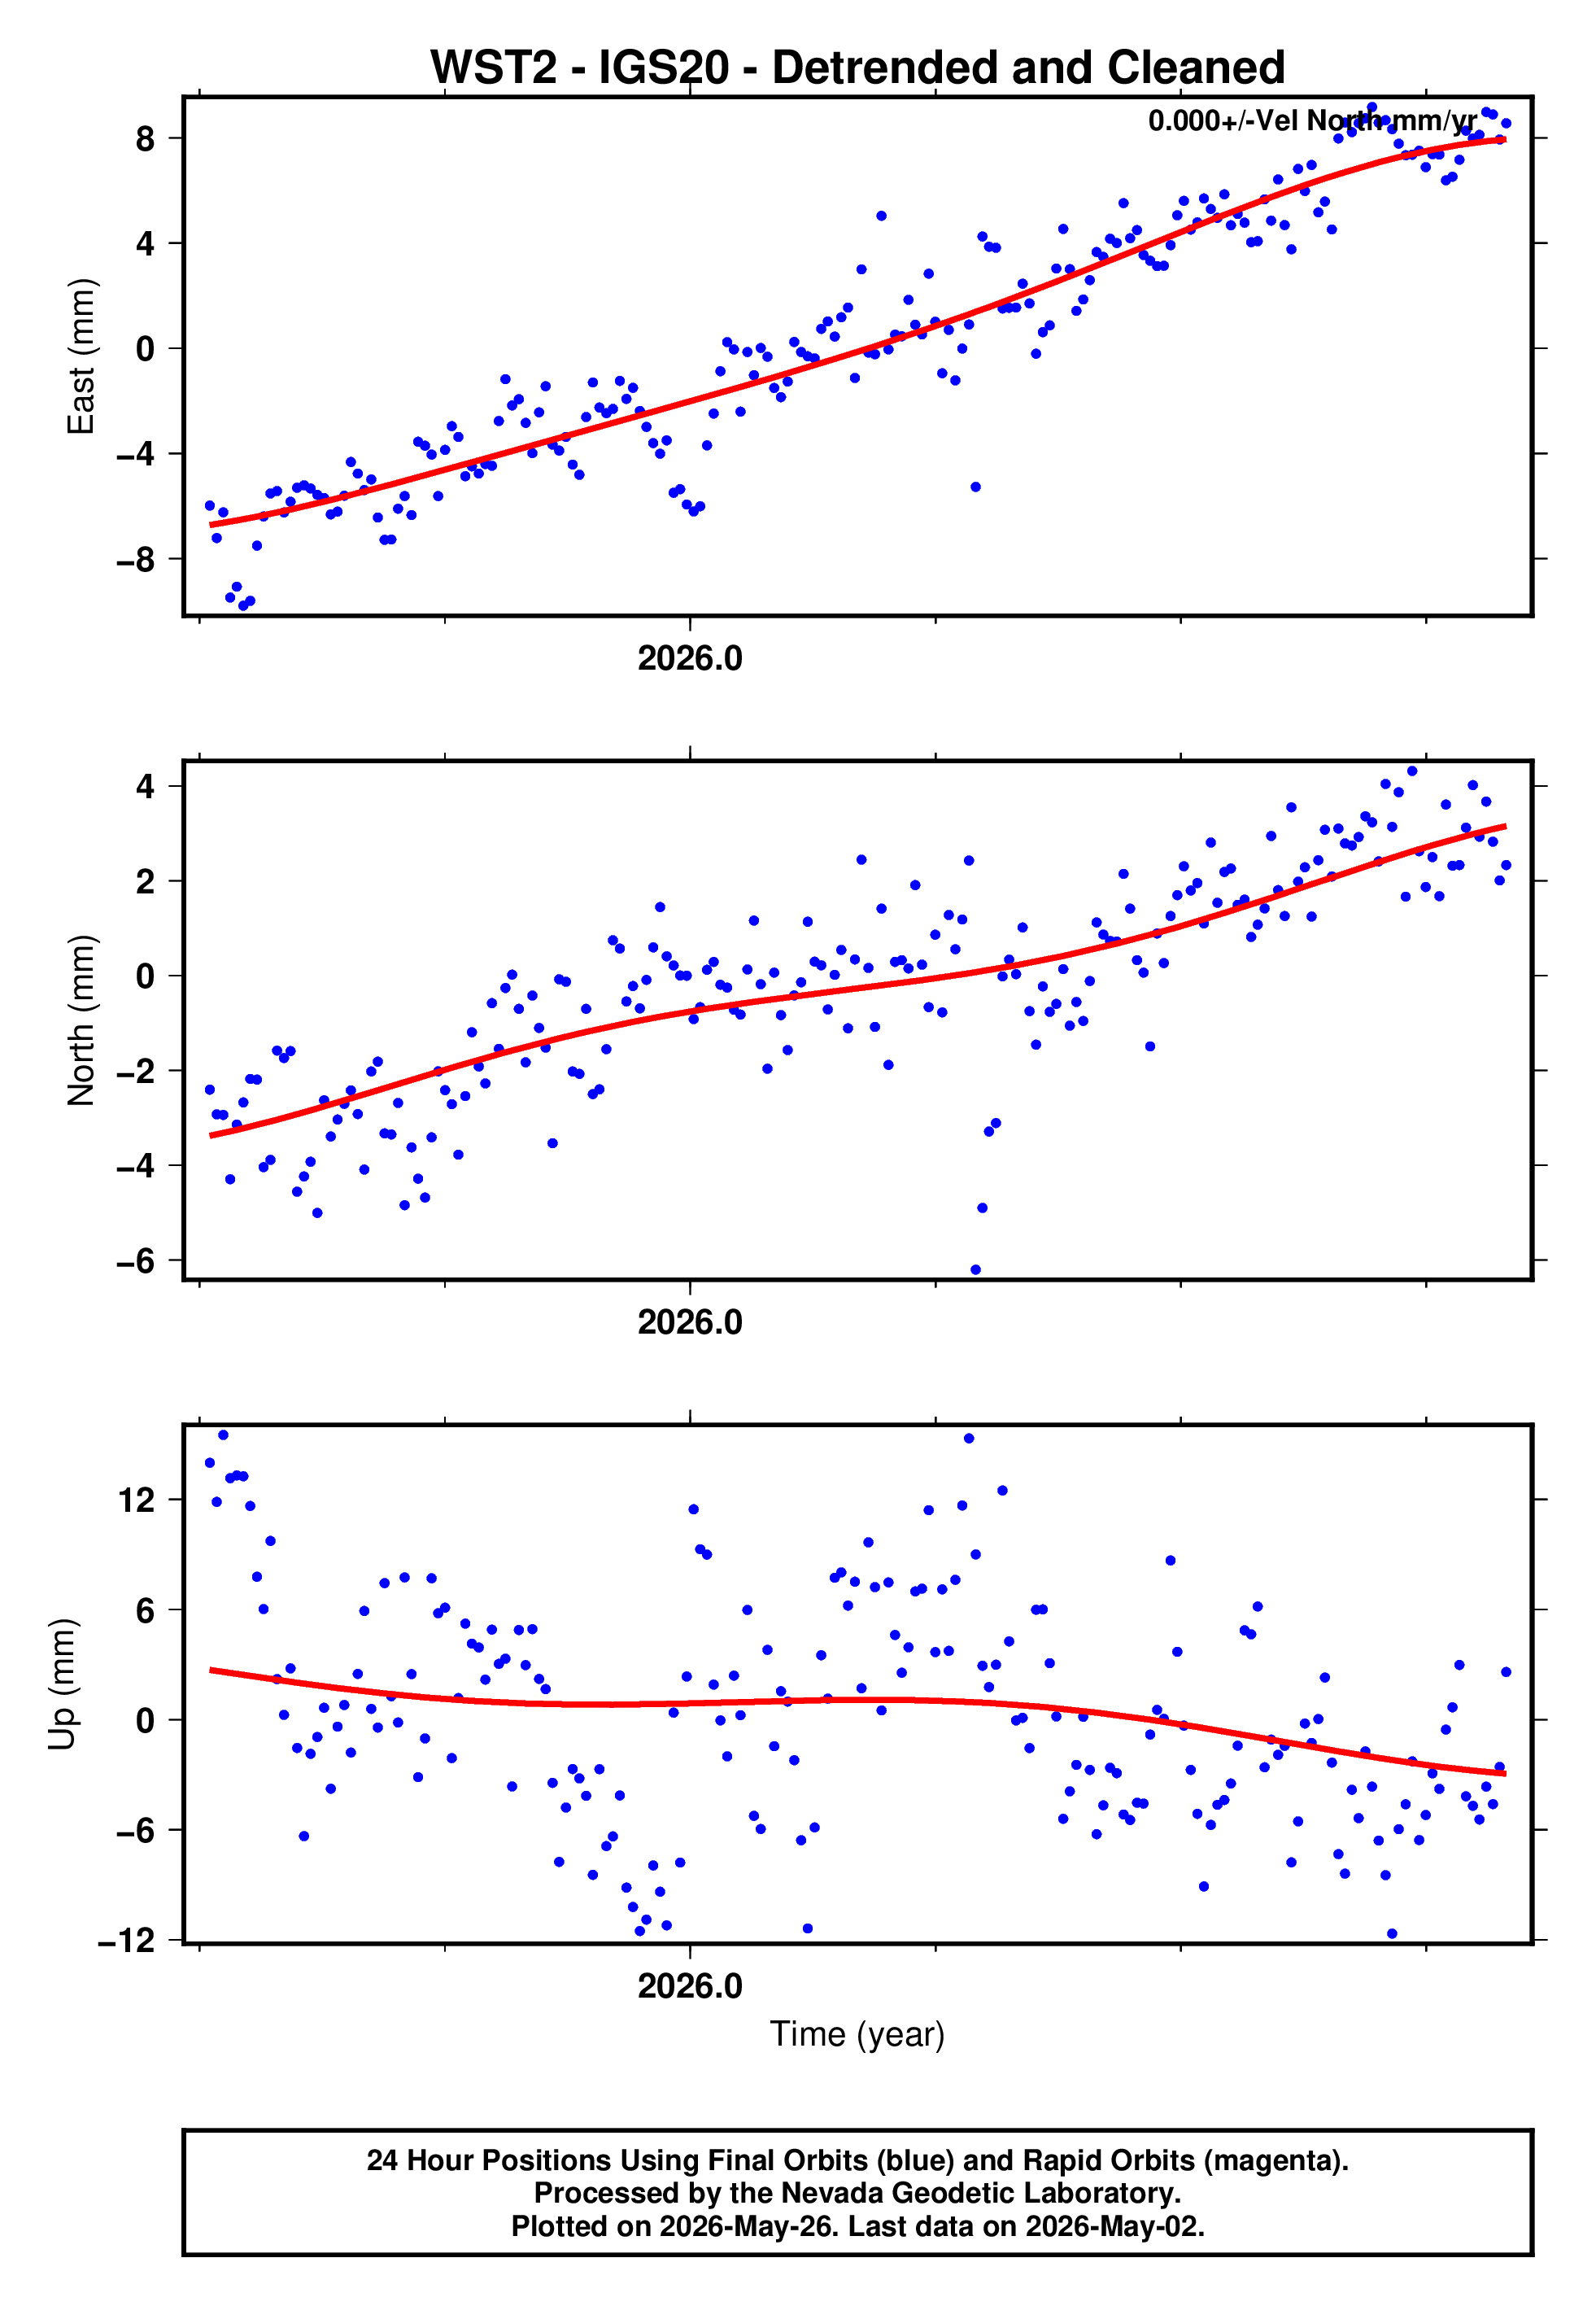
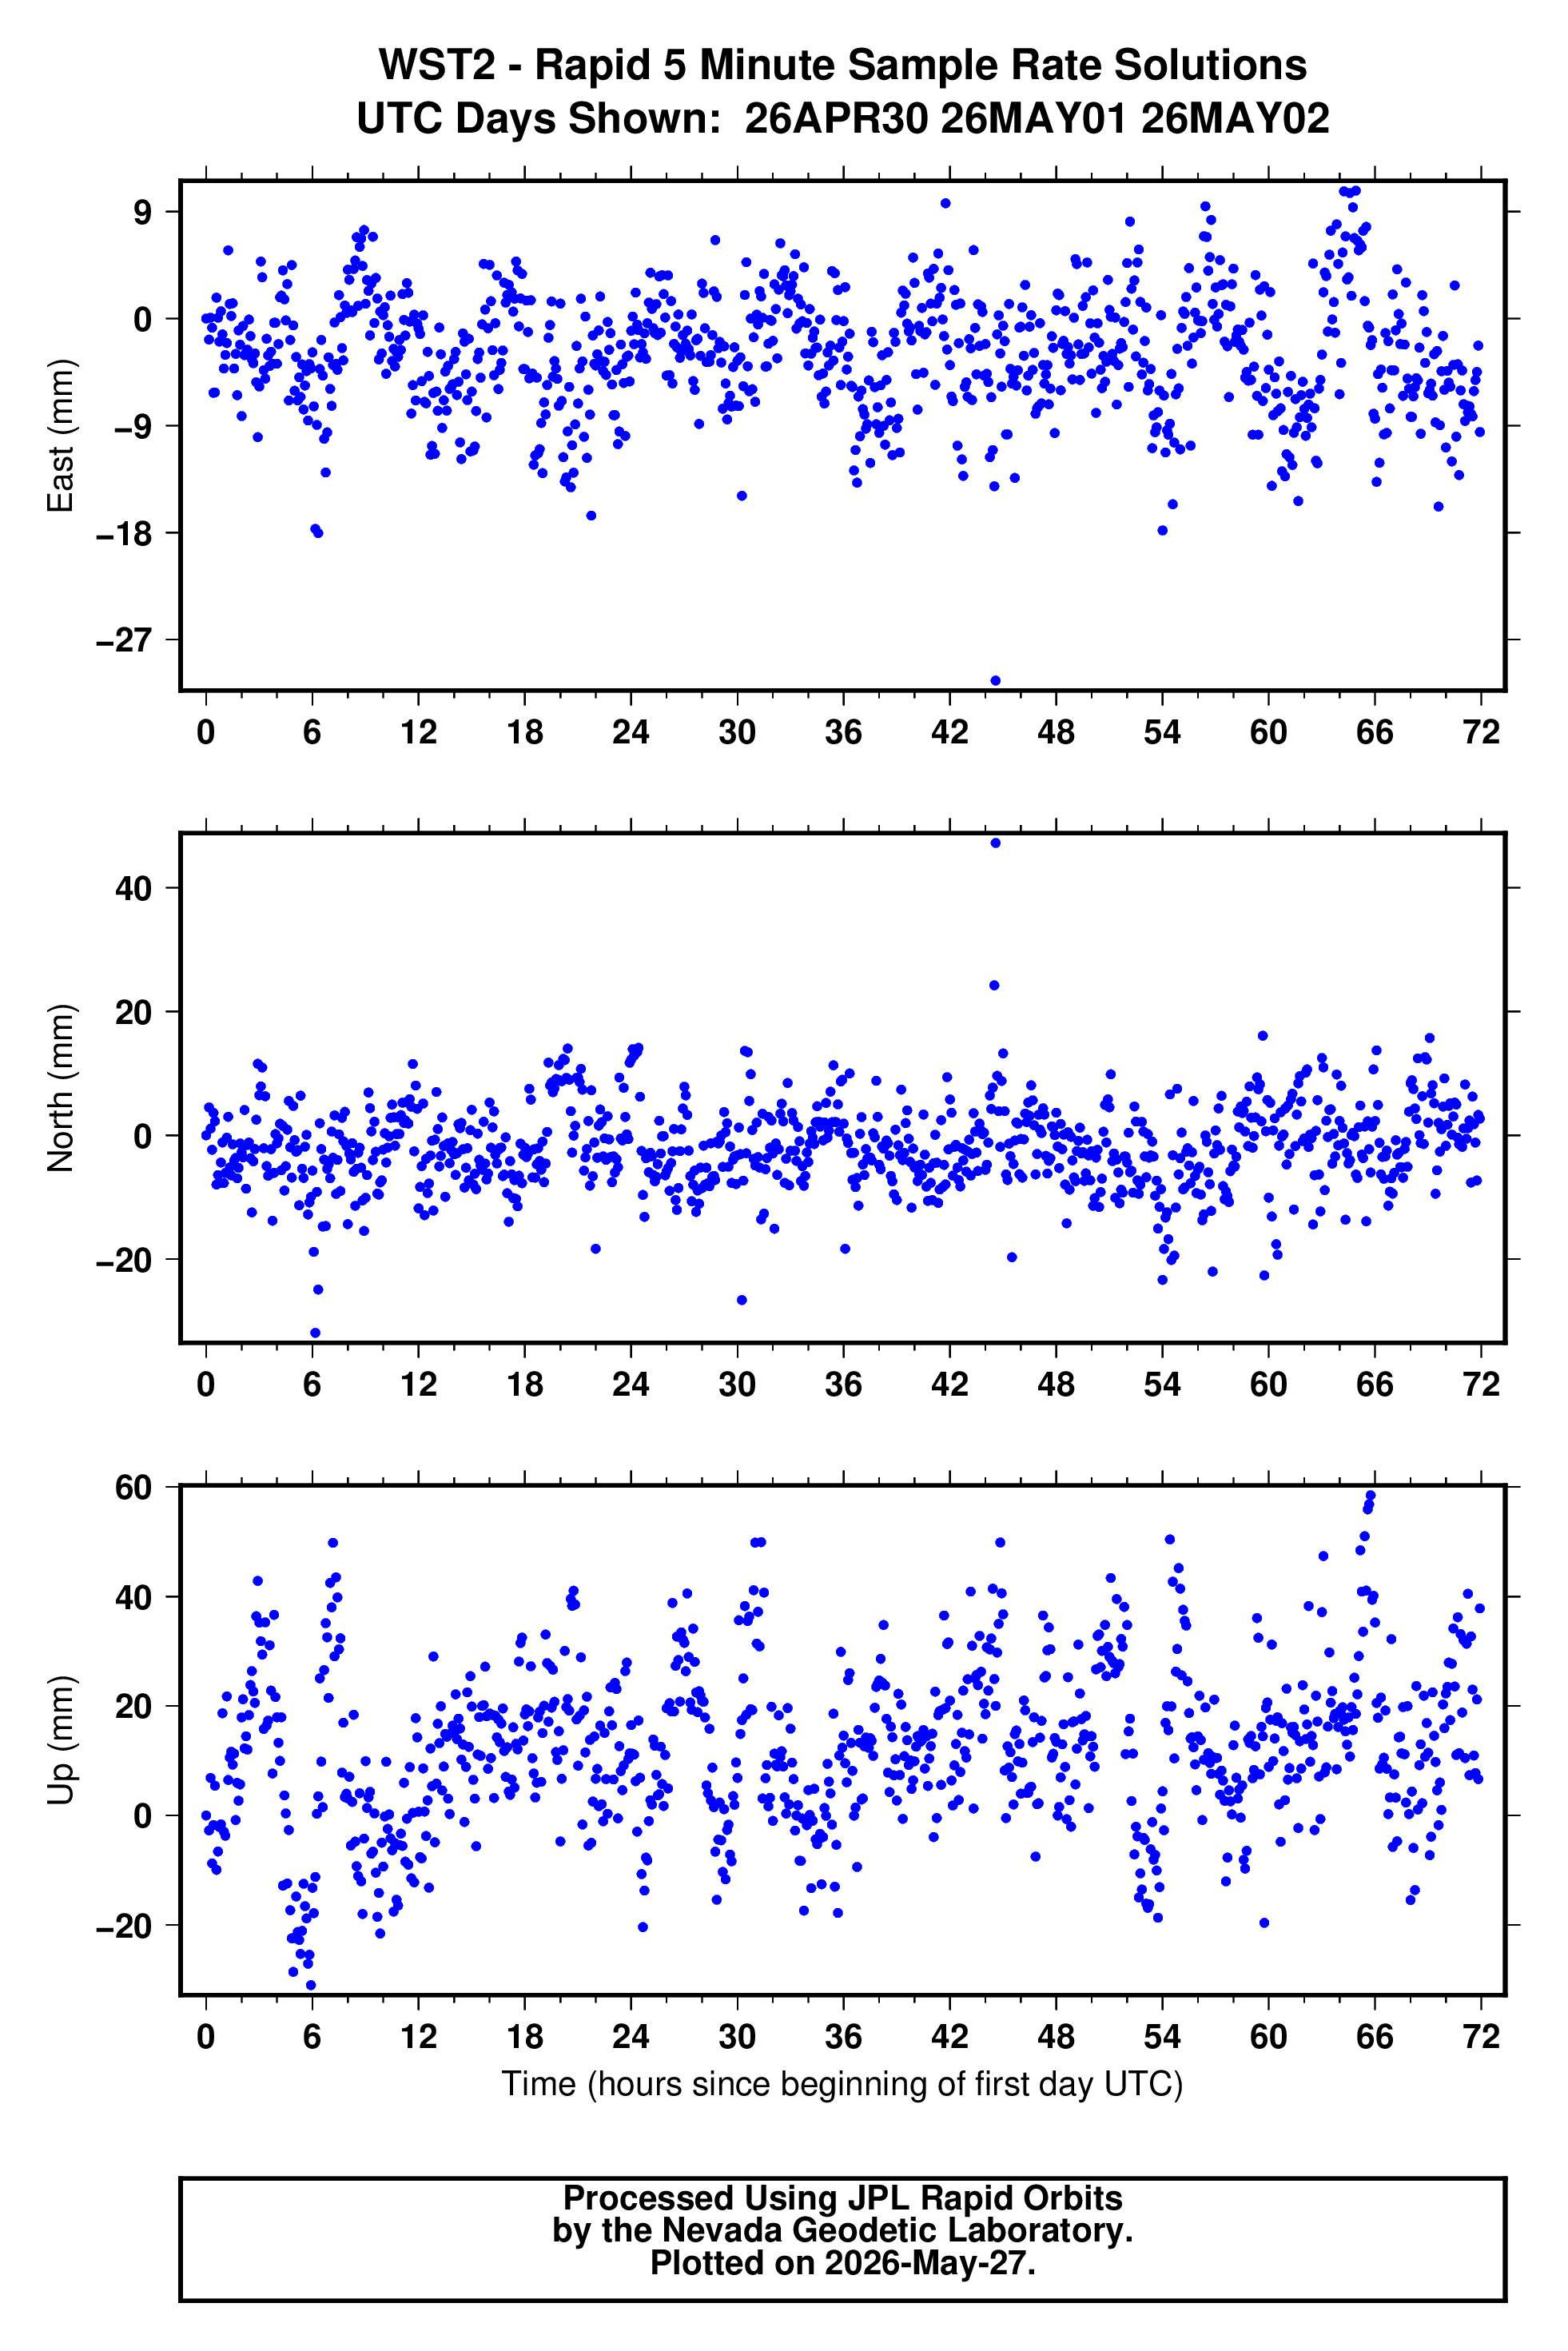
Click on the buttons on the left below to choose from available reference frames, latencies, and sample rates. Original, Cleaned (outlier removed) and detrended (using MIDAS rate) plots are available. See plot explanation page for further explanations on plot contents.

GPS time series plot

Parameters for the red line fit to the original position time series can be found at:
THIS LINK

GPS time series plot

Parameters for the red line fit to the cleaned position time series can be found at:
THIS LINK

GPS time series plot

Parameters for the red line fit to the EU position time series can be found at:
THIS LINK

GPS time series plot

Parameters for the red line fit to the cleaned EU position time series can be found at:
THIS LINK

GPS time series plot

Parameters for the red line fit to the detrended position time series can be found at:
THIS LINK

GPS time series plot

Parameters for the red line fit to the detrended and cleaned position time series can be found at:
THIS LINK

Rapid GPS time series plot
QA plot


University of Nevada, Reno logo small UNR logo