
|
|||||||||||||||||||||||||||||||||||||||||||||||||||||||||||||||||||||||||||||
|
|
||||||||||||||||||||||||||||||||||||||||||||||||||||||||||||||||||||||||||||
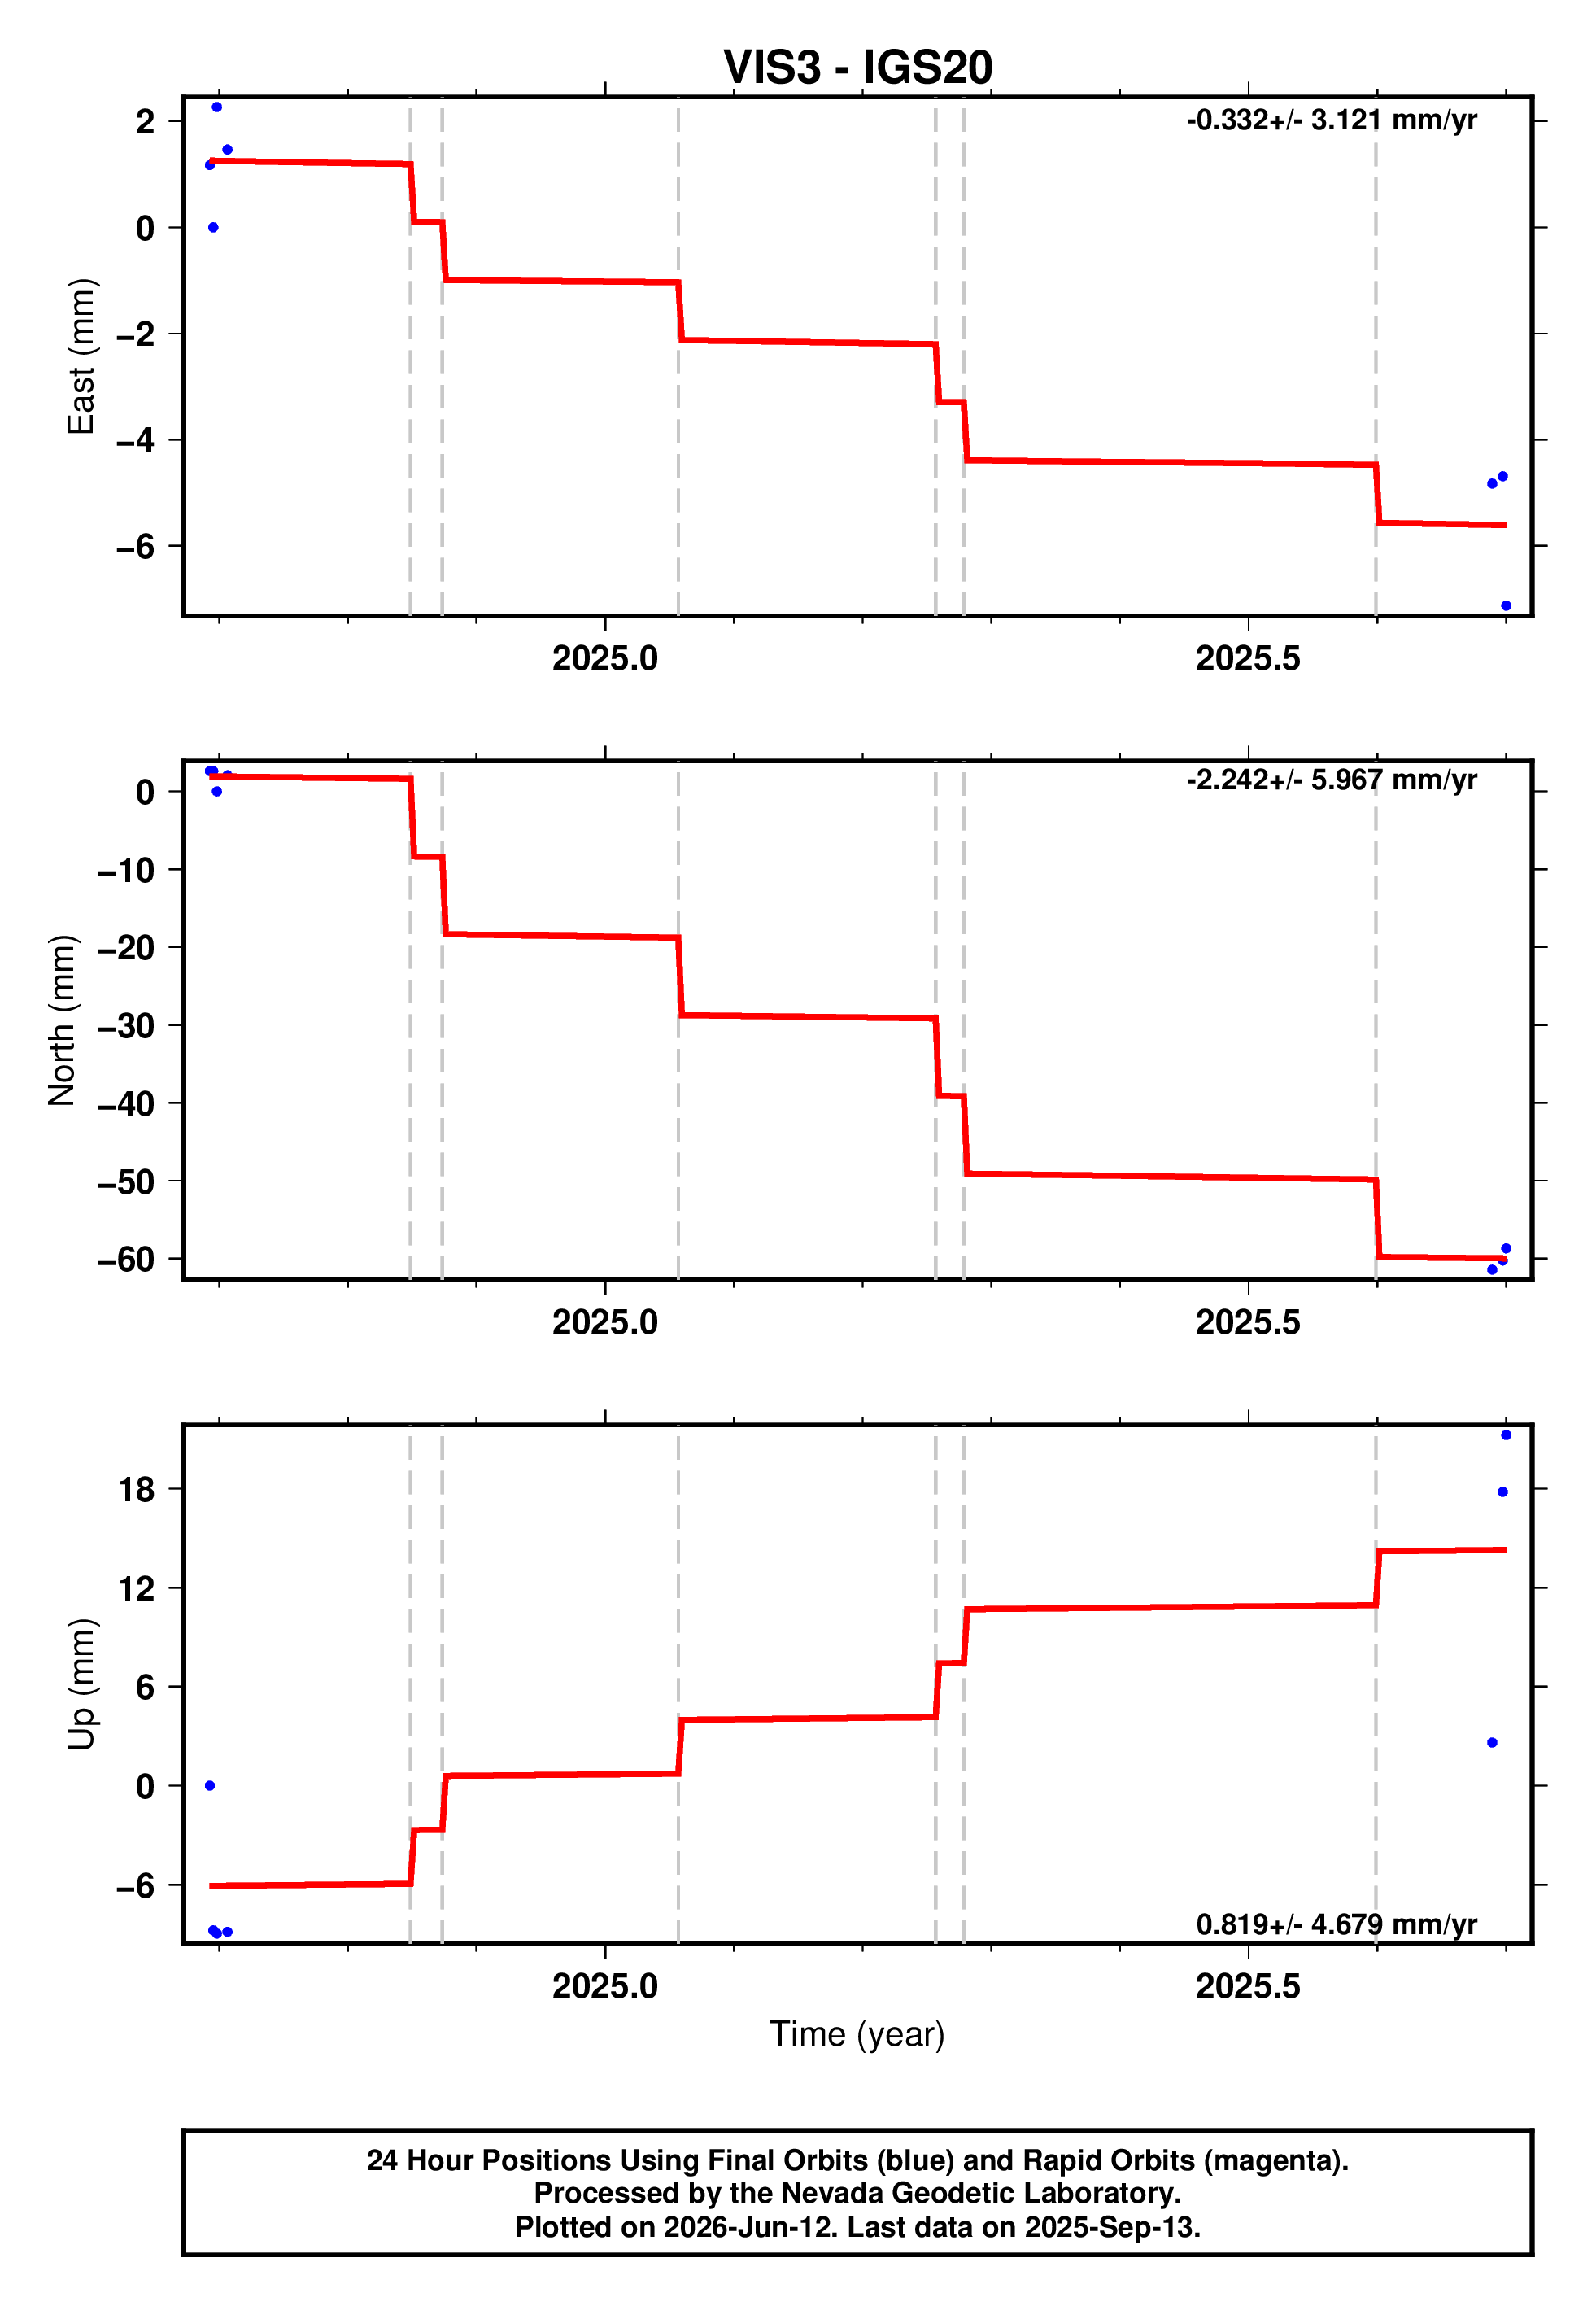
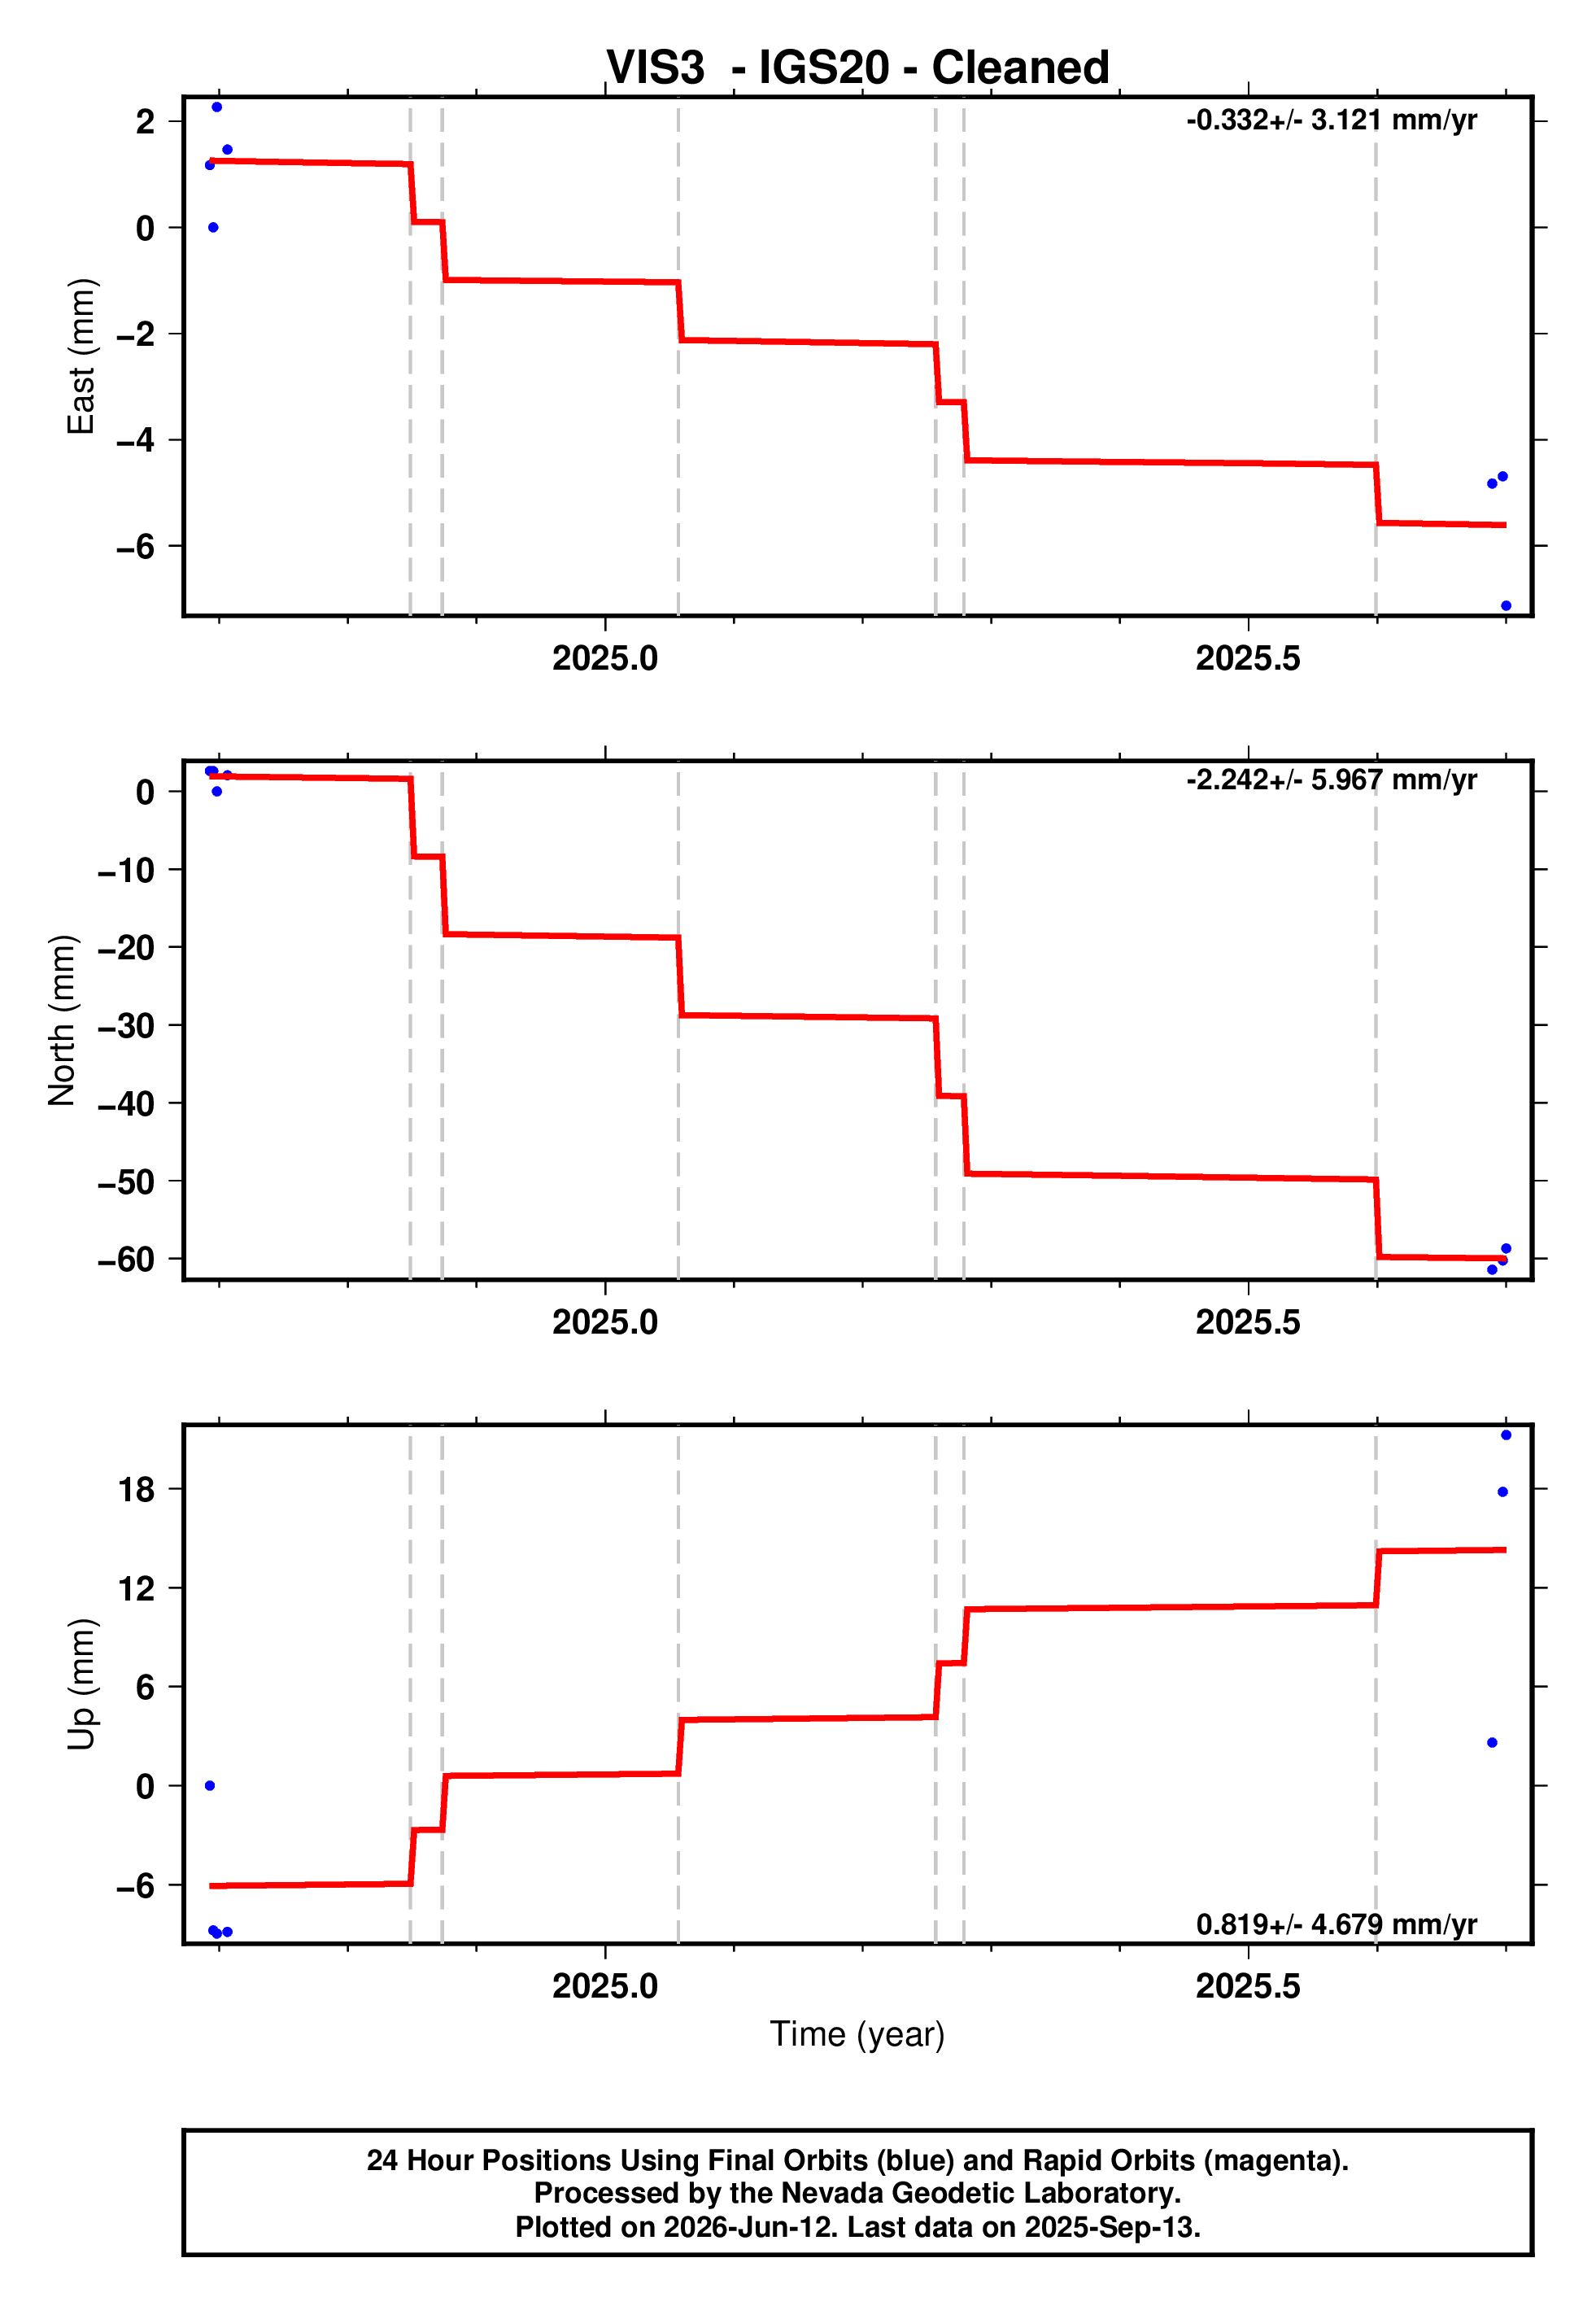
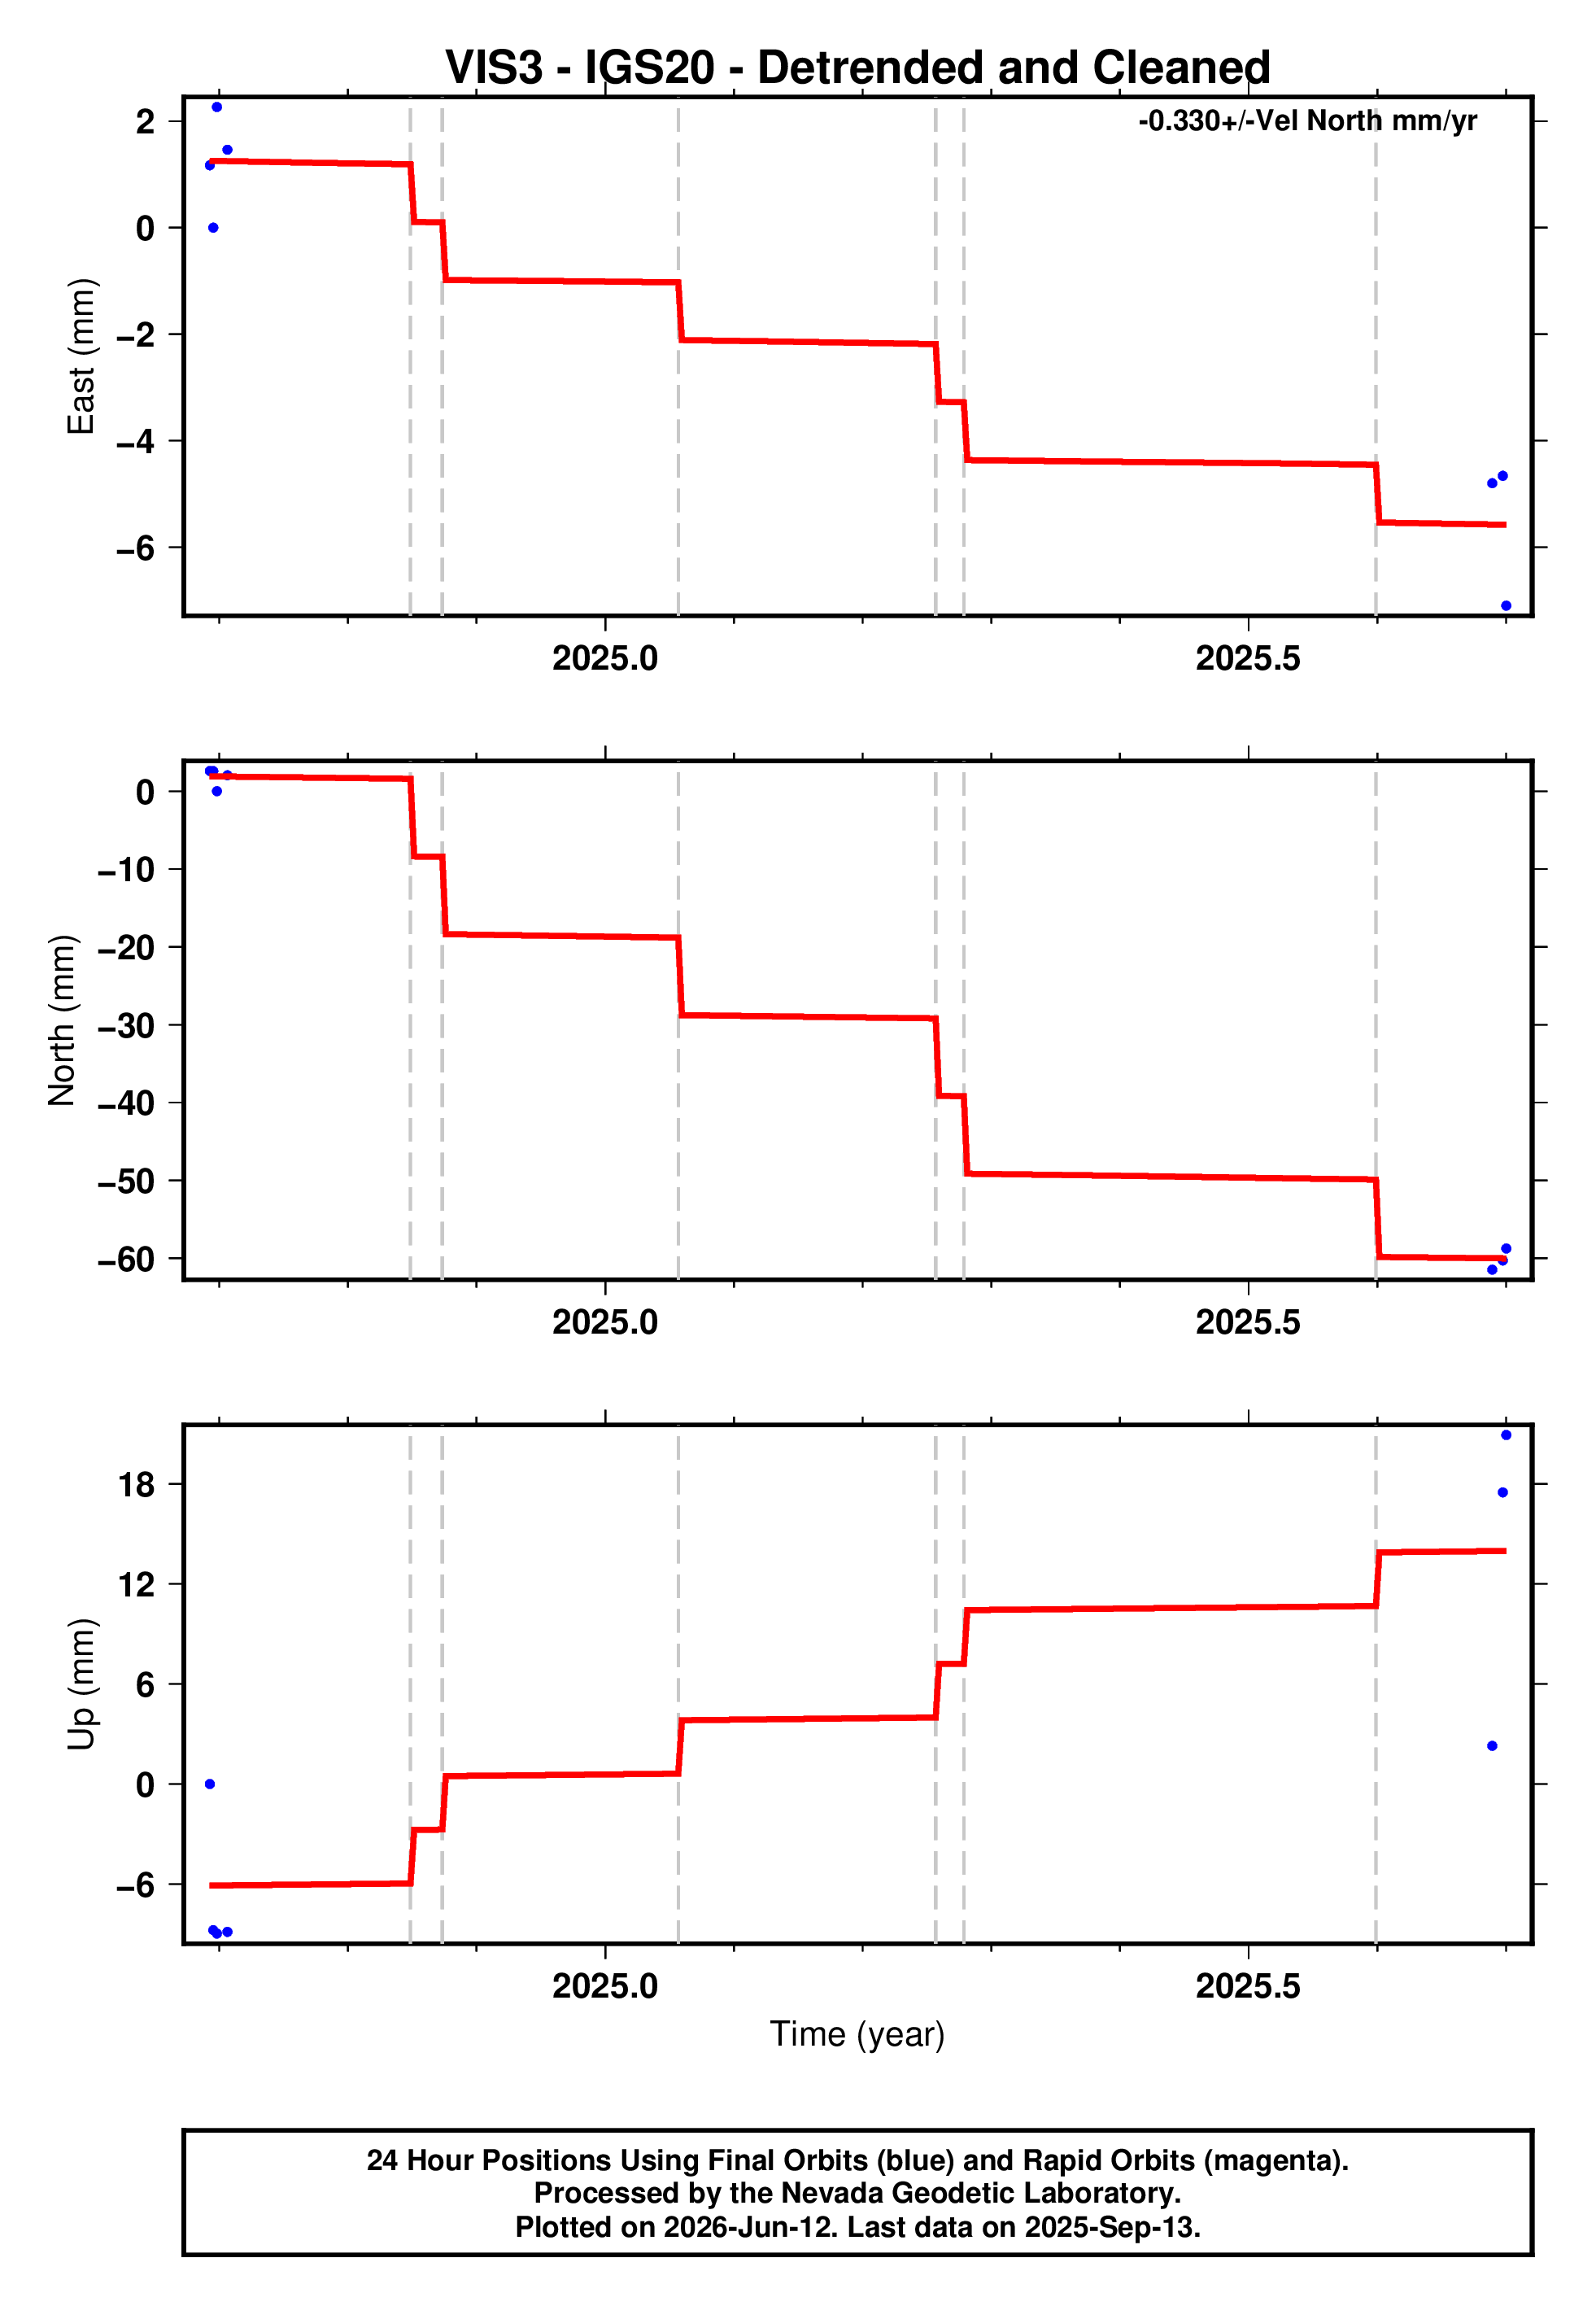
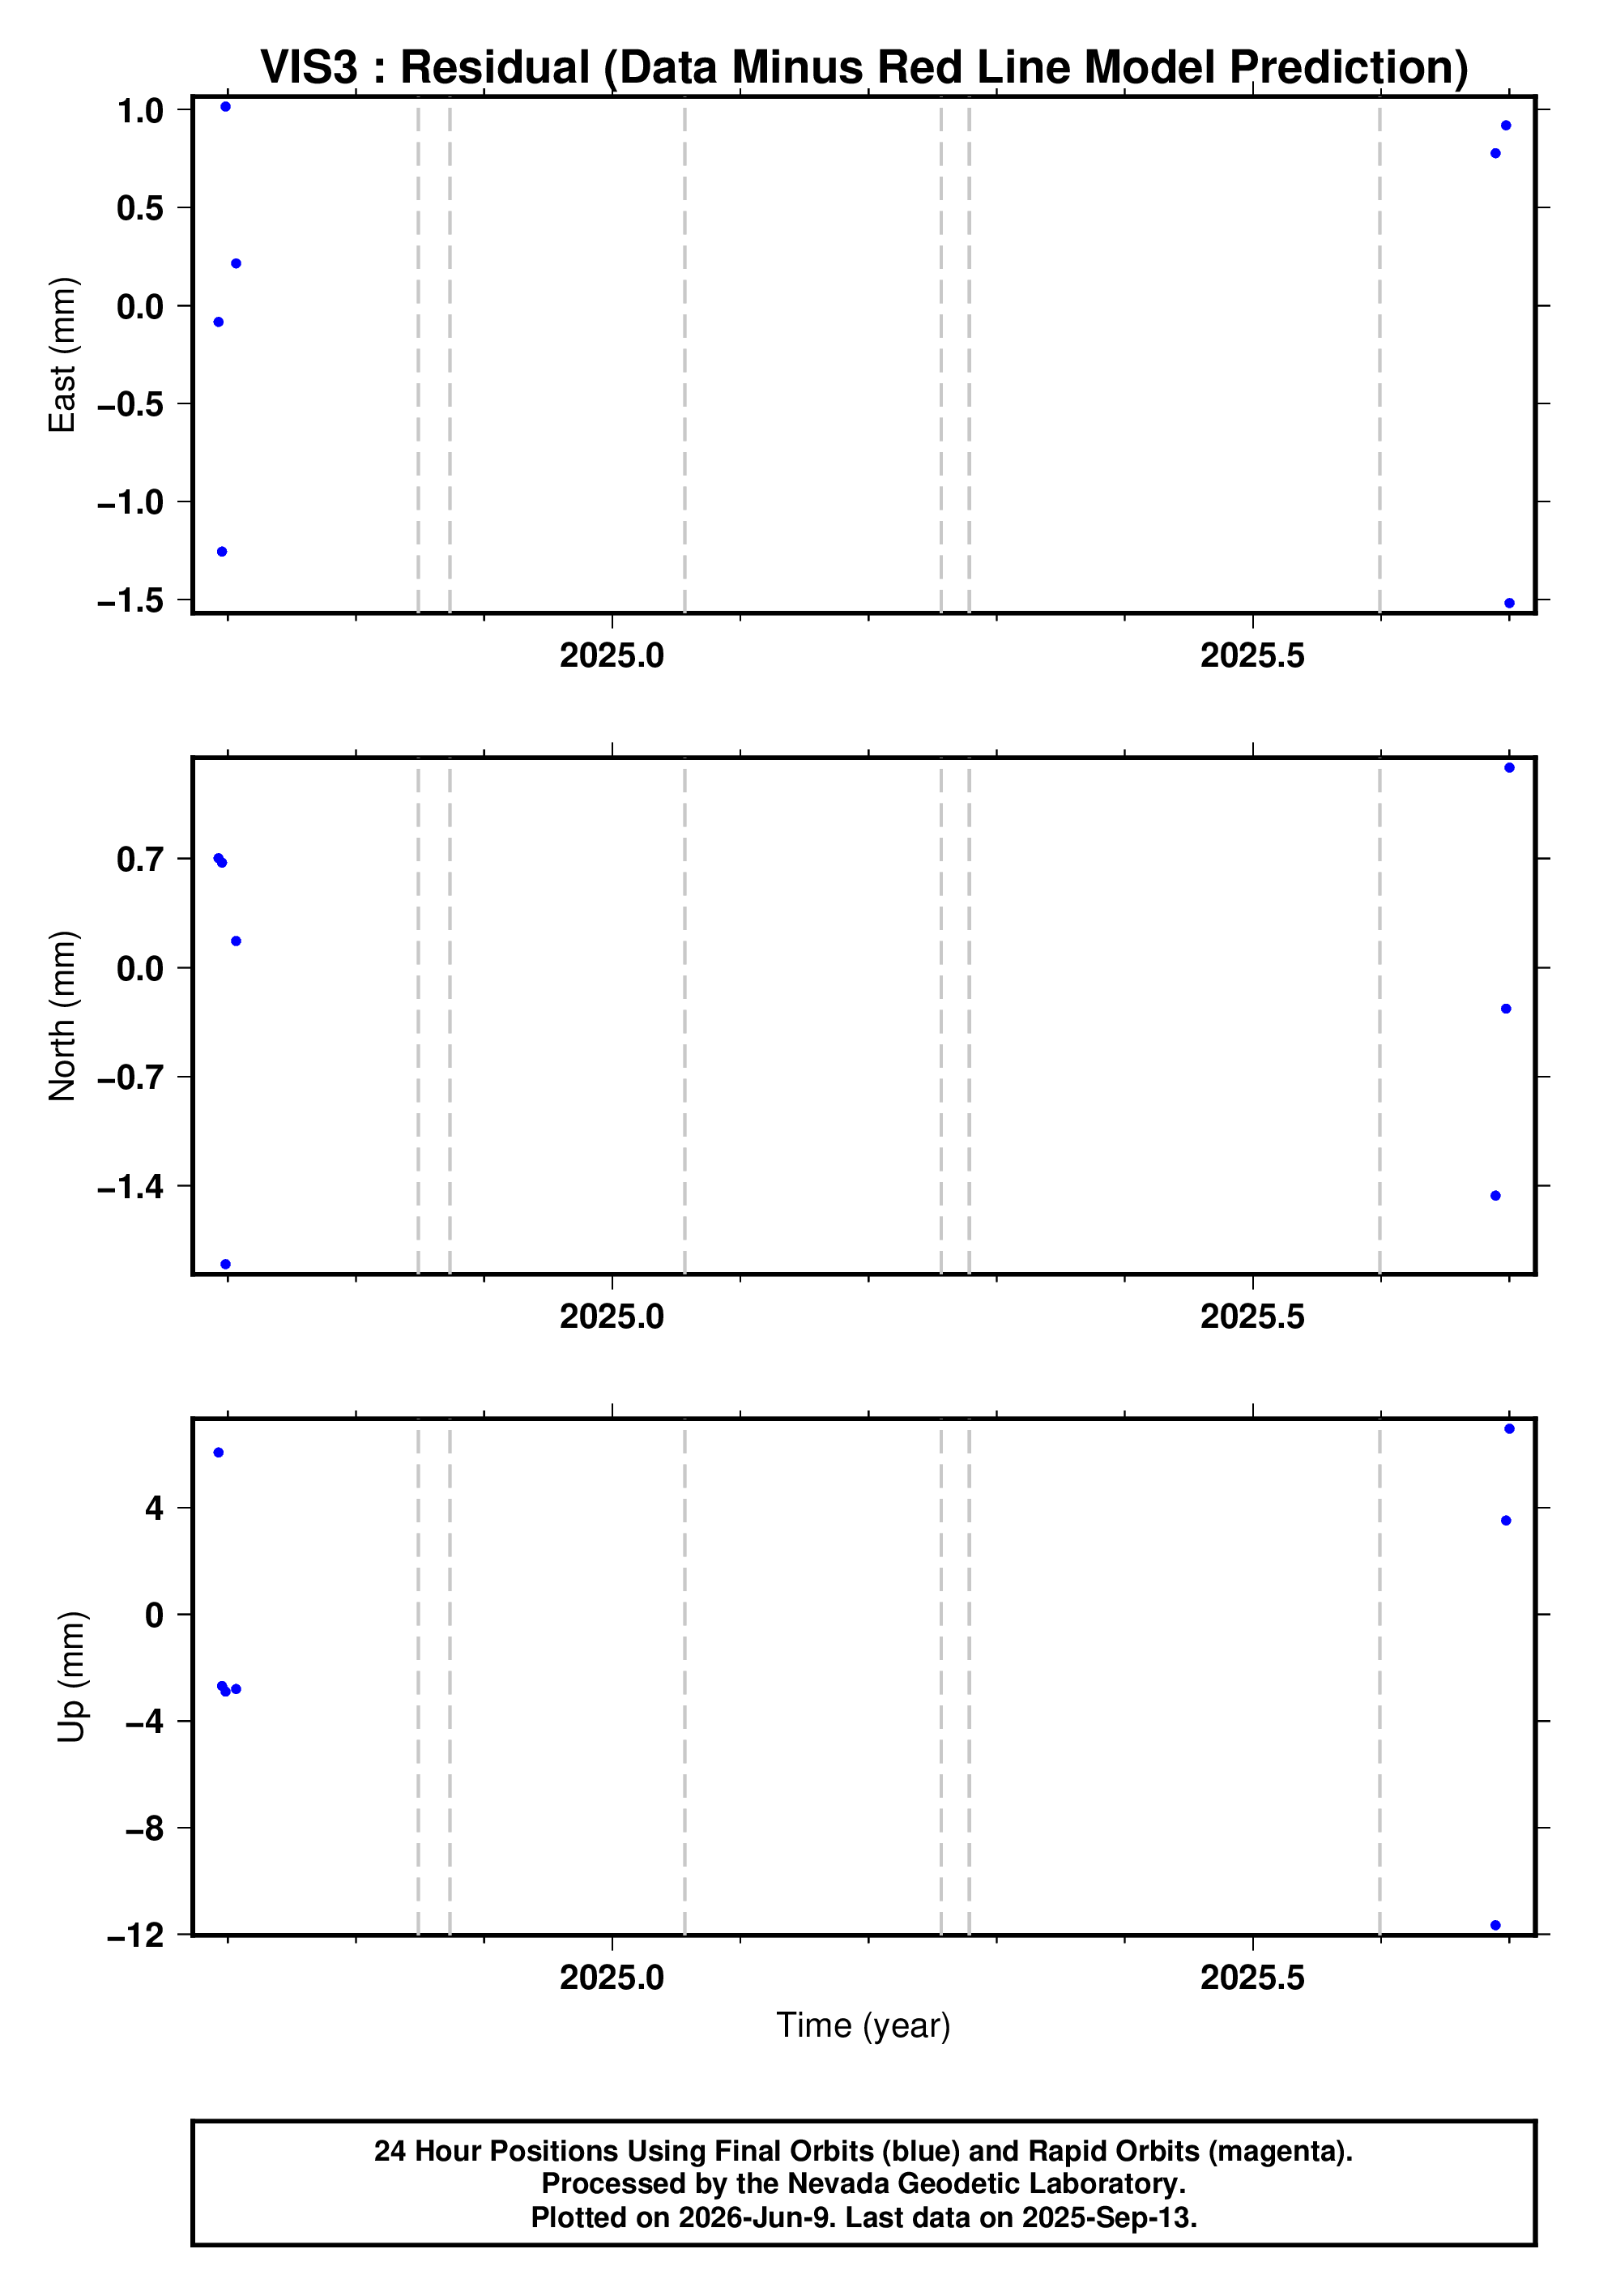
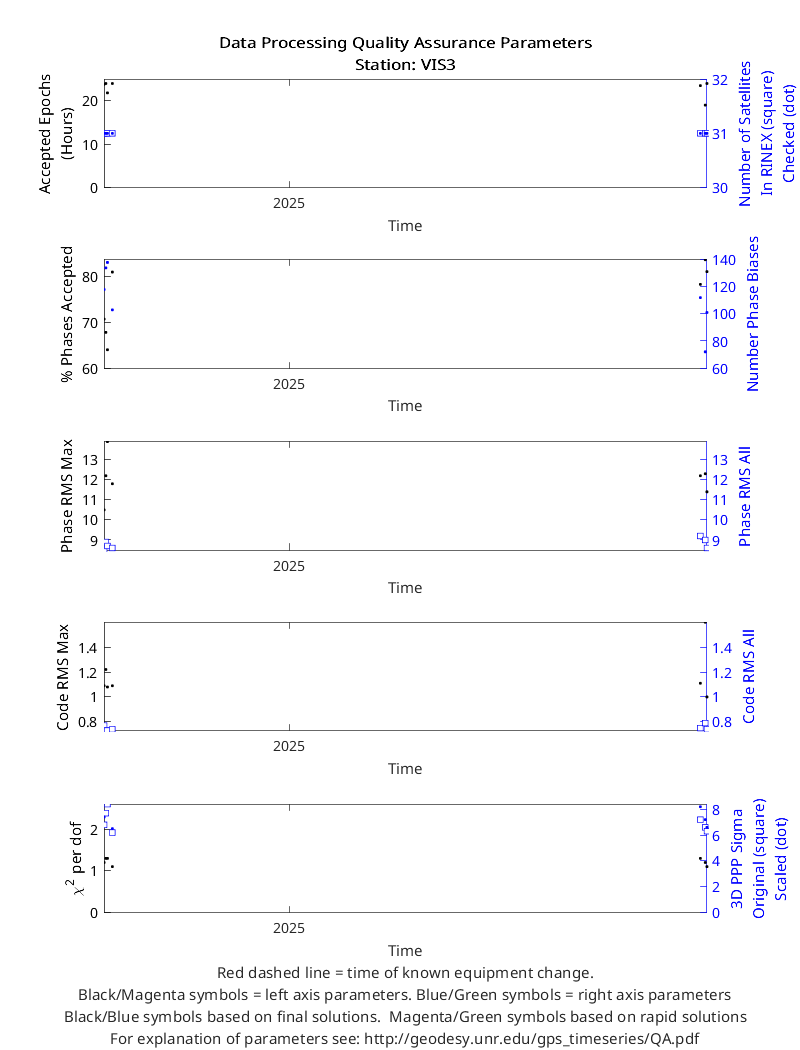
Click on the buttons on the left below to choose from available reference frames, latencies, and sample rates. Original, Cleaned (outlier removed) and detrended (using MIDAS rate) plots are available. See plot explanation page for further explanations on plot contents.
|
|
Parameters for the red line fit to the original position time series can be found at: |
|
|
Parameters for the red line fit to the cleaned position time series can be found at: |
|
|
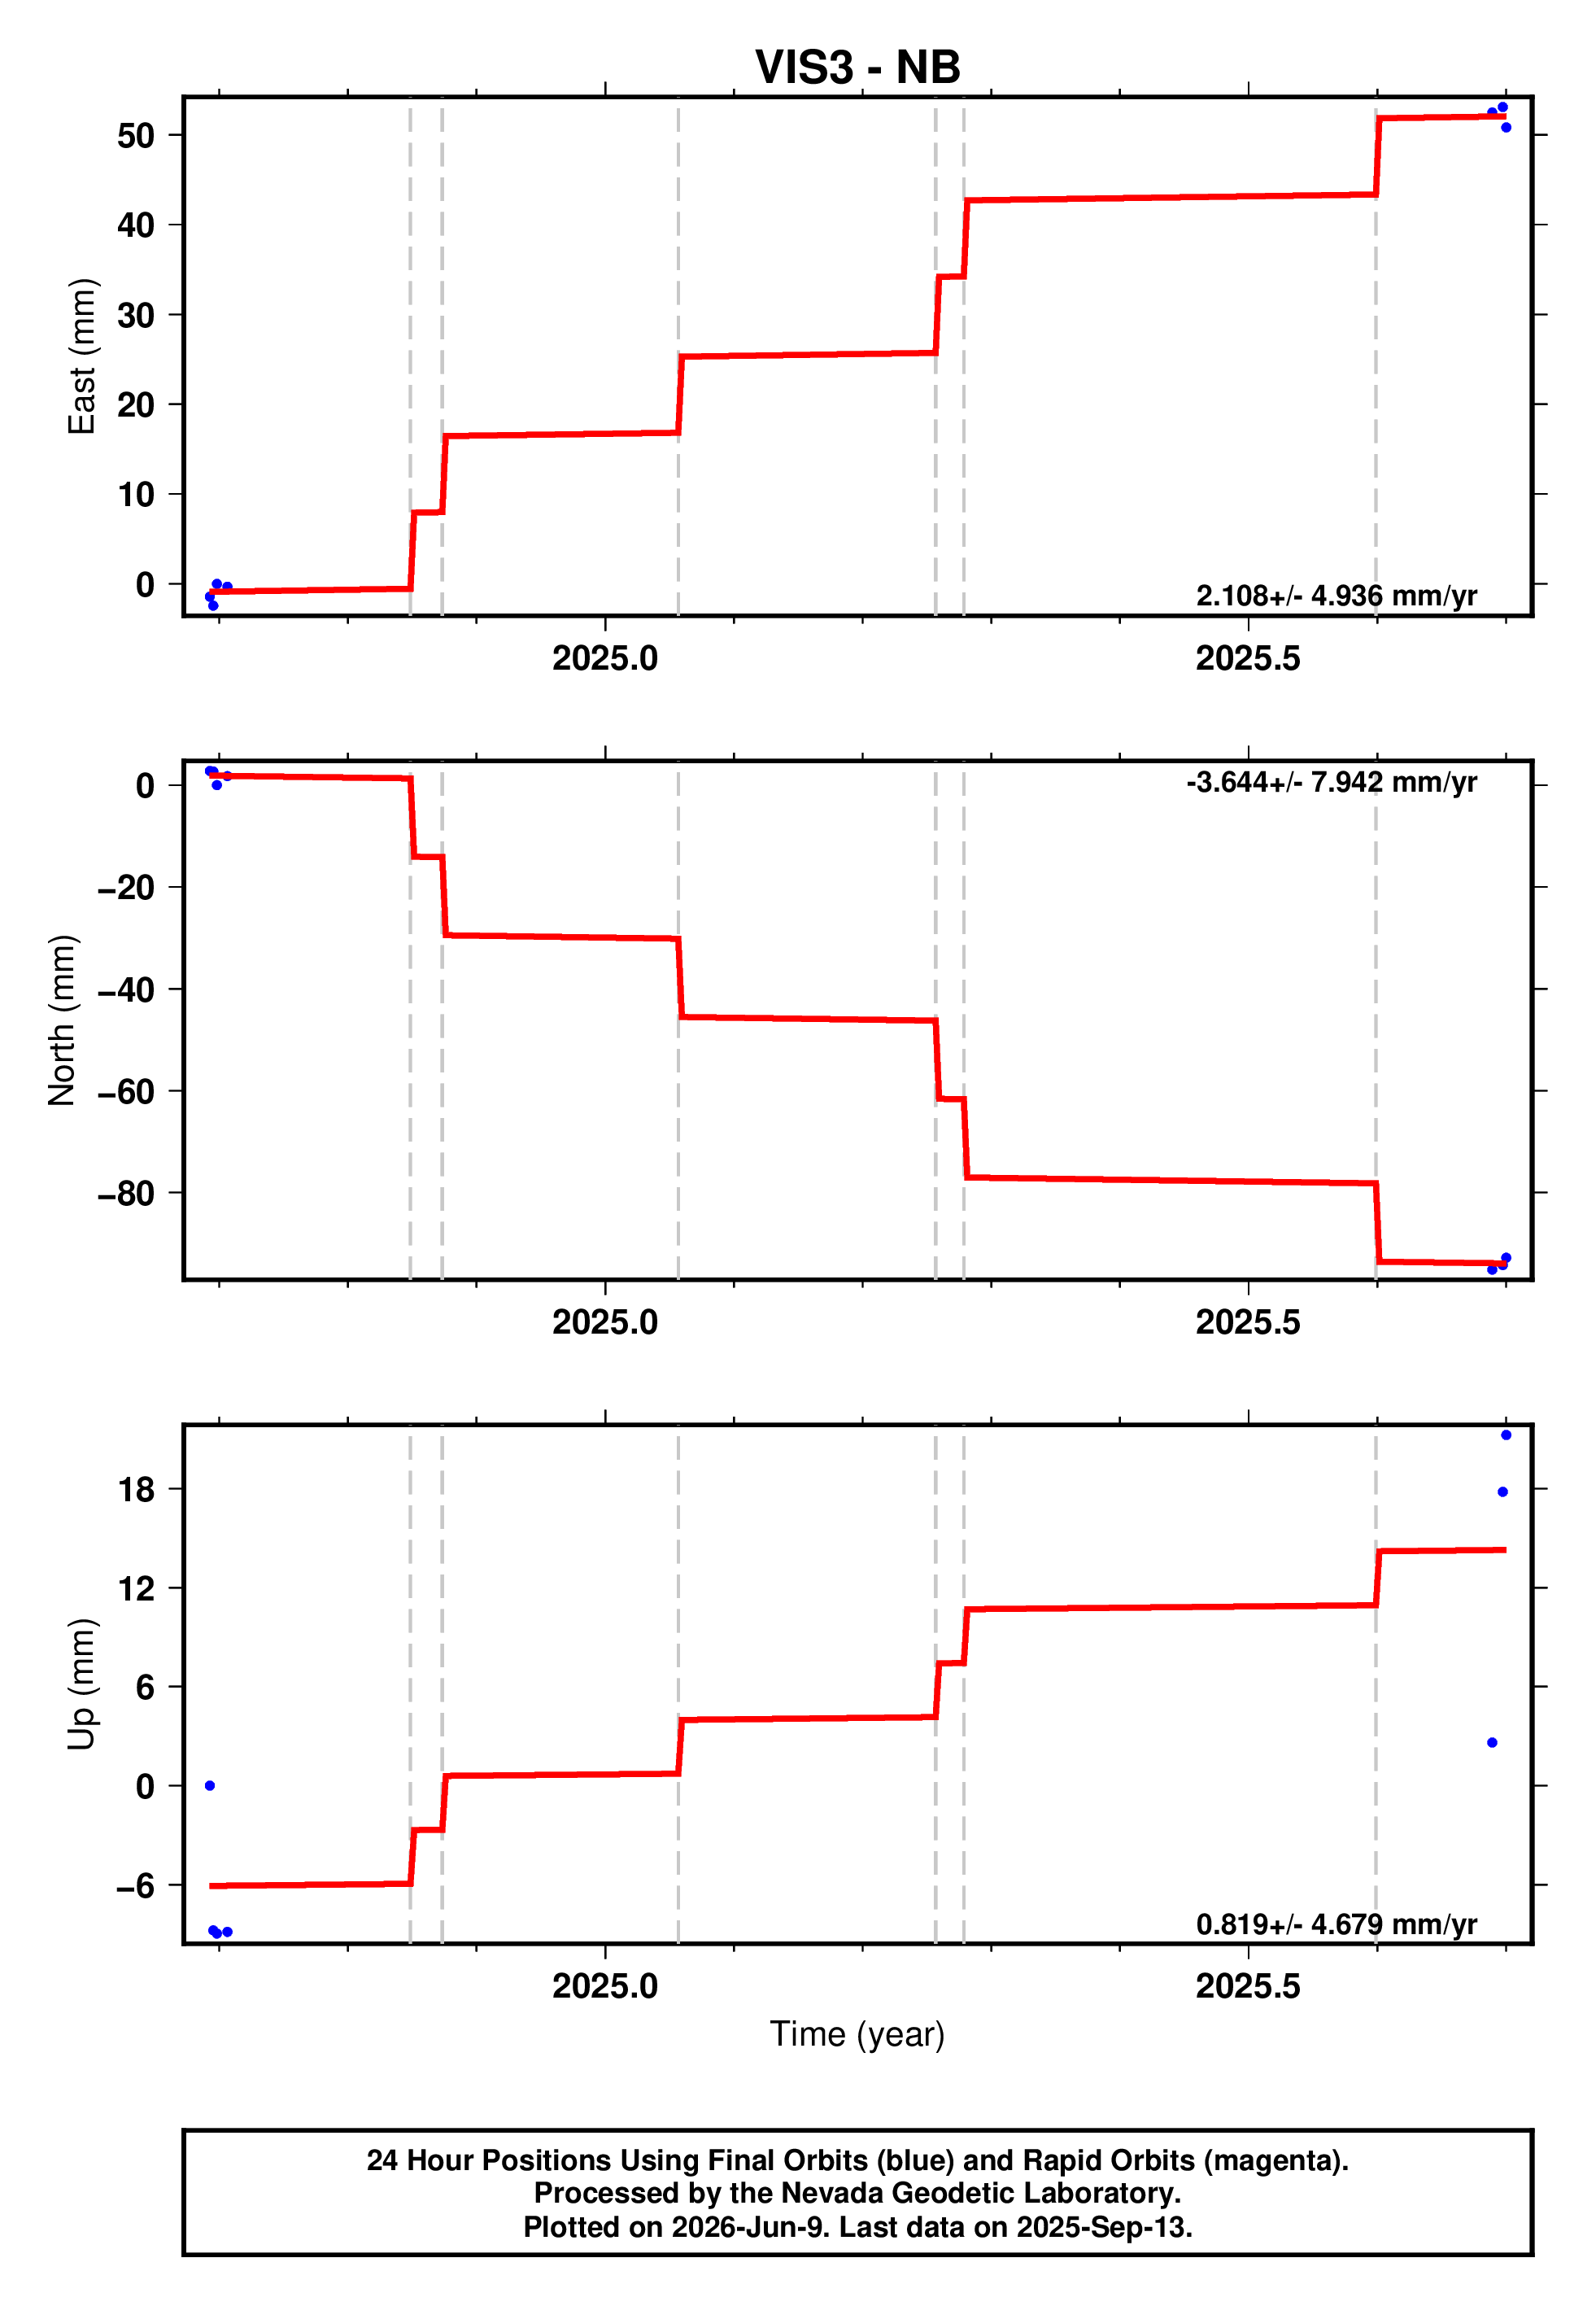
Parameters for the red line fit to the NB position time series can be found at: |
|
|
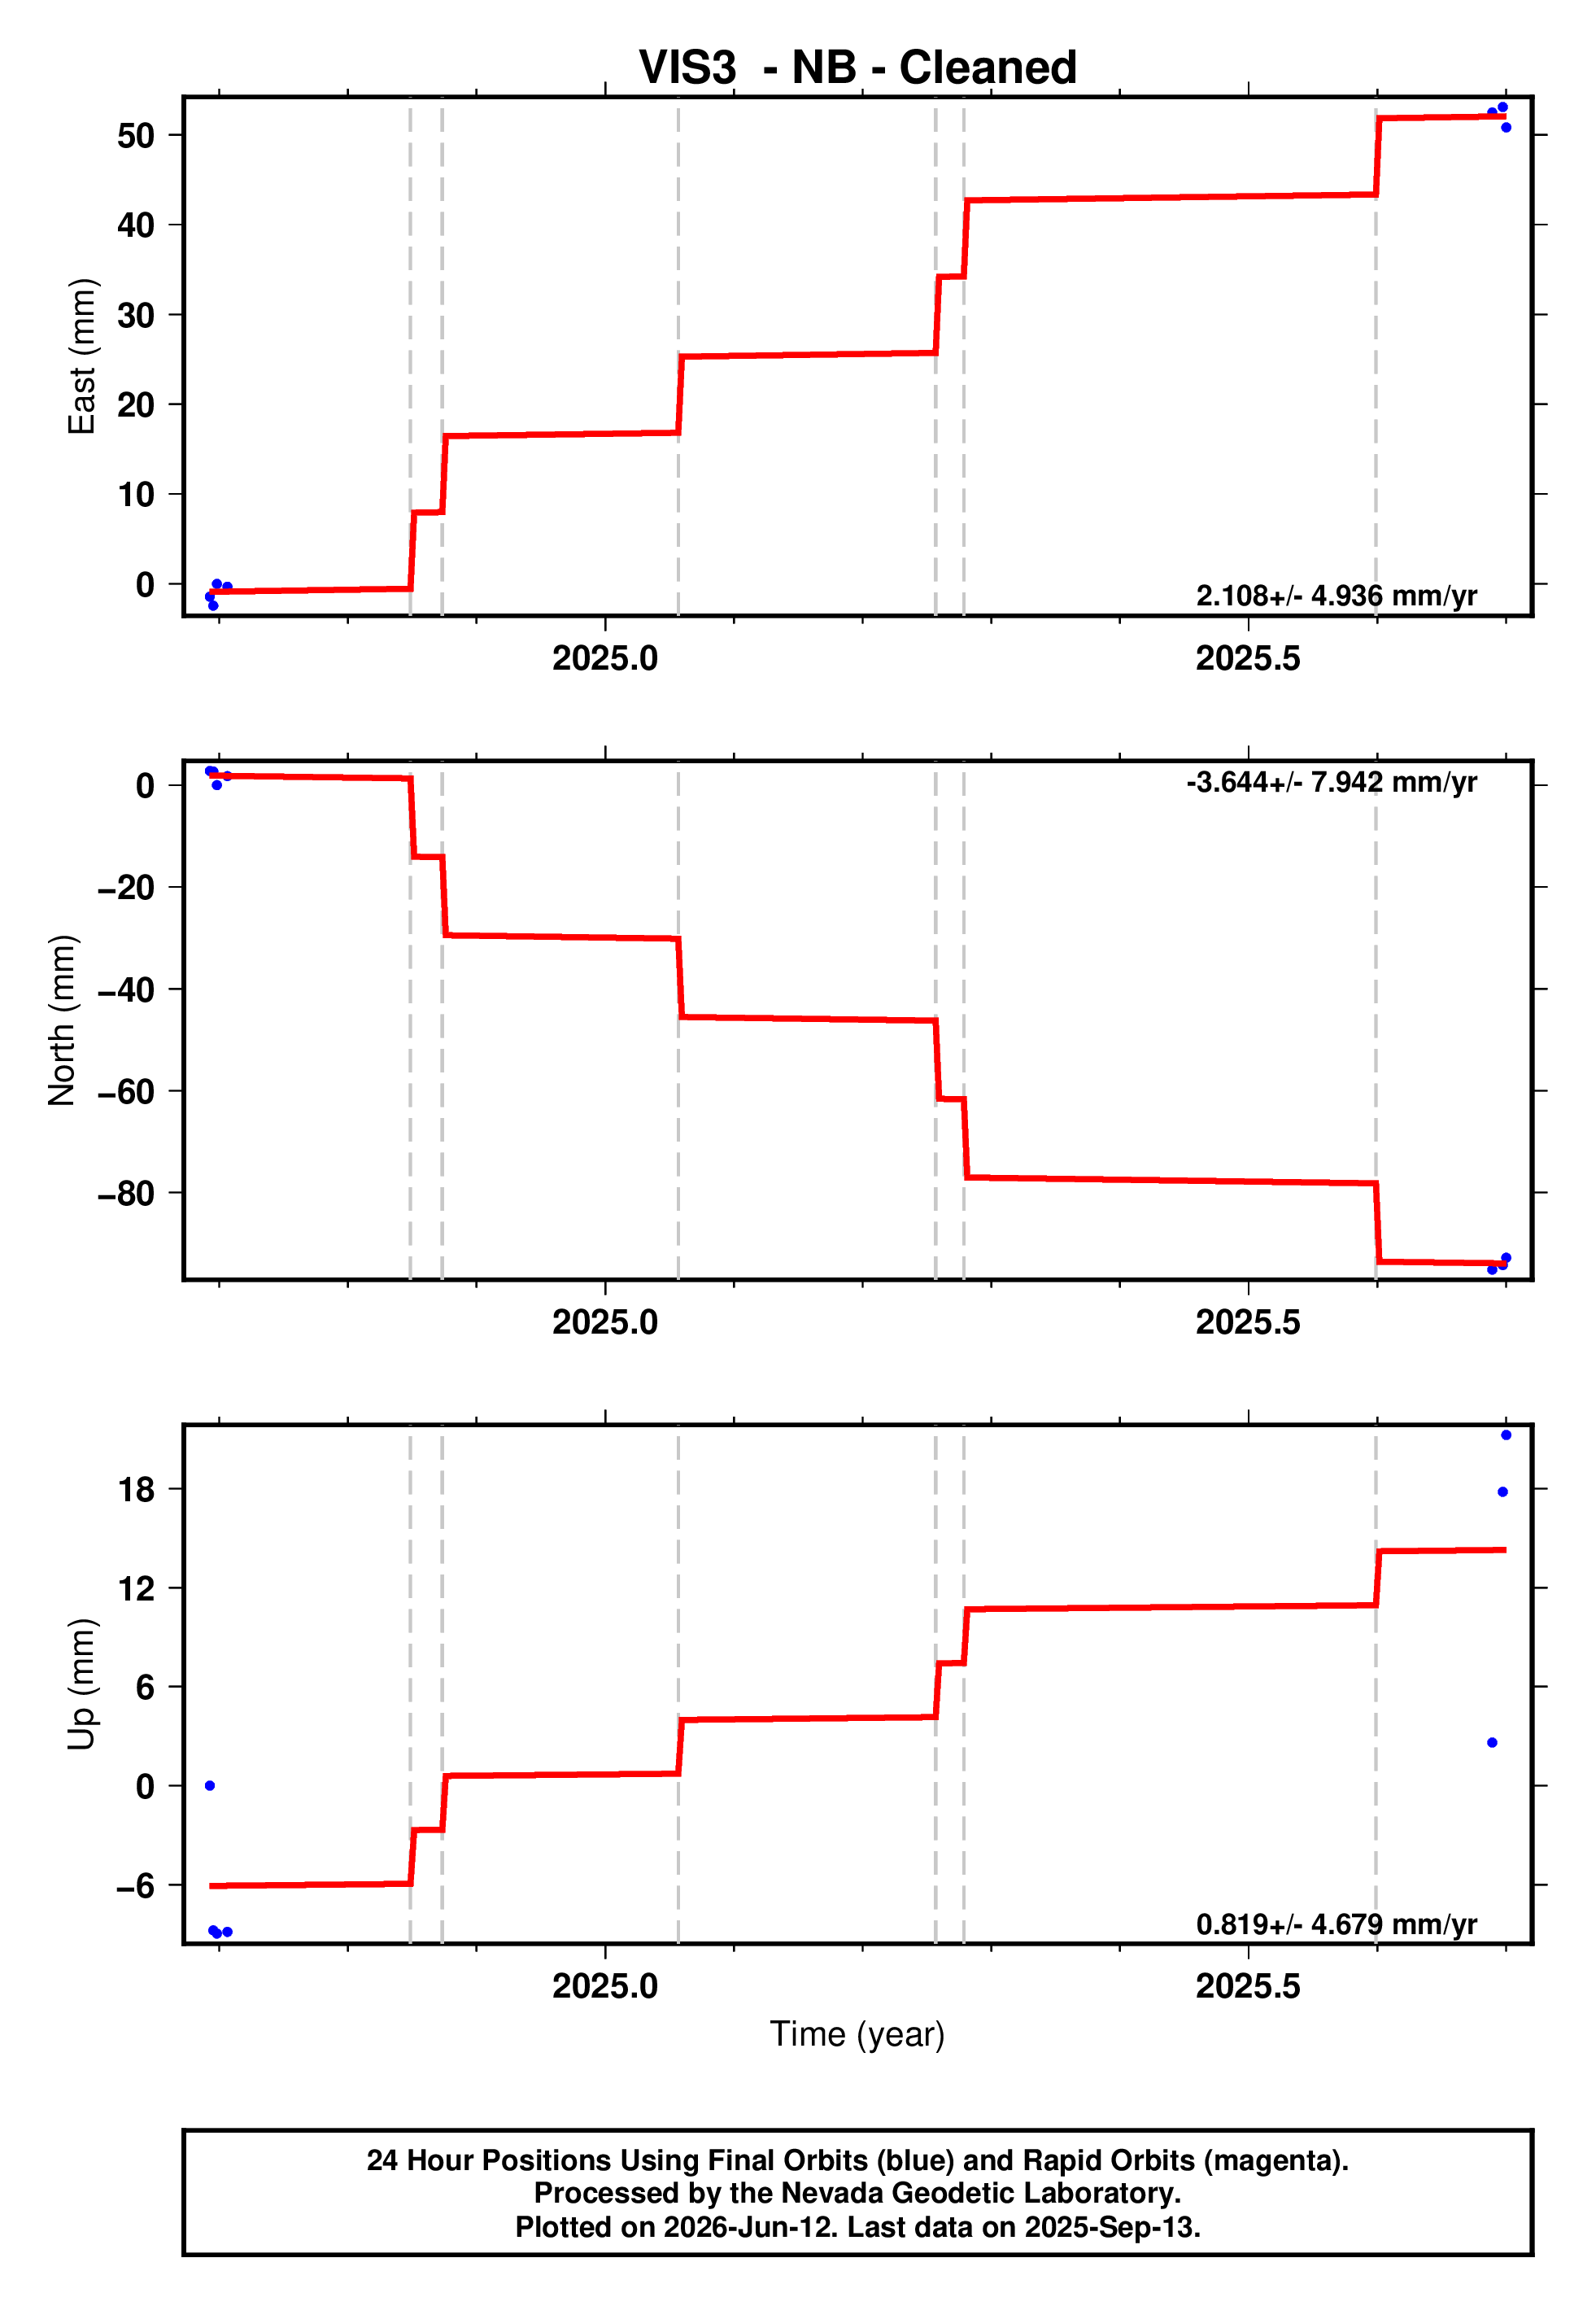
Parameters for the red line fit to the cleaned NB position time series can be found at: |
|
|
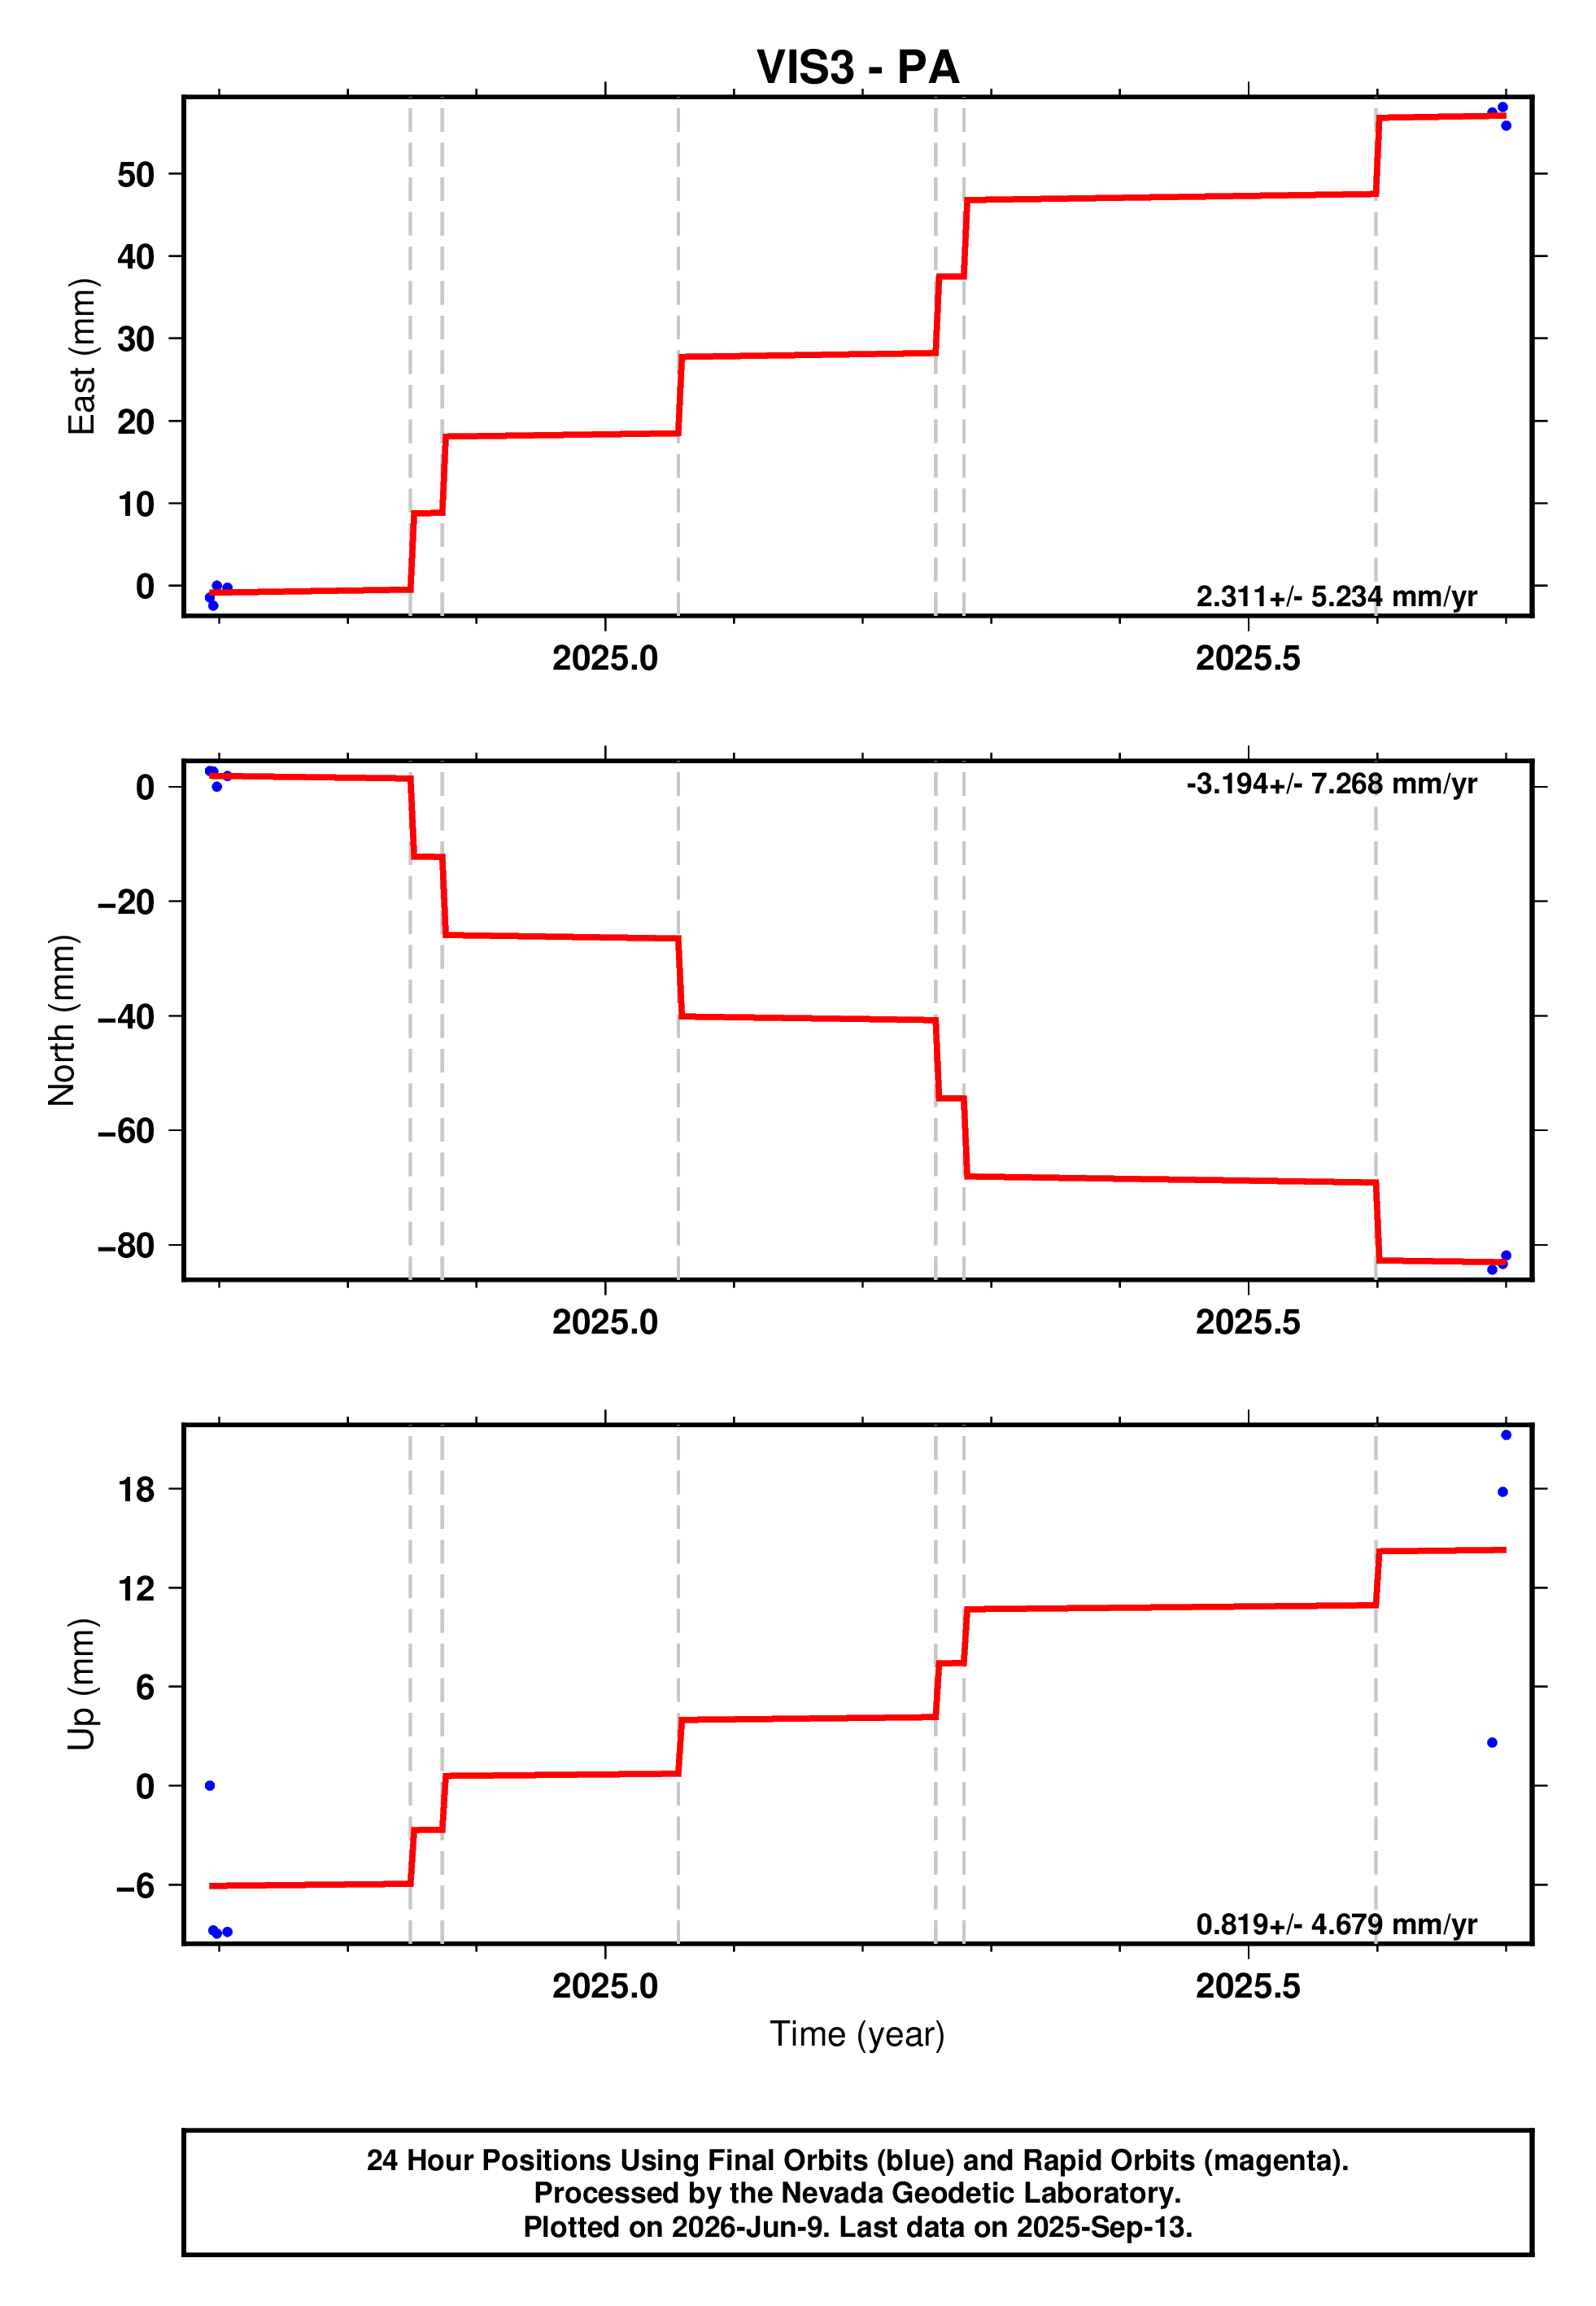
Parameters for the red line fit to the PA position time series can be found at: |
|
|
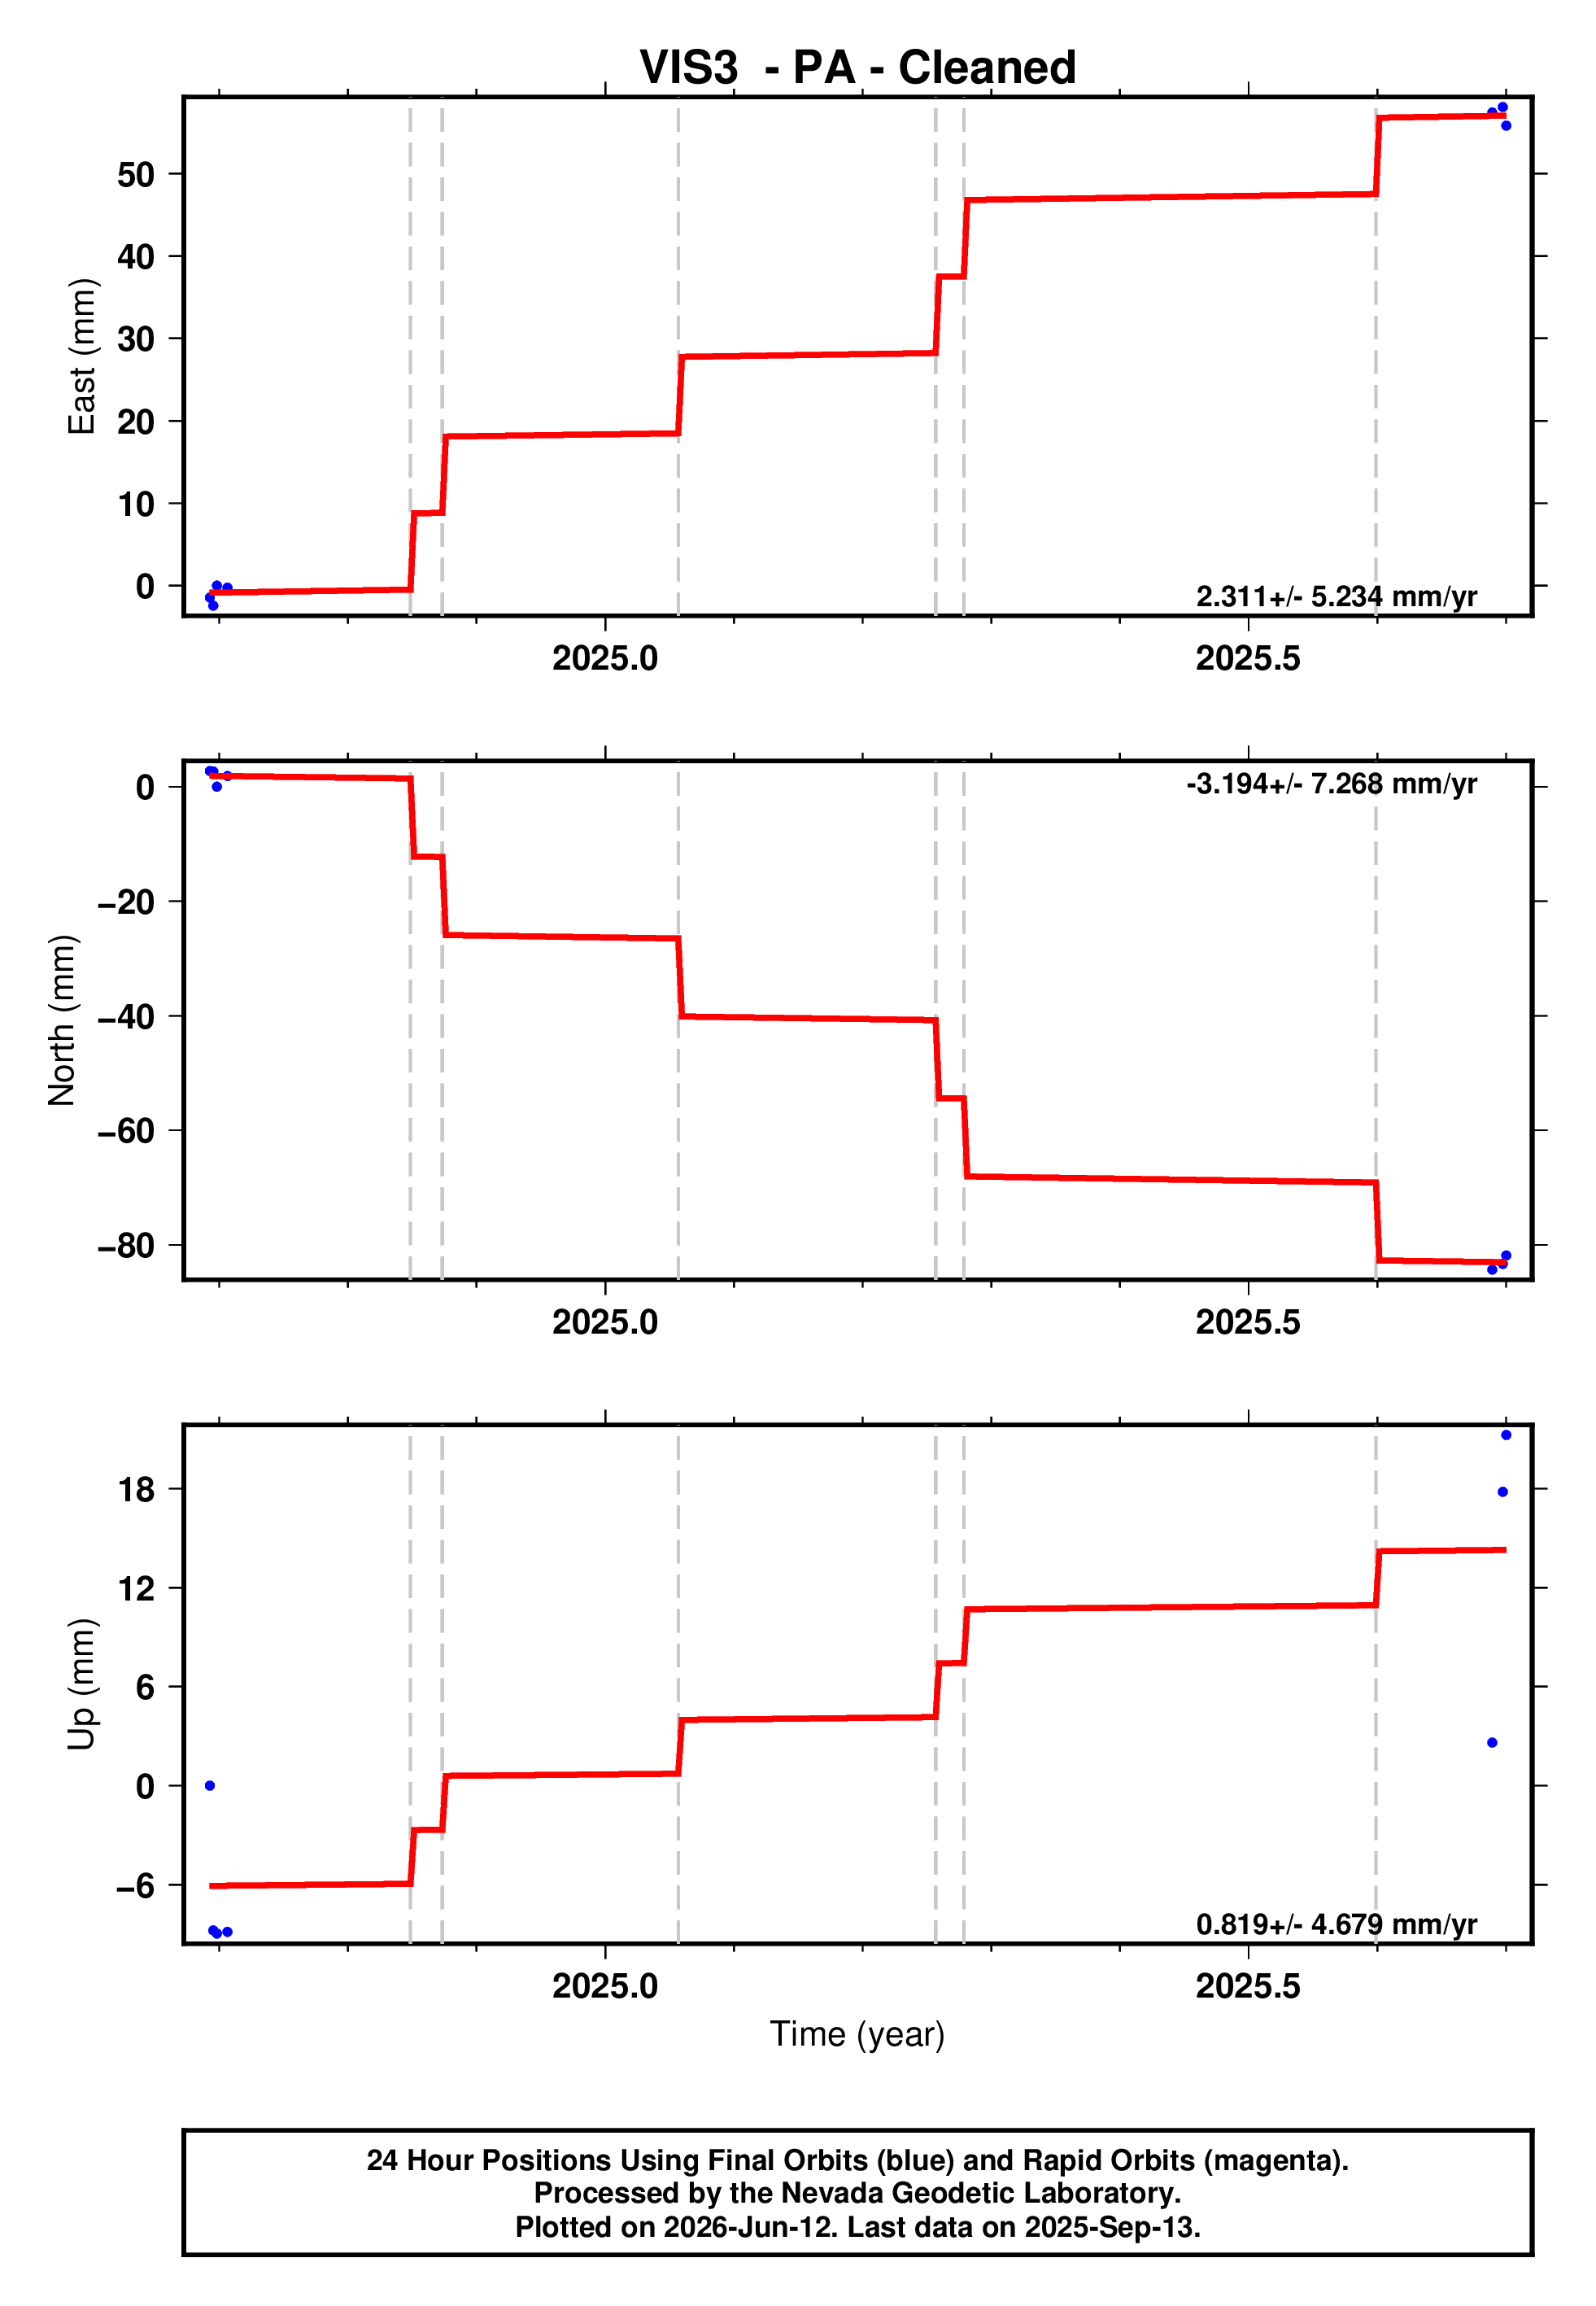
Parameters for the red line fit to the cleaned PA position time series can be found at: |
|
|
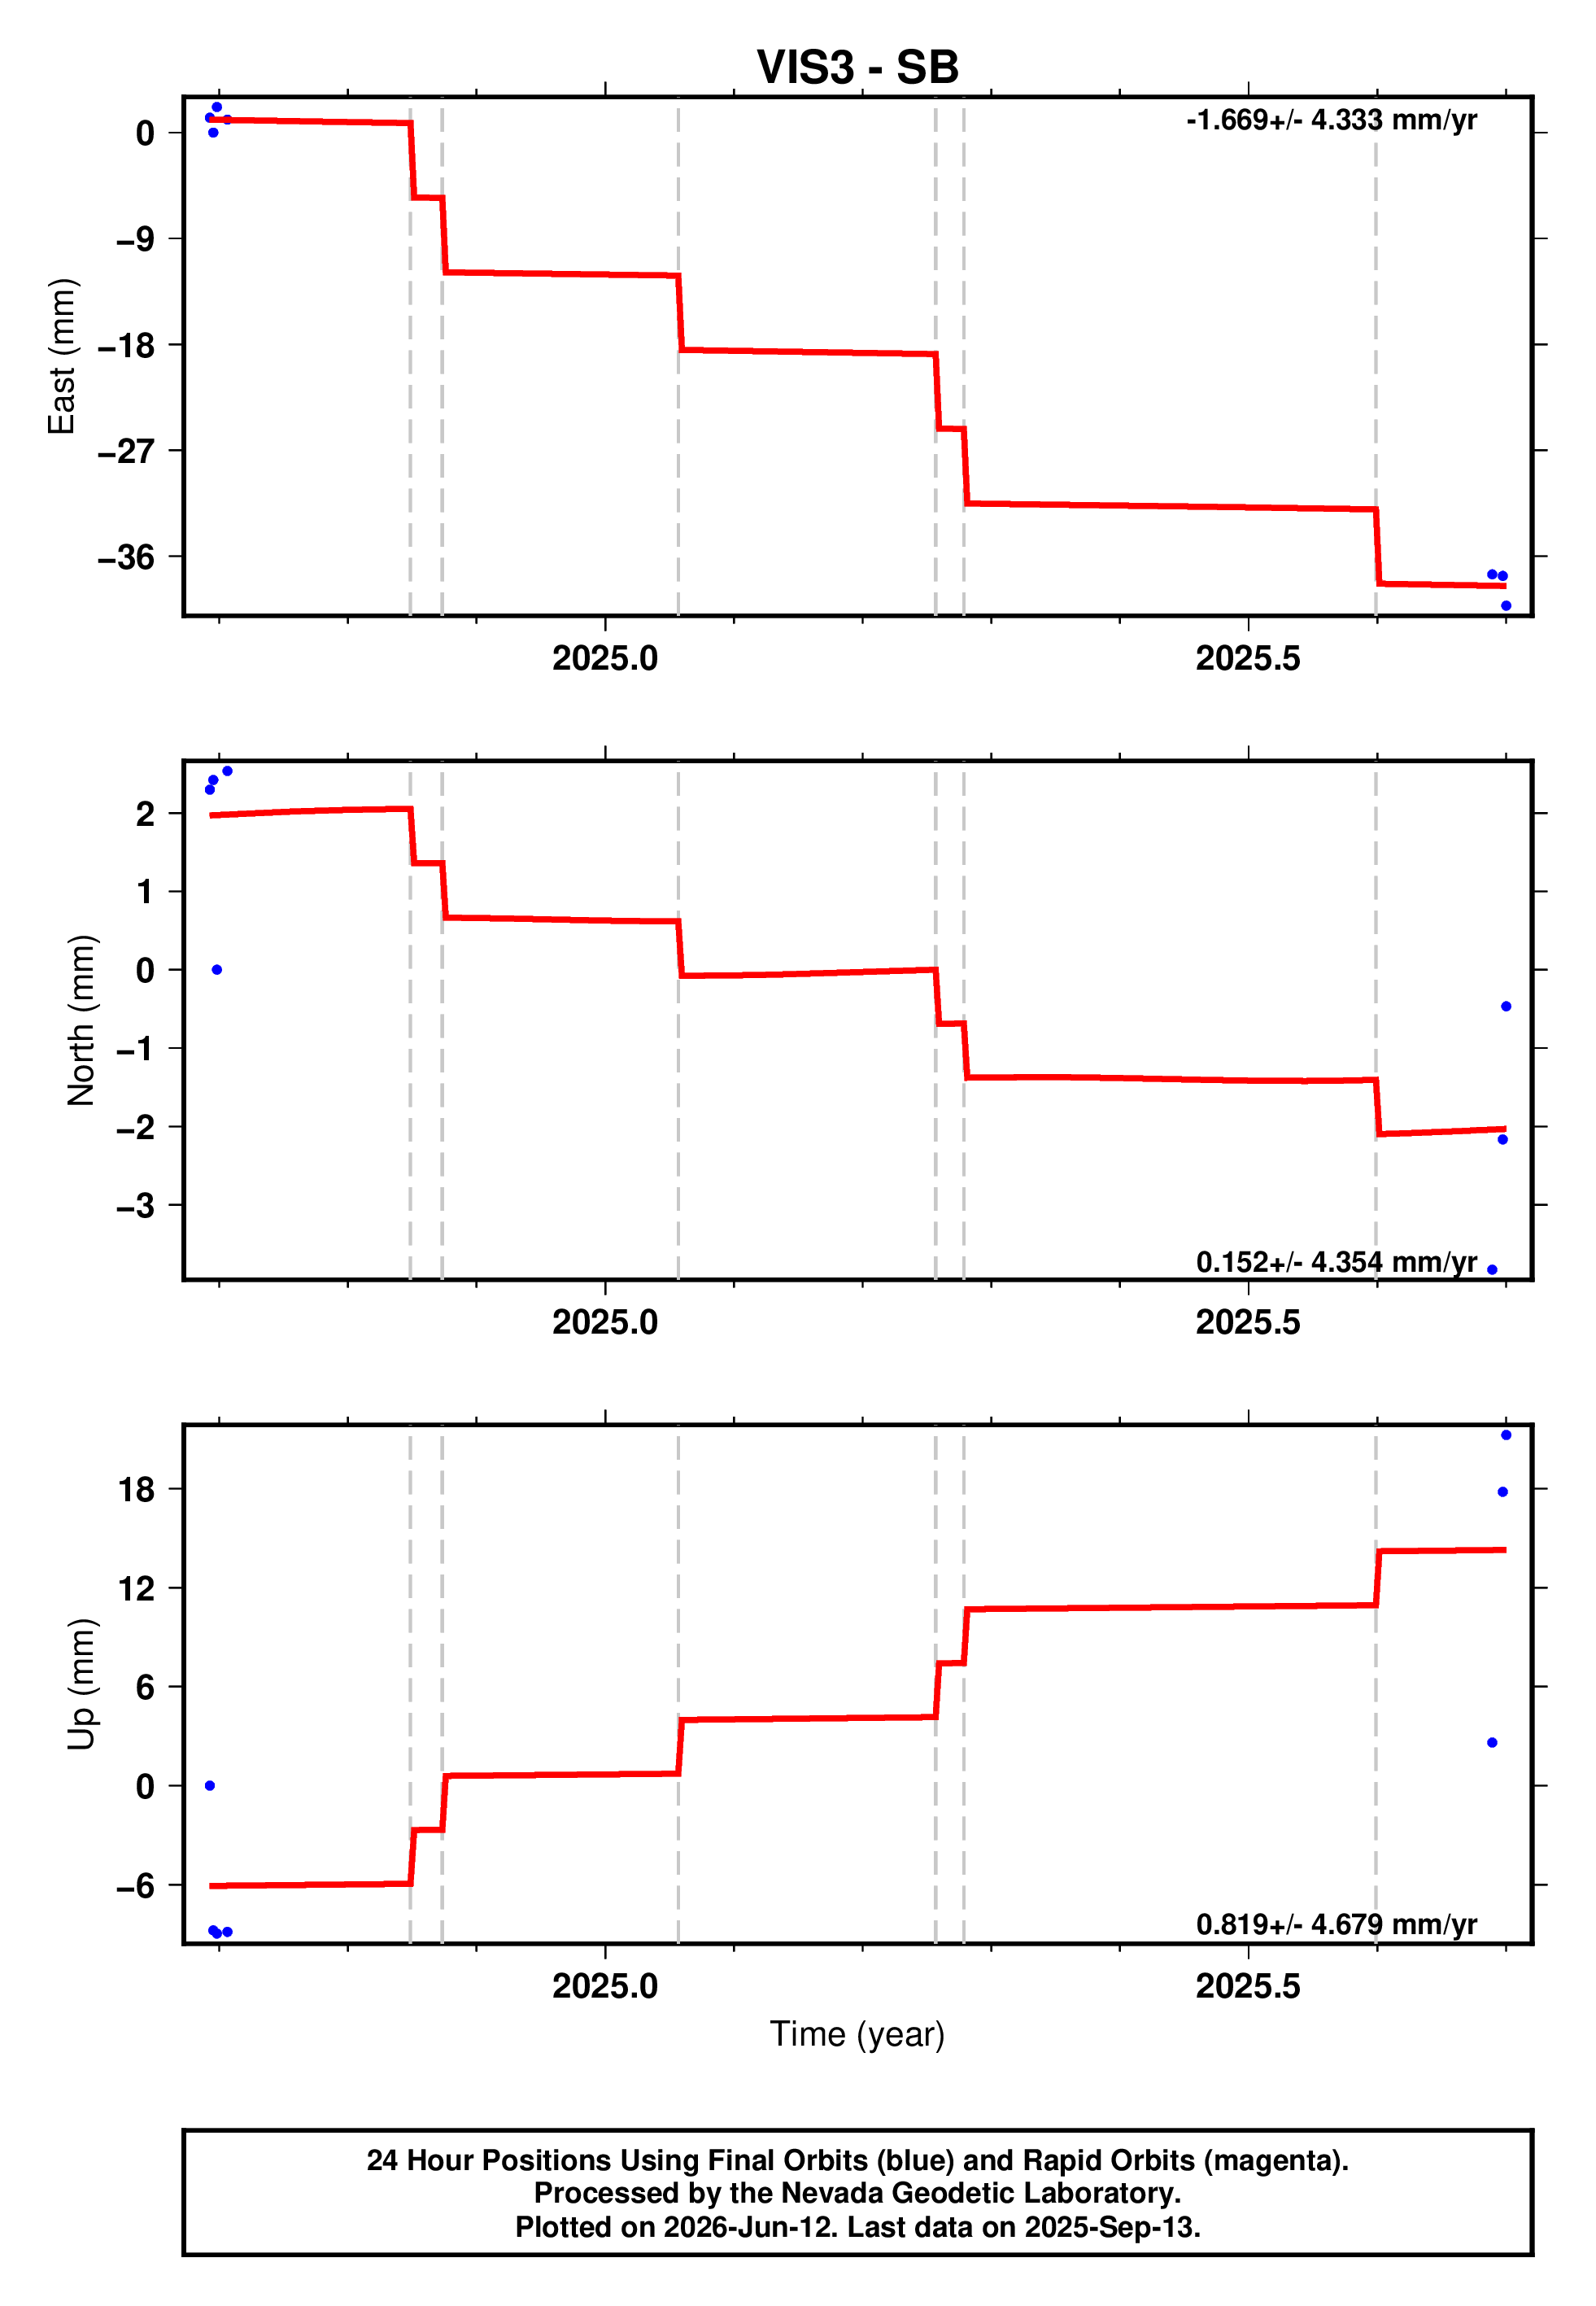
Parameters for the red line fit to the SB position time series can be found at: |
|
|
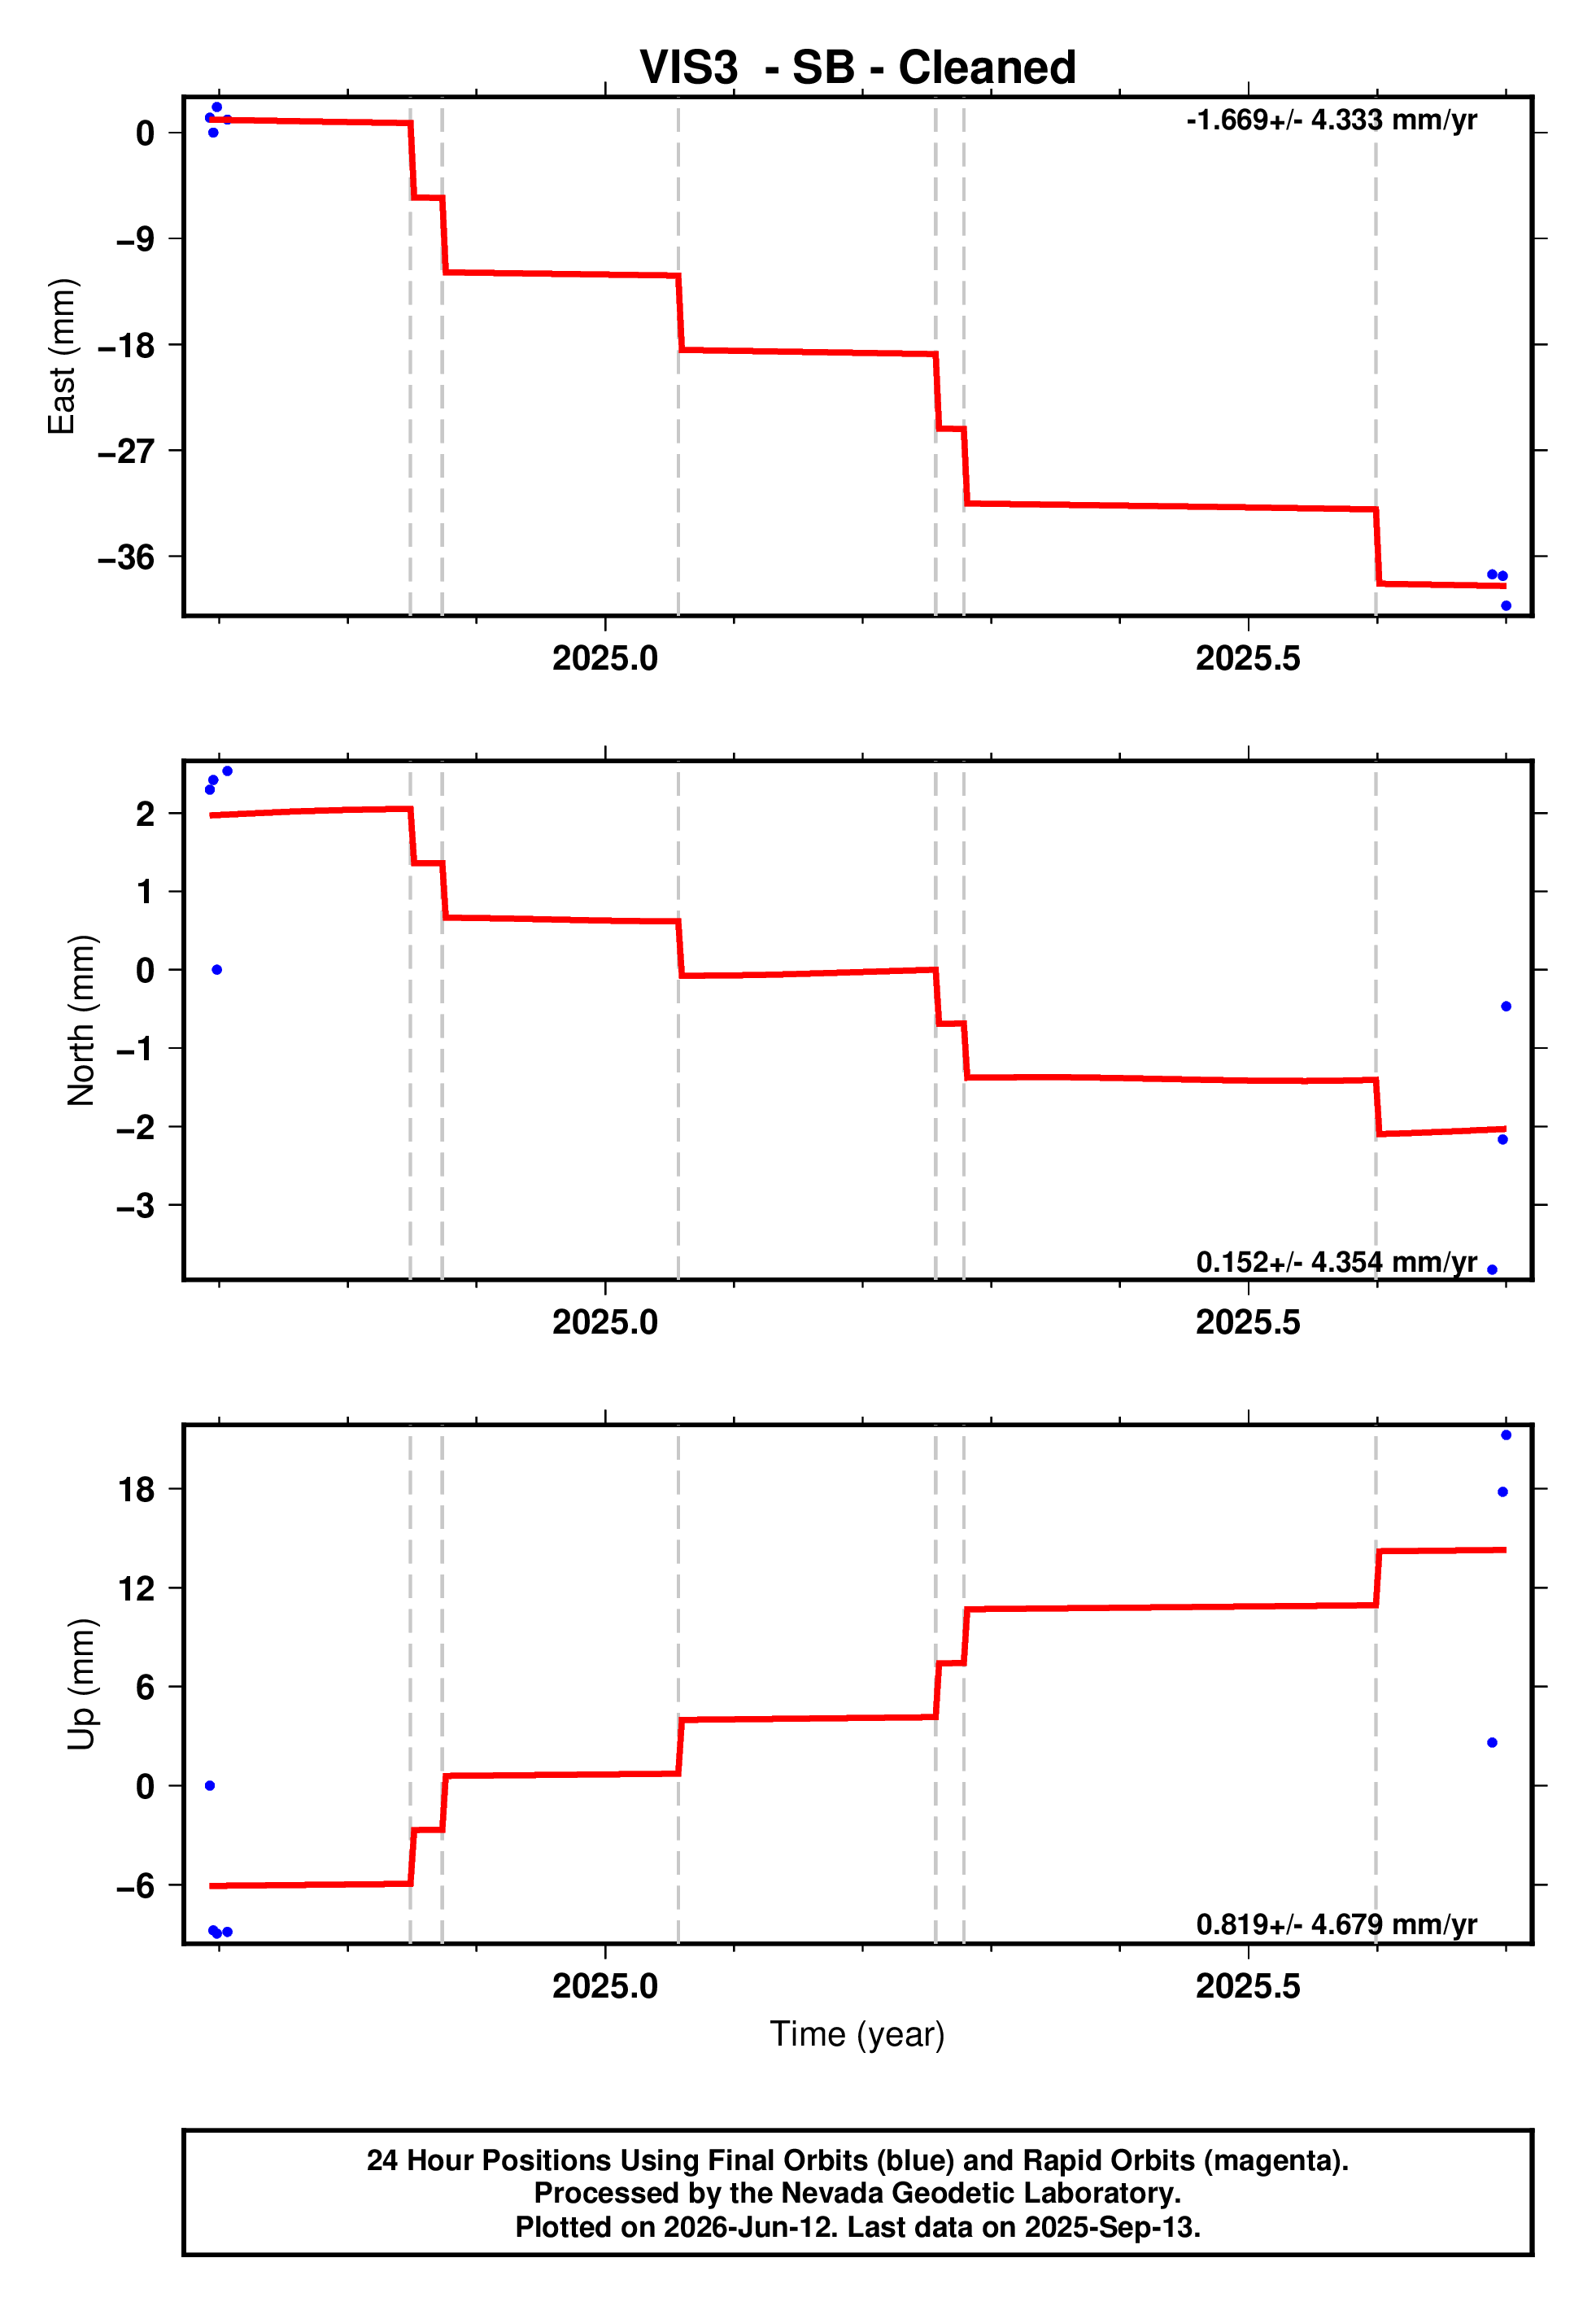
Parameters for the red line fit to the cleaned SB position time series can be found at: |

|
|
Parameters for the red line fit to the detrended position time series can be found at: |
|
|
Parameters for the red line fit to the detrended and cleaned position time series can be found at: |
Steps Information for this station |
||||
|---|---|---|---|---|
| Station ID | Date (YYMMMDD) | Equipment Change Type/ or Event ID | Earthquake Magnitude | Distance (km) |
| VIS3 | 24NOV06 | us7000nq9e | 5.9 | 137.5 |
| VIS3 | 24NOV15 | us7000nrwz | 6.6 | 135.5 |
| VIS3 | 25JAN21 | us6000plel | 5.5 | 88.8 |
| VIS3 | 25APR04 | us6000q41n | 6.9 | 233.3 |
| VIS3 | 25APR12 | us6000q5ka | 6.1 | 118.2 |
| VIS3 | 25AUG07 | us6000qywk | 5.9 | 84.3 |
| Distance is from this station to earthquake epicenter in km. A potential step record appears when this distance is less than 10^(M/2 - 0.79) where M is earthquake magnitude. | ||||
| Steps for all stations are given in the master step file database. | ||||

![]()