Plate boundary deformation between the Pacific and
North America in the Explorer region
Corne Kreemer,
Rob Govers (Utrecht Univ.), Kevin Furlong (Pennsylvania State Univ.) and Bill Holt (SUNY Stony Brook)
In this study we determined the seismic strain rate field associated with earthquakes moment tensors from events in the
Explorer region (Fig. 2) off the coast of Vancouver Island, Canada. This strain rate field is compared with predicted
strain rate field associated with the two different kinematic models that exist for this region; (1) The micro-plate
model (Fig. 1a) with the Explorer region being an independent entity (EXP), (2) The 'pseudo-plate' model, where the
region is cut through by a large transform fault, delineating the Pacific-North American plate boundary. This latter imodel would
imply that most of the Explorer region (east of the transform) is part of the NAM plate.
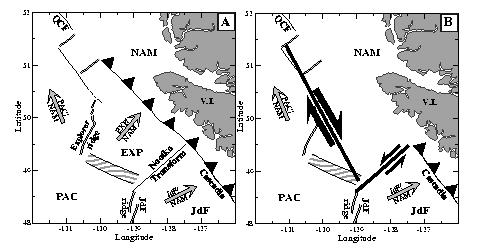 Figure 1. a) Micro-plate model. NAM = North American plate, PAC = Pacific plate,
EXP = Explorer (micro-)plate,
QCF = Queen Charlotte Fault, JdF = Juan de Fuca plate,
and grey arrows are plate motions. b) Pseudo-plate model.
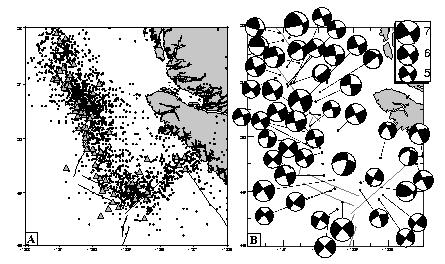
Figure 2. a) Total seismicity in region (circles), triangles indicate the 74 events used in this study,
b) Focal mechanisms of several of the used 74 earthquakes, which moment tensors were used
to obtain an
observed seismic strain rate field.
The strain rates obtained from a Kostrov's summation of the moment tensors are inverted to obtain an estimated self-
consistent strain rate field, using Bessel interpolations. Fig 3a shows the observed and estimated seismic
strain rate field, and Fig 3b shows the velocity field associested with the estimated seismic strain rate field.
Velocities at PAC plate are 50% +/- 30% of NUVEL1A PAC-NAM relative plate motion.
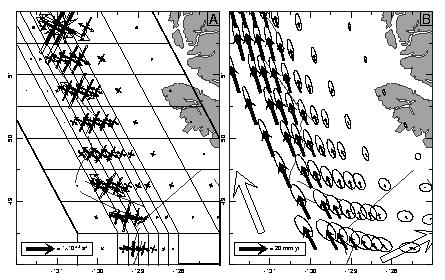 Figure 3. a)
Principal axes of seismic strain rate field, white arrows is observed, and black is estimated.
Figure 3. a)
Principal axes of seismic strain rate field, white arrows is observed, and black is estimated.
b) Velocity field (relative to NAM) associated with seismic strain rate field.
White arrows are NUVEL-1A plate motions
We compared this seismic strain rate field with the predicted strain rate field for the two models that we test
(Fig4b,5b), using simple kinematic boundary conditions (Fig4a,5a).
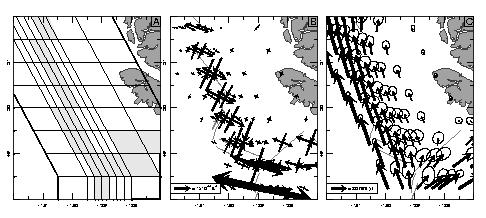 Figure 4. a) Simulation of pseudo-plate model. Grey zones are made weaker, and PAC-NAM and
JdF-NAM motions
were applied on the grid boundaries, b) Principal axes of strain rate field,
and c) Velocity field relative to NAM.
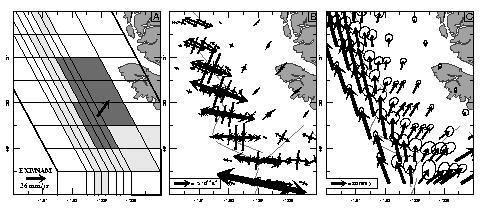 Figure 5. a) Simulation of micro-plate model. Grey zones are made weaker, and the Explorer
region (darker colors) was made more rigid. PAC-NAM, JdF-NAM, and
EXP-NAM motions
were applied on the grid boundaries, b) Principal axes of strain rate field,
and c) Velocity field relative to NAM.
We find that the predicted strain rate field for the pseudo-plate model is more consistent with the seismic strain rate field. Furthermore, the micro-plate model predicts convergence strains along the NAM plate margin, but no observations
of active deformation are present for this region. Finally, we find that high strain rates are predicted along
the Nootka fault, which lacks major seismicity. This strain surplus could be related to the fact that the Nootka
Fault forms, according to our findings, the JdF-NAM plate boundary, where other parts of this boundary (i.e. Cascadia
Subduction zone) is believed to be locked. This would prevent the Nootka fault from slipping.
 Click here for Paper abstract